Krona allows hierarchical data to be explored with zoomable pie charts. Krona charts can be created using an Excel template or KronaTools, which includes support for several bioinformatics tools and raw data formats. The charts can be viewed with a recent version of any major web browser (see Browser support).
I’m not sure that “zoomable pie chart” is an entirely accurate description of Krona. Not inaccurate, just doesn’t clue the reader in on what awaits.
The goal of the CGAL Open Source Project is to provide easy access to efficient and reliable geometric algorithms in the form of a C++ library. CGAL is used in various areas needing geometric computation, such as: computer graphics, scientific visualization, computer aided design and modeling, geographic information systems, molecular biology, medical imaging, robotics and motion planning, mesh generation, numerical methods… More on the projects using CGAL web page.
The Computational Geometry Algorithms Library (CGAL), offers data structures and algorithms like triangulations (2D constrained triangulations, and Delaunay triangulations and periodic triangulations in 2D and 3D), Voronoi diagrams (for 2D and 3D points, 2D additively weighted Voronoi diagrams, and segment Voronoi diagrams), polygons (Boolean operations, offsets, straight skeleton), polyhedra (Boolean operations), arrangements of curves and their applications (2D and 3D envelopes, Minkowski sums), mesh generation (2D Delaunay mesh generation and 3D surface and volume mesh generation, skin surfaces), geometry processing (surface mesh simplification, subdivision and parameterization, as well as estimation of local differential properties, and approximation of ridges and umbilics), alpha shapes, convex hull algorithms (in 2D, 3D and dD), search structures (kd trees for nearest neighbor search, and range and segment trees), interpolation (natural neighbor interpolation and placement of streamlines), shape analysis, fitting, and distances (smallest enclosing sphere of points or spheres, smallest enclosing ellipsoid of points, principal component analysis), and kinetic data structures.
All these data structures and algorithms operate on geometric objects like points and segments, and perform geometric tests on them. These objects and predicates are regrouped in CGAL Kernels.
Finally, the Support Library offers geometric object generators and spatial sorting functions, as well as a matrix search framework and a solver for linear and quadratic programs. It further offers interfaces to third party software such as the GUI libraries Qt, Geomview, and the Boost Graph Library.
I found this earlier today while searching for support for half-edges in graphs (CGAL supports half-edges).
Comments Off on CGAL: Computational Geometry Algorithms Library
RELEASE A High-Level Paradigm for Reliable Large-Scale Server Software.
From the webpage:
RELEASE is an EU FP7 STREP (287510) project that aims to scale the radical concurrency-oriented programming paradigm to build reliable general-purpose software, such as server-based systems, on massively parallel machines. The trend-setting language we will use is Erlang/OTP which has concurrency and robustness designed in. Currently Erlang/OTP has inherently scalable computation and reliability models, but in practice scalability is constrained by aspects of the language and virtual machine. Moreover existing profiling and debugging tools don’t scale.
I found the project after following a lead to:
The Design of Scalable Distributed Erlang N. Chechina, P. Trinder, A. Ghaffari, R. Green, K. Lundin, and R. Virding. Symposium on Implementation and Application of Functional Languages 2012 (IFL’12), Oxford, UK, 2012 (Submitted).
Abstract:
The multicore revolution means that the number of cores in commodity machines is growing exponentially. Many expect 100,000 core clouds (or platforms) to become commonplace, and the best predictions are that core failures on such an architecture will become relatively common, perhaps one hour mean time between core failures. The RELEASE project aims to scale Erlang to build reliable general-purpose software, such as server-based systems, on massively parallel machines. In this paper we present a design of Scalable Distributed (SD) Erlang — an extension of the Distributed Erlang functional programming language for reliable scalability. The design focuses on three aspects of Erlang scalability: scaling the number of Erlang nodes by eliminating transitive connections and introducing scalable groups (s groups); managing process placement in the scaled networks by introducing semi-explicit process placement; and preserving Erlang reliability model.
The content management team of KnowledgeBoard launched its first book entitled “Real-Life Knowledge Management: Lessons from the Field” in April, 2006. This book was a collection of eighteen industrial case studies from twelve different countries. What differentiated this book from others lay in the fact that most of the case studies were a recording of the vast experiences of knowledge workers: the real people on the field. The book was and continues to remain a success and is used in numerous large and small organisations to solve real-life problems today based on learnings from and adaptation of the case studies to the operational norms of these organisations. It is furthermore used as valuable teaching, training and reference material, at different universities and training centres.
During a Contactivity event in 2006, participants of the event mentioned the need for a set of practical methods and techniques for effective knowledge co-creation and sharing. The initial idea was to prepare a list of existing methods and techniques in the form of a short article. During this process, we noted that while existing methods were reasonably well-documented, there existed several undocumented methods and techniques that were developed and used for
specific organisational contexts by knowledge workers. Through further requests from different KnowledgeBoard community members for a new book on practical methods and techniques for knowledge creation and sharing, the content management team of KnowledgeBoard launched a call for KnowledgeBoard’s second book. “Hands-On Knowledge Co-Creation and Sharing: Practical Methods and Techniques”, the book you now hold in your hands, or browse on your screen is the result.
This book presents thirty different hands-on methods and techniques for knowledge co-creation and sharing within collaborative settings. It showcases a wide range of moderation, facilitation, collaboration, and interaction mechanisms through the use of different face-to-face and online methods and techniques. Each presented method/technique is augmented with real-life cases on its use; provides directions on what needs to be done before, during, and after the use of each method/technique to achieve tangible and measurable results; provides a set of tips and tricks on the use and adaptation of the method/technique for different contexts and settings; and provides a list of potholes to avoid when using the method/technique.
The prime audience of this book is industry practitioners, event moderators, facilitators, consultants, researchers, and academia with an interest in the use and development of effective techniques and mechanisms to foster knowledge co-creation and sharing. This book is expected to equip them with a set of usable practical methods and techniques for knowledge co-creation and sharing.
You will have to select, adapt and modify these techniques to suit your particular situation but it does offer a wide range of approaches.
I am not as confident of the people sharing knowledge as the editors and their authors.
My experience with non-profit organizations could be called a cult of orality. There is little or no written documentation, be it requirements for projects, procedures for backups, installation details on applications, database schemas, etc.
Questions both large and small are answered only with oral and incomplete answers.
If answers to questions were in writing, it would be possible to hold people accountable for their answers.
Not to mention the job security that comes from being the only person who knows how applications are configured.
One reason for a lack of knowledge sharing is the lack of benefit for the person sharing the knowledge.
I would think continued employment would be benefit enough but that is a management choice.
Comments Off on Hands-On Knowledge Co-Creation and Sharing
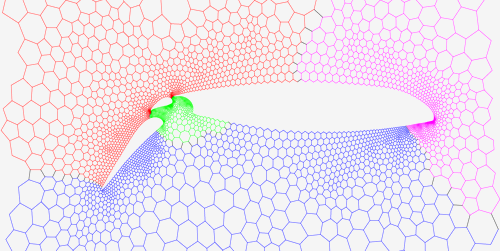
The graph partitioning problem asks for a division of a graph’s node set into k equally sized blocks such that the number of edges that run between the blocks is minimized. An example graph that is partitioned into four blocks:
KaHIP – Karlsruhe High Quality Partitioning – is a family of graph partitioning programs. It includes KaFFPa (Karlsruhe Fast Flow Partitioner) in its variants Strong, Eco and Fast, KaFFPaE (KaFFPaEvolutionary) which is a parallel evolutionary algorithm that uses KaFFPa to provide combine and mutation operations, as well as KaBaPE which extends the evolutionary algorithm. Moreover, specialized techniques are included to partition road networks (Buffoon) and to output a vertex separator from a given partition.
Licence
The program is licenced under GPL 3.0. Please let us know if you need a commercial licence.
If you publish results using our algorithms, please acknowledge our work by quoting the following paper:
@inproceedings{sandersschulz2013,
AUTHOR = {Sanders, Peter and Schulz, Christian},
TITLE = {{Think Locally, Act Globally: Highly Balanced Graph Partitioning}},
BOOKTITLE = {Proceedings of the 12th International Symposium on Experimental Algorithms (SEA’13)},
SERIES = {LNCS},
PUBLISHER = {Springer},
YEAR = {2013},
VOLUME = {7933}
PAGES = {164–175}
}
The algorithms that are included for download are mainly based on the following publications:
Peter Sanders and Christian Schulz. Engineering Multilevel Graph Partitioning Algorithms. In Proceedings of the 19th European Symposium on Algorithms (ESA’11), volume 6942 of LNCS, pages 469–480. Springer, 2011. Download PDF.
Peter Sanders and Christian Schulz. Distributed Evolutionary Graph Partitioning. In Proceedings of the 12th Workshop on Algorithm Engineering and Experimentation (ALENEX’12), pages 16–19, 2012. Download PDF.
Peter Sanders and Christian Schulz. High Quality Graph Partitioning. In Proceedings of the 10th DIMACS Implementation Challenge Workshop: Graph Partitioning and Graph Clustering, pages 1–17, AMS, 2013. Download PDF.
Peter Sanders and Christian Schulz. Think Locally, Act Globally: Highly Balanced Graph Partitioning. In Proceedings of the 12th International Symposium on Experimental Algorithms (SEA’13), volume 7933 of LNCS, pages 164–175, 2013. Download PDF.
Christian Schulz. High Quality Graph Partitioning. PhD thesis. Karlsruhe Institute of Technology, 2013. ISBN 978-3844264623, epubli GmbH. Download PDF.
Note: this release does NOT contain natural cuts due to an US software patent. If you want to use specialized techniques for road networks, e.g. Buffoon, please send us an email.
News of interest to the graph side of the house!
And topic maps for the same reason. That is obtaining the smallest number of associations that run across partitions.
Although, due to merging, topic maps present additional complications. It isn’t possible to predict when additions to one partition may result in merges across one or more partitions.
I’m not sure how that would be anticipated except by restrictions on merging rules. Suggestions?
One of the first things I needed to learn when I started using Neo4j was how to model my domain using nodes and relationships and it wasn’t initially obvious to me what things should be nodes.
Luckily Ian Robinson showed me a mini-algorithm which I found helpful for getting started. The steps are as follows:
Write out the questions you want to ask
Highlight/underline the nouns
Those are your nodes!
This is reasonably similar to the way that we work out what our objects should be when we’re doing OO modelling and I thought I’d give it a try on some of the data sets that I’ve worked with recently:
Female friends of friends that somebody could go out with
Goals scored by Arsenalplayers in a particular season
Colleagues who have similar skills to me
Episodes of a TV program that a particular actor appeared in
Customers who would be affected if a piece of equipment went in for repair
If you’re like me and aren’t that great at English grammar we can always cheat and get NLTK to help us out:
Pay particular attention to Mark’s use of NLTK to extract likely nodes from data.
As far as I can tell, Neo4j does not support half-edges, that is an edge with only one node. To support the use case where the player of a role (in topic map parlance) is unknown.
We know that Mary is married, for example, but we don’t know the name of her husband.
But we want to assign properties to the marriage edge (association) but there is no edge to carry those properties. Such as who reported Mary was married?
Hard to say if Overtone will be of more interest to musicians who want to learn functional programming or functional programmers who want a deeper understanding of music or people for who the usual baseball, book publishing, web pages, etc., examples just don’t cut it. 😉
While looking for holiday music for Overtone, I did stumble across:
At over 500 pages, this living text is also for sale in hard copy by Cambridge University Press. Do us all a favor and if the electronic version proves useful to you, ask your library to order a hard copy. And/or recommend it to others. That will encourage presses to continue to allow electronic versions of hard copy materials to circulate freely.
If you are interested in the mathematics that underlie music or need to know more for use in music retrieval, this is a good place to start.
I struck out on finding Christmas music written with Overtone.
I did find this video:
I would deeply appreciate a pointer to Christmas music with or for Overtone.
Many book/articles about Haskell start by introducing some esoteric formula (quick sort, Fibonacci, etc…). I will do the exact opposite. At first I won’t show you any Haskell super power. I will start with similarities between Haskell and other programming languages. Let’s jump to the mandatory “Hello World”.
OpenSearchServer is a powerful, enterprise-class, search engine program. Using the web user interface, the crawlers (web, file, database, …) and the REST/RESTFul API you will be able to integrate quickly and easily advanced full-text search capabilities in your application. OpenSearchServer runs on Linux/Unix/BSD/Windows.
…
Search functions
Advanced full-text search features
Phonetic search
Advanced boolean search with query language
Clustered results with faceting and collapsing
Filter search using sub-requests (including negative filters)
Geolocation
Spell-checking
Relevance customization
Search suggestion facility (auto-completion)
Indexation
Supports 17 languages
Fields schema with analyzers in each language
Several filters: n-gram, lemmatization, shingle, stripping diacritic from words,…
Automatic language recognition
Named entity recognition
Word synonyms and expression synonyms
Export indexed terms with frequencies
Automatic classification
Document supported
HTML / XHTML
MS Office documents (Word, Excel, Powerpoint, Visio, Publisher)
OpenOffice documents
Adobe PDF (with OCR)
RTF, Plaintext
Audio files metadata (wav, mp3, AIFF, Ogg)
Torrent files
OCR over images
Crawlers
The web crawler for internet, extranet and intranet
The file systems crawler for local and remote files (NFS, SMB/CIFS, FTP, FTPS, SWIFT)
The database crawler for all JDBC databases (MySQL, PostgreSQL, Oracle, SQL Server, …)
Filter inclusion or exclusion with wildcards
Session parameters removal
SQL join and linked files support
Screenshot capture
Sitemap import
General
REST API (XML and JSON)
SOAP Web Service
Monitoring module
Index replication
Scheduler for management of periodic tasks
WordPress plugin and Drupal module
OpenSearchServer is something to consider if your project is GPL v3 compatible.
Even in an enterprise context, you don’t have to be better than Google at searching the entire WWW.
You just have to be better at searching content of interest to a user, project, department, etc.
The difference between your search results and Google’s should be the difference of a breakfast on near-food at McDonald’s and the best home-cooked breakfast you can imagine.
One is a mass-produced product that is the same over the world, the other is customized to your taste.
…you can’t use log-linear analysis if your dataset has more than, say, 10 variables! This is because the process is exponential in the number of variables. That is where our new work makes a difference. The question was: how can we keep the rigorous statistical foundations of classical log-linear analysis but make it work for datasets with hundreds of variables?
The main part of the answer is “chordal graphs”, which are the graphs made of triangular structures. We showed that for this class of models, the theory is scalable for high-dimensional datasets. The rest of the solution involved melding the classical statistical machinery with advanced data mining techniques from association discovery and graphical modelling.
The result is Chordalysis: a log-linear analysis method for high-dimensional data. Chordalysis makes it possible to discover the structure of datasets with hundreds of variables on a standard computer. So far we’ve applied it successfully to datasets with up to 750 variables. (emphasis added)
Association discovery is a fundamental data mining task. The primary statistical approach to association discovery between variables is log-linear analysis. Classical approaches to log-linear analysis do not scale beyond about ten variables. We develop an efficient approach to log-linear analysis that scales to hundreds of variables by melding the classical statistical machinery of log-linear analysis with advanced data mining techniques from association discovery and graphical modeling.
Being curious about what was meant by “…a standard computer…” I searched the paper to find:
The conjunction of these features makes it possible to scale log-linear analysis to hundreds of variables on a standard desktop computer. (page 3 of the PDF, the pages are unnumbered)
In a couple of Neo4j talks I’ve done recently I’ve been asked how long it takes to get used to modelling data in graphs and whether I felt it’s simpler than alternative approaches.
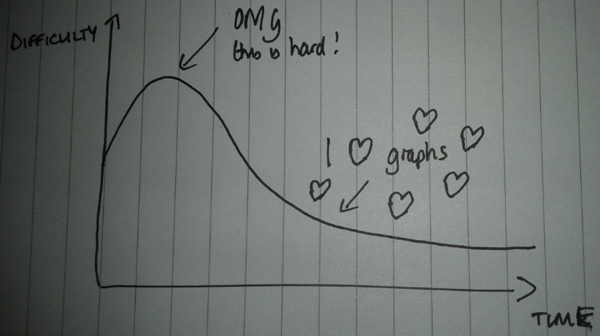
My experience of ‘thinking in graphs’™ closely mirrors what I believe is a fairly common curve when learning technologies which change the way you think:
There is an initial stage where it seems really hard because it’s different to what we’re used to and at this stage we might want to go back to what we’re used to.
If we persevere, however, we will get over that hump and after that it will be difficult to imagine another way of modelling data – at least in domains where the connections between different bits of data are important.
Once we’re over the hump data modelling should seem like fun and we’ll start looking to see whether we can use graphs to solve other problems we’ve got.
I wasn’t sure whether modelling in graphs is simpler than alternative approaches so as a thought experiment I decided to see what part of my football graph would look like if it was modelled in a relational database.
…
See Mark’s post for the comparison between a normalized relational database model versus a graph model.
I suspect Mark is right about the difficulty of moving from a fully normalized relational paradigm to graphs, but no one grows up thinking in normalized relational databases.
Remember your first encounter with databases (mine was DBase III or was that DBase II?), the normalized relational paradigm seemed unnatural. On a par with unmentionable practices.
Here’s an experiment you can try with non-IT and IT people.
Show both groups Mark’s diagrams and ask them which one is easier to understand?
I think you know where my money is riding. 😉
Could be useful empirical knowledge in terms of preparing educational materials for the respective groups.
Comments Off on Neo4j: The ‘thinking in graphs’ curve
When learning a new technology it’s best to have a toy problem in mind so that you’re not just reimplementing another glorified “Hello World” project. Also, if you need lots of data, it’s best to pull in a fun data set that you already have some familiarity with. This allows you to lean upon already established intuition of the data set so that you can more quickly make use of the technology. (And as an aside, this just why we so regularly use the StackExchange SciFi data set when presenting our new ideas about Solr.)
When approaching a graph database technology like Neo4J, if you’re as avid of a Twitter user as I am then POOF you already have the best possible data set for becoming familiar with the technology — your own Social network. And this blog post will help you download and setup Neo4J, set up a Twitter app (needed to access the Twitter API), pull down your social network as well as any other social network you might be interested in. At that point we’ll interrogate the network using the Neo4J and the Cypher syntax. Let’s go!
In fact, it is one of the better introductions to Neo4j I have ever seen.
I like historical material but when you have seen dozens if not hundreds of presentations/slides repeating the same basic information, you start to worry about there being a Power-Point Slide Shortage. 😉
No danger of that with John’s post!
Following the instructions took a while in my case, mostly because I was called away to cook a pork loin (it’s a holiday here), plus rolls, etc., right as I got the authentication tokens. -( Then I had issues with a prior version of Neo4j that was already running. I installed via an installer and it had written a start script in rc4.d.
The latest version conflicts with the running older version and refuses to start without any meaningful error message. But, ps -ef | grep neo4j found the problem. Renaming the script while root, etc., fixed it. Do need to delete the older version at some point.
After all that, it was a piece of cake. John’s script works as promised.
I don’t know how to break this to John but now he is following but not being followed by neo4j, peterneubauer (Neo4j hotshot), and markhneedham (Neo4j hotshot). (As of 28 Nov. 2013, your results may vary.)
InfiniSQL is a relational database management system (RDBMS) composed entirely from the ground up. InfiniSQL’s goals are:
Horizontal Scalability
Continuous Availability
High Throughput
Low Latency
High Performance For Complex, Multi-Host Transactions
Ubiquity
InfiniSQL has been tested to support over 500,000 complex transactions per second with over 100,000 simultaneous connections. This was on a cluster of only 12 single socket x86-64 servers. Subscribed hardware in this environment was exhausted from this effort–so the true upper limits of capacity are unknown. InfiniSQL’s scalability across multiple nodes appears to be limitless!
From what I read on the website, InfiniSQL operates entirely in memory and so has not hit the I/O barrier to storage.
Very much at alpha stage of development but the “500,000 complex transactions per second” is enough to make it worth watching.
University of Wisconsin students and researchers set out in “word wagons” nearly 50 years ago to record the ways Americans spoke in various parts of the country.
Now, they’re doing it again, only virtually.
This time they won’t be lugging reel-to-reel tape recorders or sleeping in vans specially equipped with beds, stoves and sinks. Instead, work to update the Dictionary of American Regional English is being done in front of computers, reading online survey results.
“Of course, language changes and a lot of people have the notion that American English is becoming homogenized,” said Joan Houston Hall, who has worked on the dictionary since 1975 and served as its editor since 2000.
The only way to determine if that is true, though, is to do more research, she said.
The dictionary, known as DARE, has more than 60,000 entries exposing variances in the words, phrases, pronunciations, and pieces of grammar and syntax used throughout the country. Linguists consider it a national treasure, and it has been used by everyone from a criminal investigator in the 1990s tracking down the Unabomber to Hollywood dialect coaches trying to be as authentic as possible.
…
A great resource if you are creating topic maps for American literature during the time period in question.
Be aware that field work stopped in 1970 and any supplements will be by online survey:
Even though no new research has been done for the dictionary since 1970, Hall said she hopes it can now be updated more frequently now that it is going online. The key will be gathering new data tracking how language has changed, or stayed the same, since the first round of field work ended 43 years ago.
But why not break out the 21st century version of the “word wagon” and head out in the field again?
“Because it would be way too expensive and time-consuming,” Hall said, laughing.
So, instead, Hall is loading up the virtual “word wagon” also known as the online survey.
For language usage, there is a forty-three (43) year gap in coverage. Use caution as the vocabulary you are researching moves away from 1970.
The continuation of the project by online surveys will only capture evidence from people who complete online surveys.
Keep that limitation in mind when using DARE after it resumes “online” field work.
Personally, I would prefer more complete field work over the noxious surveillance adventures by non-democratic elements of the U.S. government.
BTW, DARE Digital, from Harvard Press is reported to set you back $150/year.
Comments Off on American Regional English dictionary going online (DARE)
We are very please to announce that new crawl data is now available! The data was collected in 2013, contains approximately 2 billion web pages and is 102TB in size (uncompressed).
We’ve made some changes to the data formats and the directory structure. Please see the details below and please share your thoughts and questions on the Common Crawl Google Group.
Format Changes
We have switched from ARC files to WARC files to better match what the industry has standardized on. WARC files allow us to include HTTP request information in the crawl data, add metadata about requests, and cross-reference the text extracts with the specific response that they were generated from. There are also many good open source tools for working with WARC files.
We have switched the metadata files from JSON to WAT files. The JSON format did not allow specifying the multiple offsets to files necessary for the WARC upgrade and WAT files provide more detail.
We have switched our text file format from Hadoop sequence files to WET files (WARC Encapsulated Text) that properly reference the original requests. This makes it far easier for your processes to disambiguate which text extracts belong to which specific page fetches.
…
Jordan continues to outline the directory structure of the 2013 crawl data and lists additional resources that will be of interest.
If you aren’t Google or some reasonable facsimile thereof (yet), the Common Crawl data set is your doorway into the wild wild content of the WWW.
How do your algorithms fare when matched against the full range of human expression?
As a first blog post, I decided to describe a way to detect first stories (a.k.a new events) on Twitter as they happen. This work is part of the Thesis I wrote last year for my MSc in Computer Science in the University of Edinburgh.You can find the document here.
Every day, thousands of posts share information about news, events, automatic updates (weather, songs) and personal information. The information published can be retrieved and analyzed in a news detection approach. The immediate spread of events on Twitter combined with the large number of Twitter users prove it suitable for first stories extraction. Towards this direction, this project deals with a distributed real-time first story detection (FSD) using Twitter on top of Storm. Specifically, I try to identify the first document in a stream of documents, which discusses about a specific event. Let’s have a look into the implementation of the methods used.
Titan is a distributed graph database capable of supporting graphs on the order of 100 billion edges and sustaining on the order of 1 billion transactions a day (see Educating the Planet with Pearson). Software architectures that leverage such Big Graph Data typically have 100s of application servers traversing a distributed graph represented across a multi-machine cluster. These architectures are not common in that perhaps only 1% of applications written today require that level of software/machine power to function. The other 99% of applications may only require a single machine to store and query their data (with a few extra nodes for high availability). Such boutique graph applications, which typically maintain on the order of 100 million edges, are more elegantly served by Titan 0.4.1+. In Titan 0.4.1, the in-memory caches have been advanced to support faster traversals which makes Titan’s single-machine performance comparable to other single machine-oriented graph databases. Moreover, as the application scales beyond the confines of a single machine, simply adding more nodes to the Titan cluster allows boutique graph applications to seamlessly grow to become Big Graph Data applications (see Single Server to Highly Available Cluster).
A short walk on the technical side of Titan.
I would replace “boutique” with “big data” and say Titan allows customers to seamlessly transition from “big data” to “bigger data.”
Having “big data” is like having a large budget under your control.
What matters is the user is the status of claiming to possess it.
Analysts dealing with grouped data and complex hierarchical structures in their data ranging from measurements nested within participants, to counties nested within states or students nested within classrooms often find themselves in need of modeling tools to reflect this structure of their data. In R there are two predominant ways to fit multilevel models that account for such structure in the data. These tutorials will show the user how to use both the lme4 package in R to fit linear and nonlinear mixed effect models, and to use rstan to fit fully Bayesian multilevel models. The focus here will be on how to fit the models in R and not the theory behind the models. For background on multilevel modeling, see the references. [1]
Jared walks the reader through adding the required packages, obtaining sample data and performing analysis on the sample data.
If you think about it, all data points are “nested” in one complex hierarchical structure or another.
Sometimes we choose to ignore those structures and sometimes we account for some chosen subset of complex hierarchical structures.
The important point being that our models may be useful but they are not the subjects being modeled.
Comments Off on Getting Started with Multilevel Modeling in R
A very lucid and entertaining lecture, complete a theoretical basis for a postal scam. 😉
In the segments, Professor Abu-Mostafa refers to other lectures and topics previously covered. That will have you thinking about watching the lectures in order.
May not be good substitutes for holiday favorites but are a pleasure to watch.
“If it looks like a duck, swims like a duck, and quacks like a duck, then it probably is a duck.”
The “duck test”.
Performance of machine learning algorithms, supervised or unsupervised, is often significantly enhanced when a variety of feature families, or multiple views of the data, are available. For example, in the case of web pages, one feature family can be based on the words appearing on the page, and another can be based on the URLs and related connectivity properties. Similarly, videos contain both audio and visual signals where in turn each modality is analyzed in a variety of ways. For instance, the visual stream can be analyzed based on the color and edge distribution, texture, motion, object types, and so on. YouTube videos are also associated with textual information (title, tags, comments, etc.). Each feature family complements others in providing predictive signals to accomplish a prediction or classification task, for example, in automatically classifying videos into subject areas such as sports, music, comedy, games, and so on.
We have released a dataset of over 100k feature vectors extracted from public YouTube videos. These videos are labeled by one of 30 classes, each class corresponding to a video game (with some amount of class noise): each video shows a gameplay of a video game, for teaching purposes for example. Each instance (video) is described by three feature families (textual, visual, and auditory), and each family is broken into subfamilies yielding up to 13 feature types per instance. Neither video identities nor class identities are released.
The concept of multiview learning is clear enough but the term was unfamiliar.
In recent years, a great many methods of learning from multi-view data by considering the diversity of different views have been proposed. These views may be obtained from multiple sources or different feature subsets. In trying to organize and highlight similarities and differences between the variety of multi-view learning approaches, we review a number of representative multi-view learning algorithms in different areas and classify them into three groups: 1) co-training, 2) multiple kernel learning, and 3) subspace learning. Notably, co-training style algorithms train alternately to maximize the mutual agreement on two distinct views of the data; multiple kernel learning algorithms exploit kernels that naturally correspond to different views and combine kernels either linearly or non-linearly to improve learning performance; and subspace learning algorithms aim to obtain a latent subspace shared by multiple views by assuming that the input views are generated from this latent subspace. Though there is significant variance in the approaches to integrating multiple views to improve learning performance, they mainly exploit either the consensus principle or the complementary principle to ensure the success of multi-view learning. Since accessing multiple views is the fundament of multi-view learning, with the exception of study on learning a model from multiple views, it is also valuable to study how to construct multiple views and how to evaluate these views. Overall, by exploring the consistency and complementary properties of different views, multi-view learning is rendered more effective, more promising, and has better generalization ability than single-view learning.
Be forewarned that the survey runs 59 pages and has 9 1/2 pages of references. Not something you take home for a quick read. 😉
Originally written by Bjarne Däcker and later revised by Robert Virding, the Erlang Handbook is a summary of the language features and the runtime system. It is aimed at people with some programming experience, serving as a quick introduction to the Erlang domain.
Jans was extolling the use of graphs to manage data about telecom customers, with an emphasis on “near real-time.”
Something kept nagging at me when I was watching the video but it was only afterwards that I remembered Ericsson’s development and use of Erlang for exactly that use case.
By way of excuse, I was watching Jans’ video at the end of a long day. 😉
Suggestions on where I can look for anyone using Erlang-based message passing for distributed processing of graphs?
With a truthful description like this one:
Erlang is a programming language used to build massively scalable soft real-time systems with requirements on high availability. Some of its uses are in telecoms, banking, e-commerce, computer telephony and instant messaging. Erlang’s runtime system has built-in support for concurrency, distribution and fault tolerance. (from http://www.erlang.org/)
While it is fair to say that “Both releases contain a number of bug fixes.” I think that gives the wrong impression.
The Lucene 4.6.0 release has 23 new features versus 5 bugs and Solr 4.6.0 has 17 new features versus 14 bug fixes. Closer but 40 new features total versus 22 bug fixes sounds good to me! 😉
Just to whet your appetite for looking at the detailed change lists:
It could be an extension of the existing DocumentDictionary (which takes terms, weights and (optionally) payloads from the stored documents in the index). The only exception being that instead of taking the weights for the terms from the specified weight fields, it could compute the weights using an user-defn expression, that uses one or more NumicDocValuesField from the document.
Example:
let the document have
product_id
product_name
product_popularity
product_profit
Then this implementation could be used with an expression of “0.2*product_popularity + 0.8*product_profit” to determine the weights of the terms for the corresponding documents (optionally along with a payload (product_id))
The existing optimistic concurrency features of Solr can be very handy for ensuring that you are only updating/replacing the version of the doc you think you are updating/replacing, w/o the risk of someone else adding/removing the doc in the mean time – but I’ve recently encountered some situations where I really wanted to be able to let the client specify an arbitrary version, on a per document basis, (ie: generated by an external system, or perhaps a timestamp of when a file was last modified) and ensure that the corresponding document update was processed only if the “new” version is greater then the “old” version – w/o needing to check exactly which version is currently in Solr. (ie: If a client wants to index version 101 of a doc, that update should fail if version 102 is already in the index, but succeed if the currently indexed version is 99 – w/o the client needing to ask Solr what the current version)
The percolator is essentially search in reverse, which can by confusing initially for many people. This post will help to solve that problem and give more information on the redesigned percolator. We have added a lot more features to it to help users work with percolated documents/queries more easily.
In normal search systems, you store your data as documents and then send your questions as queries. The search results are a list of documents that matched your query.
With the percolator, this is reversed. First, you store the queries and then you send your ‘questions’ as documents. The percolator results are a list of queries that matched the document.
So what can do percolator do for you? The percolator can be used for a number of use cases, but the most common is for alerting and monitoring. By registering queries in Elasticsearch, your data can be monitored in real-time. If data with certain properties is being indexed, the percolator can tell you what queries this data matches.
For example, imagine a user “saving” a search. As new documents are added to the index, documents are percolated against this saved query and the user is alerted when new documents match. The percolator can also be used for data classification and user query feedback.
Even as a beta feature, this sounds interesting.
Another use case could be adhering to a Service Level Agreement (SLA).
You could have tiered search result packages that guarantee the freshness of search results. Near real-time would be more expensive than within six (6) hours or within the next business day. The match to a stored query could be queued up for delivery in accordance with your SLA.
Why shouldn’t faster information cost more than slower information?
True, there are alternative suppliers of information but then you remind your prospective client of the old truism, you get what you pay for.
That is not contradicted by IT disasters such as HeathCare.gov.
The government hired contractors that are hard to distinguish from their agency counterparts and who are interested in “butts in seats” and not any useful results.
In that sense, the government literally got what it paid for. Had it wanted a useful heathcare IT project, it would not have put government drones in charge of the project.
A similarity model is a set of abstractions and metrics to define to what extent things are similar. That’s quite a general definition. In this article I will only consider textual similarity. In this context, the uses of similarity models can be divided into two categories: classification of documents, with a finite set of categories where the categories are known; and information retrieval where the problem can be defined as ‘find the the most relevant documents to a given query’. In this article I will look into the latter category.
Elasticsearch provides the following similarity models: default, bm25, drf and ib. I have limited the scope of this article to default and bm25. The divergence from randomness and information based similarities may feature in a future article.
Konrad goes on to talk about the default similarity model in Elasticsearch, Tf/idf and BM25 (aka Okapi BM25), a probabilistic model.
While the build-in similarity models offer a lot of mileage no doubt, I am more intrigued by the potential for creating a custom similarity model.
As you know, some people think English words are just English words. Search engines tend to ignore time, social class, context of use, etc., in returning all the “instances” of an English word.
That is to say the similarity model for one domain or period could be quite different from the similarity model for another.
Domain or period specific similarity models would be difficult to construct and certainly less general.
Given the choice, of being easy, general and less accurate versus being harder, less general and more accurate, which would you choose?
Does your answer change if you are a consumer looking for the best results or a developer trying to sell “good enough” results?
How to Use Graph Databases to Analyze Relationships, Risks and Business Opportunities (YouTube)
Graph Databases, Triple Stores and their uses… (slides of Jans Aasman at Enterprise Data World 2012)
From the description:
Graph databases are one of the new technologies encouraging a rapid re-thinking of the analytics landscape. By tracking relationships – in a network of people, organizations, events and data – and applying reasoning (inference) to the data and connections, powerful new answers and insights are enabled.
This presentation will explain how graph databases work, and how graphs can be used for a number of important functions, including risk management, relationship analysis and the identification of new business opportunities. It will use a case study in the manufacturing sector to demonstrate how complex relationships can be discovered and integrated into analytical systems. For example, what are the repercussions for the supply chain of a major flood in China? Which products are affected by political unrest in Thailand? Has a sub-subcontractor started selling to our competition and what does that mean for us? What happened historically to the price of an important sub-component when the prices for crude oil or any other raw material went up? Lots of answers can be provided by graph (network) analysis that cannot be answered any other way, so it is crucial that business and BI executives learn how to use this important new tool.
At time marks 18:30 to 19:09, major customers who are interested in graph databases.
An impressive list of potential customers.
If you wanted to find comments about this presentation you could search for:
How to Use Graph Databases to Analyze Relationships, Risks and Business Opportunities (YouTube) (9,530 “hits”)
Graph Databases, Triple Stores and their uses… (slides of Jans Aasman at Enterprise Data World 2012) (7 “hits”)
If you pick the wrong title as your search string, you will miss 9,523 mentions of this video on the WWW.
The same danger comes up when you rely on normalized data, the sort of data you saw in this video.
If the data you are searching has missed data that needs to be normalized, well, you just don’t find the data.
With a topic map based system, normalization isn’t necessary so long as there is mapping in the topic map.
Think of it this way, you can normalize data over and over again, making it unusable by its source, or you can create a mapping rule into a topic map once.
And the data remains findable by its original creator or source.
I would say yes, topic maps are graphs++, they don’t require normalization.
Filed under: News,Open Data — Patrick Durusau @ 5:24 pm
BBC throws weight behind open data movement by Sophie Curtis.
From the post:
The BBC has signed Memoranda of Understanding (MoUs) with the Europeana Foundation, the Open Data Institute, the Open Knowledge Foundation and the Mozilla Foundation, supporting free and open internet technologies.
The agreements will enable closer collaboration between the BBC and each of the four organisations on a range of mutual interests, including the release of structured open data and the use of open standards in web development, according to the BBC.
One aim of the agreement is to give clear technical standards and models to organisations who want to work with the BBC, and give those using the internet a deeper understanding of the technologies involved.
The MoUs also bring together several existing areas of research and provide a framework to explore future opportunities. Through this and other initiatives, the BBC hopes to become a catalyst for open innovation by publishing clear technical standards, models, expertise and – where feasible – data.
That’s good news!
I think.
I looked in Sophie’s story for links to the four Memoranda of Understanding (MoUs) but could not find them.
So I visited the press releases from the various participants:
As soon as I heard the news that Mathematica was being made available completely free on the Raspberry Pi, I just had to get myself a Pi and have a play. So, I bought the Raspberry Pi Advanced Kit from my local Maplin Electronics store, plugged it to the kitchen telly and booted it up. The exercise made me miss my father because the last time I plugged a computer into the kitchen telly was when I was 8 years old; it was Christmas morning and dad and I took our first steps into a new world with my Sinclair Spectrum 48K.
An early but very detailed report on using Mathematica on the Raspberry Pi.
The post will be more meaningful if you have a Raspberry Pi to follow along.
With a single Raspberry Pi, slower than the author’s laptop, but that’s not unexpected.
If you see news of Raspberry Pi network running Mathematica, poke me.
Comments Off on Playing with Mathematica on Raspberry Pi
The WBG Taxonomy is a classification schema which represents the concepts used to describe the World Bank Group’s topical knowledge domains and areas of expertise – expertise – the ‘what we do’ and ‘what we know’ aspect of the Bank’s work. The WBG Taxonomy provides an enterprise-wide, application-independent framework for describing all of the Bank’s areas of expertise and knowledge domains, current as well as historical, representing the language used by domain experts and domain novices, and Bank staff and Bank clients.
Before your nieces and nephews (at least in the U.S.) start chewing up your bandwidth over the Thanksgiving Holidays, you may want to grab the most recent releases from Cloudera.
If you are traveling, it will give you something to do during airport delays. 😉
Comments Off on CDH 4.5, Manager 4.8, Impala 1.2.1, Search 1.1