Another Word For It Patrick Durusau on Topic Maps and Semantic Diversity

June 30, 2016

Curse of Dimensionality Explained

Filed under: Dimension Reduction,Dimensions — Patrick Durusau @ 1:07 pm

Curse of Dimensionality Explained by Nikolay Manchev.

Nikolay uses the following illustration:

curse-dimensions-460

And follows with (in part):


The curse of dimensionality – as the number of dimensions increases, the number of regions grows exponentially.

This means we have to use 8’000 observations in three-dimensional space to get the same density as we would get from 20 observations in a one-dimensional space.

This illustrates one of the key effects of the curse of dimensionality – as dimensionality increases the data becomes sparse. We need to gather more observations in order to present the classification algorithm with a good space coverage. If we, however, keep increasing the number of dimensions, the number of required observations quickly goes beyond what we can hope to gather.

See Nikolay’s post for more details but I thought the illustration of sparsity induced by dimensions was worth repeating.

October 25, 2014

An interactive visualization to teach about the curse of dimensionality

Filed under: Dimension Reduction,Dimensions,Visualization — Patrick Durusau @ 2:36 pm

An interactive visualization to teach about the curse of dimensionality by Jeff Leek.

From the post:

I recently was contacted for an interview about the curse of dimensionality. During the course of the conversation, I realized how hard it is to explain the curse to a general audience. One of the best descriptions I could come up with was trying to describe sampling from a unit line, square, cube, etc. and taking samples with side length fixed. You would capture fewer and fewer points. As I was saying this, I realized it is a pretty bad way to explain the curse of dimensionality in words. But there was potentially a cool data visualization that would illustrate the idea. I went to my student Prasad, our resident interactive viz design expert to see if he could build it for me. He came up with this cool Shiny app where you can simulate a number of points (n) and then fix a side length for 1-D, 2-D, 3-D, and 4-D and see how many points you capture in a cube of that length in that dimension. You can find the full app here or check it out on the blog here:

An excellent visualization of the “curse of dimensionality!”

The full app will take several seconds to redraw the screen when the length of the edge gets to .5 and above (or at least that was my experience).

October 10, 2014

Visualizing MNIST: An Exploration of Dimensionality Reduction

Filed under: Dimension Reduction,Machine Learning — Patrick Durusau @ 7:00 pm

Visualizing MNIST: An Exploration of Dimensionality Reduction by Christopher Olah.

From the post:

At some fundamental level, no one understands machine learning.

It isn’t a matter of things being too complicated. Almost everything we do is fundamentally very simple. Unfortunately, an innate human handicap interferes with us understanding these simple things.

Humans evolved to reason fluidly about two and three dimensions. With some effort, we may think in four dimensions. Machine learning often demands we work with thousands of dimensions – or tens of thousands, or millions! Even very simple things become hard to understand when you do them in very high numbers of dimensions.

Reasoning directly about these high dimensional spaces is just short of hopeless.

As is often the case when humans can’t directly do something, we’ve built tools to help us. There is an entire, well-developed field, called dimensionality reduction, which explores techniques for translating high-dimensional data into lower dimensional data. Much work has also been done on the closely related subject of visualizing high dimensional data.

These techniques are the basic building blocks we will need if we wish to visualize machine learning, and deep learning specifically. My hope is that, through visualization and observing more directly what is actually happening, we can understand neural networks in a much deeper and more direct way.

And so, the first thing on our agenda is to familiarize ourselves with dimensionality reduction. To do that, we’re going to need a dataset to test these techniques on.

Extremely useful illustration of dimensional reduction, exploring “recognition” of hand written digits.

I agree that “Reasoning directly about these high dimensional spaces is just short of hopeless.” However, unlike our machines, humans don’t need high dimensional spaces in order to recognize hand written digits. 😉

I first saw this in a tweet by Christophe Lalanne.

July 28, 2014

Visualizing High-Dimensional Data…

Filed under: Dimension Reduction,Dimensions,High Dimensionality — Patrick Durusau @ 6:39 pm

Visualizing High-Dimensional Data in the Browser with SVD, t-SNE and Three.js by Nicolas Kruchten.

From the post:

Data visualization, by definition, involves making a two- or three-dimensional picture of data, so when the data being visualized inherently has many more dimensions than two or three, a big component of data visualization is dimensionality reduction. Dimensionality reduction is also often the first step in a big-data machine-learning pipeline, because most machine-learning algorithms suffer from the Curse of Dimensionality: more dimensions in the input means you need exponentially more training data to create a good model. Datacratic’s products operate on billions of data points (big data) in tens of thousands of dimensions (big problem), and in this post, we show off a proof of concept for interactively visualizing this kind of data in a browser, in 3D (of course, the images on the screen are two-dimensional but we use interactivity, motion and perspective to evoke a third dimension).

Both the post and the demo are very impressive!

For a compelling review, see Dimension Reduction: A Guided Tour by Christopher J.C. Burges.

Christopher captures my concern with dimensional reduction in the first sentence of the introduction:

Dimension reduction1 is the mapping of data to a lower dimensional space such that uninformative variance in the data is discarded, or such that a subspace in which the data lives is detected.

I understand the need for dimensional reduction and that it can produce useful results. But what is being missed in the “…uniformative variance in the data…” is unknown.

Not an argument against dimensional reduction but a caution to avoid quickly dismissing variation in data as “uninformative.”

September 15, 2012

Factor Analysis: A Short Introduction, Part 1 [Reducing Dimensionality]

Filed under: Dimension Reduction,Factor Analysis — Patrick Durusau @ 2:01 pm

Factor Analysis: A Short Introduction, Part 1 by Maike Rahn.

From the post:

Why use factor analysis?

Factor analysis is a useful tool for investigating variable relationships for complex concepts such as socioeconomic status, dietary patterns, or psychological scales.

It allows researchers to investigate concepts that are not easily measured directly by collapsing a large number of variables into a few interpretable underlying factors.

What is a factor?

The key concept of factor analysis is that multiple observed variables have similar patterns of responses because of their association with an underlying latent variable, the factor, which cannot easily be measured.

For example, people may respond similarly to questions about income, education, and occupation, which are all associated with the latent variable socioeconomic status.

I mention factor analysis as an example of

  • reducing dimensionality
  • exchanging a not easily measured latent variable for measurable ones
  • attributing a relationship between a not easily measured latent variable and measurable ones

Factor analysis has been successfully used in a number of fields.

However, to reliably integrate information based on factor analysis you will need to probe the (often) unstated assumptions of such analysis.

PS: You may find the pointers in Wikipedia useful: Factor Analysis.

September 5, 2012

Naming and the Curse of Dimensionality

Filed under: Dimension Reduction,Names — Patrick Durusau @ 3:23 pm

Wikipedia introduces its article on the Curse of Dimensionality with:

In numerical analysis the curse of dimensionality refers to various phenomena that arise when analyzing and organizing high-dimensional spaces (often with hundreds or thousands of dimensions) that do not occur in low-dimensional settings such as the physical space commonly modeled with just three dimensions.

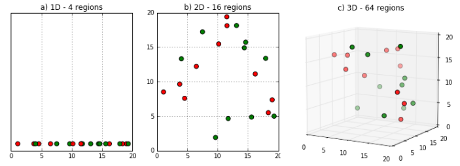
There are multiple phenomena referred to by this name in domains such as sampling, combinatorics, machine learning and data mining. The common theme of these problems is that when the dimensionality increases, the volume of the space increases so fast that the available data becomes sparse. This sparsity is problematic for any method that requires statistical significance. In order to obtain a statistically sound and reliable result, the amount of data needed to support the result often grows exponentially with the dimensionality. Also organizing and searching data often relies on detecting areas where objects form groups with similar properties; in high dimensional data however all objects appear to be sparse and dissimilar in many ways which prevents common data organization strategies from being efficient.

The term curse of dimensionality was coined by Richard E. Bellman when considering problems in dynamic optimization.[1][2]

The “curse of dimensionality” is often used as a blanket excuse for not dealing with high-dimensional data. However, the effects are not yet completely understood by the scientific community, and there is ongoing research. On one hand, the notion of intrinsic dimension refers to the fact that any low-dimensional data space can trivially be turned into a higher dimensional space by adding redundant (e.g. duplicate) or randomized dimensions, and in turn many high-dimensional data sets can be reduced to lower dimensional data without significant information loss. This is also reflected by the effectiveness of dimension reduction methods such as principal component analysis in many situations. For distance functions and nearest neighbor search, recent research also showed that data sets that exhibit the curse of dimensionality properties can still be processed unless there are too many irrelevant dimensions, while relevant dimensions can make some problems such as cluster analysis actually easier.[3][4] Secondly, methods such as Markov chain Monte Carlo or shared nearest neighbor methods[3] often work very well on data that were considered intractable by other methods due to high dimensionality.

But dimensionality isn’t limited to numerical analysis. Nor is its reduction.

Think about the number of dimensions along which you have information about your significant other, friends or co-authors. Or any other subject, abstract or concrete, that you care to name.

However many dimensions you can name for any given subject, in human discourse we don’t refer to that dimensionality as the “curse of dimensionality.”

In fact, we don’t notice the dimensionality at all. Why?

We reduce all those dimensions into a name for the subject and that name is what we use in human discourse.

Dimensional reduction to names goes a long way to explaining why we get confused by names.

Another speaker has reduced a different set of dimensions (which are not shown as it were) to the same name that we use as the reduction of a different set of dimensions.

Sometimes the same name will expand into a different set of dimensions and sometimes different names expand into the same set of dimensions.

One of those dimensions being the context of usage, which when our expansion of the name doesn’t fit, prompts us to ask the speaker for one or more additional dimensions to identify the subject of discussion.

We do that effortlessly, reducing and expanding dimensions to and from names in the course of a conversation. Or when reading or writing.

The number of dimensions for any name increases as we know more about any given subject. Not to mention being impacted by our interaction with others who use the same name as we adjust, repair or change the dimensions we expand or reduce for any particular name.

Dimensionality isn’t a curse. The difficulties we associate with dimensionality and numeric analysis are a consequence of using an underpowered tool, that’s all.

June 28, 2012

Clustering high dimensional data

Filed under: Clustering,Dimension Reduction,Dimensions,High Dimensionality — Patrick Durusau @ 6:32 pm

Clustering high dimensional data by Ira Assent. (Assent, I. (2012), Clustering high dimensional data. WIREs Data Mining Knowl Discov, 2: 340–350. doi: 10.1002/widm.1062)

Abstract:

High-dimensional data, i.e., data described by a large number of attributes, pose specific challenges to clustering. The so-called ‘curse of dimensionality’, coined originally to describe the general increase in complexity of various computational problems as dimensionality increases, is known to render traditional clustering algorithms ineffective. The curse of dimensionality, among other effects, means that with increasing number of dimensions, a loss of meaningful differentiation between similar and dissimilar objects is observed. As high-dimensional objects appear almost alike, new approaches for clustering are required. Consequently, recent research has focused on developing techniques and clustering algorithms specifically for high-dimensional data. Still, open research issues remain. Clustering is a data mining task devoted to the automatic grouping of data based on mutual similarity. Each cluster groups objects that are similar to one another, whereas dissimilar objects are assigned to different clusters, possibly separating out noise. In this manner, clusters describe the data structure in an unsupervised manner, i.e., without the need for class labels. A number of clustering paradigms exist that provide different cluster models and different algorithmic approaches for cluster detection. Common to all approaches is the fact that they require some underlying assessment of similarity between data objects. In this article, we provide an overview of the effects of high-dimensional spaces, and their implications for different clustering paradigms. We review models and algorithms that address clustering in high dimensions, with pointers to the literature, and sketch open research issues. We conclude with a summary of the state of the art.

The author has a clever example (figure 4) of why adding dimensions can decrease the discernment of distinct groups in data. A problem that worsens as the number of dimensions increases.

Or does it? Or is it the case that by weighting all dimensions equally we get the result we deserve?

My counter-example would be introducing you to twin sisters. As the number of dimensions increased, so would the similarity that would befoul any clustering algorithm.

But the important dimension, their names, is sufficient to cluster attributes around the appropriate data points.

Is the “curse of dimensionality” rather a “failure to choose dimensions wisely?”

December 28, 2011

Visualizing 4+ Dimensions

Filed under: Dimension Reduction,Dimensions,Mathematics — Patrick Durusau @ 9:36 pm

Visualizing 4+ Dimensions

From the post:

When people realize that I study pure math, they often ask about how to visualize four or more dimensions. I guess it’s a natural question to ask, since mathematicians often have to deal with very high (and sometimes infinite) dimensional objects. Yet people in pure math never really have this problem.

Pure mathematicians might like you to think that they’re just that much smarter. But frankly, I’ve never had to visualize anything high-dimensional in my pure math classes. Working things out algebraically is much nicer, and using a lower-dimensional object as an example or source of intuition usually works out — at least at the undergrad level.

But that’s not a really satisfying answer, for two reasons. One is that it is possible to visualize high-dimensional objects, and people have developed many ways of doing so. Dimension Math has on its website a neat series of videos for visualizing high-dimensional geometric objects using stereographic projection. The other reason is that while pure mathematicians do not have a need for visualizing high-dimensions, statisticians do. Methods of visualizing high dimensional data can give useful insights when analyzing data.

This is an important area for study, but not only because identifications can consist of values in multiple dimensions.

It is important because the recognition of an identifier can also consist of values spread across multiple dimensions.

More on that second statement before year’s end (so you don’t have to wait very long, just until holiday company leaves).

I first saw this in Christophe Lalanne’s A bag of tweets / Dec 2011.

September 13, 2011

COMTOP: Applied and Computational Algebraic Topology

Filed under: Dimension Reduction,High Dimensionality,Topology — Patrick Durusau @ 7:15 pm

COMTOP: Applied and Computational Algebraic Topology

From the website:

The overall goal of this project is to develop flexible topological methods which will allow the analysis of data which is difficult to analyze using classical linear methods. Data obtained by sampling from highly curved manifolds or singular algebraic varieties in Euclidean space are typical examples where our methods will be useful. We intend to develop and refine two pieces of software which have been written by members of our research group, ISOMAP (Tenenbaum) and PLEX (de Silva-Carlsson). ISOMAP is a tool for dimension reduction and parameterization of high dimensional data sets, and PLEX is a homology computing tool which we will use in locating and analyzing singular points in data sets, as well as estimating dimension in situations where standard methods do not work well. We plan to extend the range of applicability of both tools, in the case of ISOMAP by studying embeddings into spaces with non-Euclidean metrics, and in the case of PLEX by building in the Mayer-Vietoris spectral sequence as a tool. Both ISOMAP and PLEX will be adapted for parallel computing. We will also begin the theoretical study of statistical questions relating to topology. For instance, we will initiate the study of higher dimensional homology of subsets sampled from Euclidean space under various sampling hypotheses. The key object of study will be the family of Cech complexes constructed using the distance function in Euclidean space together with a randomly chosen finite set of points in Euclidean space.

The goal of this project is to develop tools for understanding data sets which are not easy to understand using standard methods. This kind of data might include singular points, or might be strongly curved. The data is also high dimensional, in the sense that each data point has many coordinates. For instance, we might have a data set whose points each of which is an image, which has one coordinate for each pixel. Many standard tools rely on linear approximations, which do not work well in strongly curved or singular problems. The kind of tools we have in mind are in part topological, in the sense that they measure more qualitative properties of the spaces involved, such as connectedness, or the number of holes in a space, and so on. This group of methods has the capability of recognizing the number of parameters required to describe a space, without actually parameterizing it. These methods also have the capability of recognizing singular points (like points where two non-parallel planes or non-parallel lines intersect), without actually having to construct coordinates on the space. We will also be further developing and refining methods we have already constructed which can actually find good parameterizations for many high dimensional data sets. Both projects will involve the adaptation for the computer of many methods which have heretofore been used in by-hand calculations for solving theoretical problems. We will also initiate the theoretical development of topological tools in a setting which includes errors and sampling.

Are you still using “classical linear methods” to analyze your data sets?

Could be the right choice but it may be your only choice if you never consider the alternatives.

June 23, 2011

Advanced Topics in Machine Learning

Advanced Topics in Machine Learning

Andreas Krause and Daniel Golovin course at CalTech. Lecture notes, readings, this will keep you entertained for some time.

Overview:

How can we gain insights from massive data sets?

Many scientific and commercial applications require us to obtain insights from massive, high-dimensional data sets. In particular, in this course we will study:

  • Online learning: How can we learn when we cannot fit the training data into memory? We will cover no regret online algorithms; bandit algorithms; sketching and dimension reduction.
  • Active learning: How should we choose few expensive labels to best utilize massive unlabeled data? We will cover active learning algorithms, learning theory and label complexity.
  • Nonparametric learning on large data: How can we let complexity of classifiers grow in a principled manner with data set size? We will cover large-­scale kernel methods; Gaussian process regression, classification, optimization and active set methods.

Why would a non-strong AI person list so much machine learning stuff?

Two reasons:

1) Machine learning techniques are incredibly useful in appropriate cases.

2) You have to understand machine learning to pick out the appropriate cases.

January 25, 2011

NAQ Tree in Your Forest?

Effectiveness of NAQ-tree as index structure for similarity search in high-dimensional metric space Authors: Ming Zhang and Reda Alhajj Keywords: Knn search, High dimensionality, Dimensionality reduction, Indexing, Similarity search

Abstract:

Similarity search (e.g., k-nearest neighbor search) in high-dimensional metric space is the key operation in many applications, such as multimedia databases, image retrieval and object recognition, among others. The high dimensionality and the huge size of the data set require an index structure to facilitate the search. State-of-the-art index structures are built by partitioning the data set based on distances to certain reference point(s). Using the index, search is confined to a small number of partitions. However, these methods either ignore the property of the data distribution (e.g., VP-tree and its variants) or produce non-disjoint partitions (e.g., M-tree and its variants, DBM-tree); these greatly affect the search efficiency. In this paper, we study the effectiveness of a new index structure, called Nested-Approximate-eQuivalence-class tree (NAQ-tree), which overcomes the above disadvantages. NAQ-tree is constructed by recursively dividing the data set into nested approximate equivalence classes. The conducted analysis and the reported comparative test results demonstrate the effectiveness of NAQ-tree in significantly improving the search efficiency.

Although I think the following paragraph from the paper is more interesting:

Consider a set of objects O = {o1 , o2 , . . . , on } and a set of attributes A = {a1 , a2 , . . . , ad }, we first divide the objects into groups based on the first attribute a1 , i.e., objects with same value of a1 are put in the same group; each group is an equivalence class [23] with respect to a1 . In other words, all objects in a group are indistinguishable by attribute a1 . We can refine the equivalence classes further by dividing each existing equivalence class into groups based on the second attribute a2 ; all objects in a refined equivalence class are indistinguishable by attributes a1 and a2 . This process may be repeated by adding one more attribute at a time until all the attributes are considered. Finally, we get a hierarchical set of equivalence classes, i.e., a hierarchical partitioning of the objects. This is roughly the basic idea of NAQ-tree, i.e., to partition the data space in our similarity search method. In other words, given a query object o, we can gradually reduce the search space by gradually considering the most relevant attributes.

With the caveat that this technique is focused on metric spaces.

But I rather like the idea of reducing the search space by the attributes under consideration. Replace search space with similarity/sameness space and you will see what I mean. Still relevant for searching as well.

October 27, 2010

Semi-Supervised Graph Embedding Scheme with Active Learning (SSGEAL): Classifying High Dimensional Biomedical Data

Filed under: Bioinformatics,Biomedical,Dimension Reduction — Patrick Durusau @ 4:15 pm

Semi-Supervised Graph Embedding Scheme with Active Learning (SSGEAL): Classifying High Dimensional Biomedical Data Authors: George Lee, Anant Madabhushi

Abstract:

In this paper, we present a new dimensionality reduction (DR) method (SSGEAL) which integrates Graph Embedding (GE) with semi-supervised and active learning to provide a low dimensional data representation that allows for better class separation. Unsupervised DR methods such as Principal Component Analysis and GE have previously been applied to the classification of high dimensional biomedical datasets (e.g. DNA microarrays and digitized histopathology) in the reduced dimensional space. However, these methods do not incorporate class label information, often leading to embeddings with significant overlap between the data classes. Semi-supervised dimensionality reduction (SSDR) methods have recently been proposed which utilize both labeled and unlabeled instances for learning the optimal low dimensional embedding. However, in several problems involving biomedical data, obtaining class labels may be difficult and/or expensive. SSGEAL utilizes labels from instances, identified as “hard to classify” by a support vector machine based active learning algorithm, to drive an updated SSDR scheme while reducing labeling cost. Real world biomedical data from 7 gene expression studies and 3900 digitized images of prostate cancer needle biopsies were used to show the superior performance of SSGEAL compared to both GE and SSAGE (a recently popular SSDR method) in terms of both the Silhouette Index (SI) (SI = 0.35 for GE, SI = 0.31 for SSAGE, and SI = 0.50 for SSGEAL) and the Area Under the Receiver Operating Characteristic Curve (AUC) for a Random Forest classifier (AUC = 0.85 for GE, AUC = 0.93 for SSAGE, AUC = 0.94 for SSGEAL).

Questions:

  1. Literature on information loss from dimension reduction?
  2. Active Learning assisting with topic maps authoring. Yes/no/maybe?
  3. Update the bibliography of one of the papers cited in this paper.

October 10, 2010

Distributed Knowledge Discovery with Non Linear Dimensionality Reduction

Filed under: Data Mining,Dimension Reduction,Heterogeneous Data,High Dimensionality — Patrick Durusau @ 9:43 am

Distributed Knowledge Discovery with Non Linear Dimensionality Reduction Authors: Panagis Magdalinos, Michalis Vazirgiannis, Dialecti Valsamou Keywords: distributed non linear dimensionality reduction, NLDR, distributed dimensionality reduction, DDR, distributed data mining, DDM, dimensionality reduction, DR, Distributed Isomap, D-Isomap, C-Isomap, L-Isomap

Abstract:

Data mining tasks results are usually improved by reducing the dimensionality of data. This improvement however is achieved harder in the case that data lay on a non linear manifold and are distributed across network nodes. Although numerous algorithms for distributed dimensionality reduction have been proposed, all assume that data reside in a linear space. In order to address the non-linear case, we introduce D-Isomap, a novel distributed non linear dimensionality reduction algorithm, particularly applicable in large scale, structured peer-to-peer networks. Apart from unfolding a non linear manifold, our algorithm is capable of approximate reconstruction of the global dataset at peer level a very attractive feature for distributed data mining problems. We extensively evaluate its performance through experiments on both artificial and real world datasets. The obtained results show the suitability and viability of our approach for knowledge discovery in distributed environments.

Data mining in peer-to-peer networks will face topic map authors sooner or later.

Not only a useful discussion of the issues, but, the authors have posted source code and data sets used in the article as well:

http://www.db-net.aueb.gr/panagis/PAKDD2010/

Powered by WordPress