Another Word For It Patrick Durusau on Topic Maps and Semantic Diversity

October 30, 2015

Time Curves

Filed under: Temporal Data,Temporal Semantic Analysis,Time,Time Series,Visualization — Patrick Durusau @ 4:33 pm

Time Curves by Benjamin Bach, Conglei Shi, Nicolas Heulot, Tara Madhyastha, Tom Grabowski, Pierre Dragicevic.

From What are time curves?:

Time curves are a general approach to visualize patterns of evolution in temporal data, such as:

  • Progression and stagantion,
  • sudden changes,
  • regularity and irregularity,
  • reversals to previous states,
  • temporal states and transitions,
  • reversals to previous states,
  • etc..

Time curves are based on the metaphor of folding a timeline visualization into itself so as to bring similar time points close to each other. This metaphor can be applied to any dataset where a similarity metric between temporal snapshots can be defined, thus it is largely datatype-agnostic. We illustrate how time curves can visually reveal informative patterns in a range of different datasets.

A website to accompany:

Time Curves: Folding Time to Visualize Patterns of Temporal Evolution in Data

Abstract:

We introduce time curves as a general approach for visualizing patterns of evolution in temporal data. Examples of such patterns include slow and regular progressions, large sudden changes, and reversals to previous states. These patterns can be of interest in a range of domains, such as collaborative document editing, dynamic network analysis, and video analysis. Time curves employ the metaphor of folding a timeline visualization into itself so as to bring similar time points close to each other. This metaphor can be applied to any dataset where a similarity metric between temporal snapshots can be defined, thus it is largely datatype-agnostic. We illustrate how time curves can visually reveal informative patterns in a range of different datasets.

From the introduction:


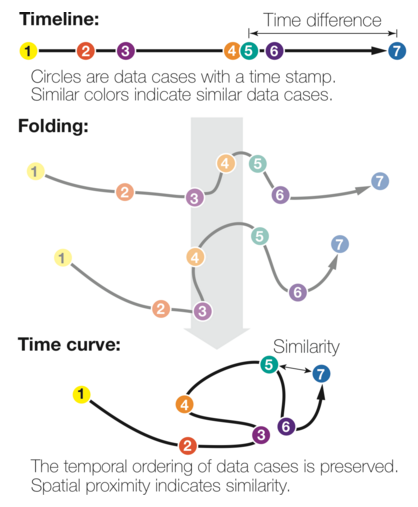
The time curve technique is a generic approach for visualizing temporal data based on self-similarity. It only assumes that the underlying information artefact can be broken down into discrete time points, and that the similarity between any two time points can be quantified through a meaningful metric. For example, a Wikipedia article can be broken down into revisions, and the edit distance can be used to quantify the similarity between any two revisions. A time curve can be seen as a timeline that has been folded into itself to reflect self-similarity (see Figure 1(a)). On the initial timeline, each dot is a time point, and position encodes time. The timeline is then stretched and folded into itself so that similar time points are brought close to each other (bottom). Quantitative temporal information is discarded as spacing now reflects similarity, but the temporal ordering is preserved.

Figure 1(a) also appears on the webpage as:

benjamin-bach01

Obviously a great visualization tool for temporal data but the treatment of self-similarity is greatly encouraging:

that the similarity between any two time points can be quantified through a meaningful metric.

Time curves don’t dictate to users what “meaningful metric” to use for similarity.

BTW, as a bonus, you can upload your data (JSON format) to generate time curves from your own data.

Users/analysts of temporal data need to take a long look at time curves. A very long look.

I first saw this in a tweet by Moritz Stefaner.
June 7, 2015

Signatures, patterns and trends: Timeseries data mining at Etsy

Filed under: Cybersecurity,Pattern Recognition,Streams,Time Series — Patrick Durusau @ 8:56 pm

From the description:

Etsy loves metrics. Everything that happens in our data centres gets recorded, graphed and stored. But with over a million metrics flowing in constantly, it’s hard for any team to keep on top of all that information. Graphing everything doesn’t scale, and traditional alerting methods based on thresholds become very prone to false positives.

That’s why we started Kale, an open-source software suite for pattern mining and anomaly detection in operational data streams. These are big topics with decades of research, but many of the methods in the literature are ineffective on terabytes of noisy data with unusual statistical characteristics, and techniques that require extensive manual analysis are unsuitable when your ops teams have service levels to maintain.

In this talk I’ll briefly cover the main challenges that traditional statistical methods face in this environment, and introduce some pragmatic alternatives that scale well and are easy to implement (and automate) on Elasticsearch and similar platforms. I’ll talk about the stumbling blocks we encountered with the first release of Kale, and the resulting architectural changes coming in version 2.0. And I’ll go into a little technical detail on the algorithms we use for fingerprinting and searching metrics, and detecting different kinds of unusual activity. These techniques have potential applications in clustering, outlier detection, similarity search and supervised learning, and they are not limited to the data centre but can be applied to any high-volume timeseries data.

Blog post: https://codeascraft.com/2013/06/11/introducing-kale/

Signature, patterns and trends? Sounds relevant to monitoring network patterns. Yes?

Good focus on anomaly detection, pointing out that many explanations are overly simplistic.

Use case is one (1) million incoming metrics.

Looking forward to seeing this released as open source!

March 29, 2015

OpenTSDB 2.0.1

Filed under: Database,OpenTSDB,Time,Time Series — Patrick Durusau @ 6:52 pm

OpenTSDB 2.0.1

From the homepage:

Store

  • Data is stored exactly as you give it
  • Write with millisecond precision
  • Keep raw data forever

Scale

  • Runs on Hadoop and HBase
  • Scales to millions of writes per second
  • Add capacity by adding nodes

Read

  • Generate graphs from the GUI
  • Pull from the HTTP API
  • Choose an open source front-end

If that isn’t impressive enough, check out the features added for the 2.0 release:

OpenTSDB has a thriving community who contributed and requested a number of new features. 2.0 has the following new features:

  • Lock-less UID Assignment – Drastically improves write speed when storing new metrics, tag names, or values
  • Restful API – Provides access to all of OpenTSDB’s features as well as offering new options, defaulting to JSON
  • Cross Origin Resource Sharing – For the API so you can make AJAX calls easily
  • Store Data Via HTTP – Write data points over HTTP as an alternative to Telnet
  • Configuration File – A key/value file shared by the TSD and command line tools
  • Pluggable Serializers – Enable different inputs and outputs for the API
  • Annotations – Record meta data about specific time series or data points
  • Meta Data – Record meta data for each time series, metrics, tag names, or values
  • Trees – Flatten metric and tag combinations into a single name for navigation or usage with different tools
  • Search Plugins – Send meta data to search engines to delve into your data and figure out what’s in your database
  • Real-Time Publishing Plugin – Send data to external systems as they arrive to your TSD
  • Ingest Plugins – Accept data points in different formats
  • Millisecond Resolution – Optionally store data with millisecond precision
  • Variable Length Encoding – Use less storage space for smaller integer values
  • Non-Interpolating Aggregation Functions – For situations where you require raw data
  • Rate Counter Calculations – Handle roll-over and anomaly supression
  • Additional Statistics – Including the number of UIDs assigned and available

I suppose traffic patterns (license plates) are a form of time series data. Yes?

March 3, 2015

KillrWeather

Filed under: Akka,Cassandra,Spark,Time Series — Patrick Durusau @ 2:31 pm

KillrWeather

From the post:

KillrWeather is a reference application (which we are constantly improving) showing how to easily leverage and integrate Apache Spark, Apache Cassandra, and Apache Kafka for fast, streaming computations in asynchronous Akka event-driven environments. This application focuses on the use case of time series data.

The site doesn’t give enough emphasis to the importance of time series data. Yes, weather is an easy example of time series data, but consider another incomplete listing of the uses of time series data:

A time series is a sequence of data points, typically consisting of successive measurements made over a time interval. Examples of time series are ocean tides, counts of sunspots, and the daily closing value of the Dow Jones Industrial Average. Time series are very frequently plotted via line charts. Time series are used in statistics, signal processing, pattern recognition, econometrics, mathematical finance, weather forecasting, earthquake prediction, electroencephalography, control engineering, astronomy, communications engineering, and largely in any domain of applied science and engineering which involves temporal measurements.

(Time Series)

Mastering KillrWeather will put you on the road to many other uses of time series data.

Enjoy!

I first saw this in a tweet by Chandra Gundlapalli.

July 8, 2014

Advanced Time-Series Pipelines

Filed under: Apache Crunch,Time Series — Patrick Durusau @ 6:52 pm

How-to: Build Advanced Time-Series Pipelines in Apache Crunch by Mirko Kämpf.

From the post:

Learn how creating dataflow pipelines for time-series analysis is a lot easier with Apache Crunch.

In a previous blog post, I described a data-driven market study based on Wikipedia access data and content. I explained how useful it is to combine several public data sources, and how this approach sheds light onto the hidden correlations across Wikipedia pages.

One major task in the above was to apply structural analysis to networks reconstructed by time-series analysis techniques. In this post, I will describe a different method: the use of Apache Crunch time-series processing pipelines for large-scale correlation and dependency analysis. The results of these operations will be a matrix or network representation of the underlying data set, which can be further processed in an Apache Hadoop (CDH) cluster via GraphLab, GraphX, or even Apache Giraph.

This article assumes that you know a bit about Crunch. If not, read the Crunch user guide first. Furthermore, this short how-to explains how to extract and re-organize data that is already stored in Apache Avro files, using a Crunch pipeline. All source code for the article is available in the crunch.TS project.

Initial Situation and Goal

In our example dataset, for each measurement period, one SequenceFile was generated. Such a file is called a \u201ctime-series bucket\u201d and contains a key-value pair of types: Text (from Hadoop) and VectorWritable (from Apache Mahout). We use data types of projects, which do not guarantee stability over time, and we are dependent on Java as a programming language because others cannot read SequenceFiles.

The dependency on external libraries, such as the VectorWritable class from Mahout, should be removed from our data representation and storage layer, so it is a good idea to store the data in an Avro file. Such files can also be organized in a directory hierarchy that fits to the concept of Apache Hive partitions. Data processing will be done in Crunch, but for fast delivery of pre-calculated results, Impala will be used.

A more general approach will be possible later on if we use Kite SDK and Apache HCatalog, as well. In order to achieve interoperability between multiple analysis tools or frameworks — and I think this is a crucial aspect in data management, even in the case of an enterprise data hub — you have to think about access patterns early.

Worth your attention as an incentive to learn more about Apache Crunch. Aside from the benefit of learning more about processing time-series data.

December 26, 2013

Topotime gallery & sandbox

Filed under: D3,Graphics,JSON,Time,Time Series,Timelines,Visualization — Patrick Durusau @ 8:31 pm

Topotime gallery & sandbox

From the website:

A pragmatic JSON data format, D3 timeline layout, and functions for representing and computing over complex temporal phenomena. It is under active development by its instigators, Elijah Meeks (emeeks) and Karl Grossner (kgeographer), who welcome forks, comments, suggestions, and reasonably polite brickbats.

Topotime currently permits the representation of:

  • Singular, multipart, cyclical, and duration-defined timespans in periods (tSpan in Period). A Period can be any discrete temporal thing, e.g. an historical period, an event, or a lifespan (of a person, group, country).
  • The tSpan elements start (s), latest start (ls), earliest end (ee), end (e) can be ISO-8601 (YYYY-MM-DD, YYYY-MM or YYYY), or pointers to other tSpans or their individual elements. For example, >23.s stands for ‘after the start of Period 23 in this collection.’
    • Uncertain temporal extents; operators for tSpan elements include: before (<), after (>), about (~), and equals (=).
  • Further articulated start and end ranges in sls and eee elements, respectively.
  • An estimated timespan when no tSpan is defined
  • Relations between events. So far, part-of, and participates-in. Further relations including has-location are in development.

Topotime currently permits the computation of:

  • Intersections (overlap) between between a query timespan and a collection of Periods, answering questions like “what periods overlapped with the timespan [-433, -344] (Plato’s lifespan possibilities)?” with an ordered list.

To learn more, check out these and other pages in the Wiki and the Topotime web page

I am currently reading the A Song of Fire and Ice (first volume, A Game of Thrones) and the uncertain temporal extents of Topotime may be useful for modeling some aspects of the narrative.

What will be more difficult to model will be facts known to some parties but not to others, at any point in the narrative.

Unlike graph models where every vertex is connected to every other vertex.

As I type that, I wonder if the edge connecting a vertex (representing a person) to some fact or event (another vertex), could have a property that represents the time in the novel’s narrative when the person in question knows a fact or event?

I need to plot out knowledge of a lineage. If you know the novel you can guess which one. 😉

December 5, 2013

InfluxDB

Filed under: InfluxDB,NoSQL,Time,Time Series — Patrick Durusau @ 7:19 pm

InfluxDB

From the webpage:

An open-source, distributed, time series, events, and metrics database with no external dependencies.

Time Series

Everything in InfluxDB is a time series that you can perform standard functions on like min, max, sum, count, mean, median, percentiles, and more.

Metrics

Scalable metrics that you can collect on any interval, computing rollups on the fly later. Track 100 metrics or 1 million, InfluxDB scales horizontally.

Events

InfluxDB’s data model supports arbitrary event data. Just write in a hash of associated data and count events, uniques, or grouped columns on the fly later.

The overview page gives some greater detail:

When we built Errplane, we wanted the data model to be flexible enough to store events like exceptions along with more traditional metrics like response times and server stats. At the same time we noticed that other companies were also building custom time series APIs on top of a database for analytics and metrics. Depending on the requirements these APIs would be built on top of a regular SQL database, Redis, HBase, or Cassandra.

We thought the community might benefit from the work we’d already done with our scalable backend. We wanted something that had the HTTP API built in that would scale out to billions of metrics or events. We also wanted sometehing that would make it simple to query for downsampled data, percentiles, and other aggregates at scale. Our hope is that once there’s a standard API, the community will be able to build useful tooling around it for data collection, visualization, and analysis.

While phrased as tracking server stats and events, I suspect InfluxDB would be just as happy tracking other types of stats or events.

I don’t know, say like the “I’m alive” messages your cellphone sends to the local towers for instance.

I first saw this in Nat Torkington’s Four short links: 5 November 2013.

November 7, 2013

Enhancing Time Series Data by Applying Bitemporality

Filed under: Data,Time,Time Series,Timelines,Topic Maps — Patrick Durusau @ 5:30 pm

Enhancing Time Series Data by Applying Bitemporality (It’s not just what you know, it’s when you know it) by Jeffrey Shmain.

A “white paper” and all that implies but it raises the interesting question of setting time boundaries for the validity of data.

From the context of the paper, “bitemporality” means setting a start and end time for the validity of some unit of data.

We all know the static view of the world presented by most data systems is false. But it works well enough in some cases.

The problem is that most data systems don’t allow you to choose static versus some other view of the world.

In part because to get a non-static view, you have to modify your data system (often not a good idea) or migrate to another data system (which is expensive and not risk free) to obtain a non-static view of the world.

Jeffrey remarks in the paper that “all data is time series data” and he’s right. Data arrives at time X, was sent at time T, was logged at time Y, was seen by the CIO at Z, etc. To say nothing of tracking changes to that data.

Not all cases require that much detail but if you need it, wouldn’t it be nice to have?

Your present system may limit you to static views but topic maps can enhance your system in place. Avoiding the dangers of upgrading in place and/or migrating into unknown perils and hazards.

When did you know you needed time based validity for your data?

For a bit more technical view of bitemporality. (authored by Robbert van Dalen)

April 6, 2013

KairosDB

Filed under: KairosDB,Time,Time Series — Patrick Durusau @ 5:05 pm

KairosDB

From the webpage:

KairosDB is a fast distributed scalable time series database written primarily for Cassandra but works with HBase as well.

It is a rewrite of the original OpenTSDB project started at Stumble Upon. Many thanks go out to the original authors for laying the groundwork and direction for this great product. See a list of changes here.

Because it is written on top of Cassandra (or HBase) it is very fast and scalable. With a single node we are able to capture 40,000 points of data per second.

Why do you need a time series database? The quick answer is so you can be data driven in your IT decisions. With KairosDB you can use it to track the number of hits on your web server and compare that with the load average on your MySQL database.

Getting Started

Metrics

KairosDB stores metrics. Each metric consists of a name, data points (measurements), and tags. Tags are used to classify the metric.

Metrics can be submitted to KairosDB via telnet protocol or a REST API.

Metrics can be queried using a REST API. Aggregators can be used to manipulate the data as it is returned. This allows downsampling, summing, averaging, etc.

Do be aware that values must be either longs or doubles.

If your data can be mapped into metric space, KairosDB may be quite useful.

The intersection of time series data with non-metric data or events awaits a different solution.

I first saw this at Alex Popescu’s Kairosdb – Fast Scalable Time Series Database.

December 25, 2012

Quandl [> 2 million financial/economic datasets]

Filed under: Data,Dataset,Time Series — Patrick Durusau @ 4:19 pm

Quandl (alpha)

From the homepage:

Quandl is a collaboratively curated portal to over 2 million financial and economic time-series datasets from over 250 sources. Our long-term mission is to make all numerical data on the internet easy to find and easy to use.

Interesting enough but the detail from the “about” page are even more so:

Our Vision

The internet offers a rich collection of high quality numerical data on thousands of subjects. But the potential of this data is not being reached at all because the data is very difficult to actually find. Furthermore, it is also difficult to extract, validate, format, merge, and share.

We have a solution: We’re building an intelligent search engine for numerical data. We’ve developed technology that lets people quickly and easily add data to Quandl’s index. Once this happens, the data instantly becomes easy to find and easy to use because it gains 8 essential attributes:

Findability Quandl is essentially a search engine for numerical data. Every search result on Quandl is an actual data set that you can use right now. Once data from anywhere on the internet becomes known to Quandl, it becomes findable by search and (soon) by browse.
Structure Quandl is a universal translator for data formats. It accepts numerical data no matter what format it happens to be published in and then delivers it in any format you request it. When you find a dataset on Quandl, you’ll be able to export anywhere you want, in any format you want.
Validity Every dataset on Quandl has a simple link back to the same data on the publisher’s web site which gives you 100% certainty on validity.
Fusibility Any data set on Quandl is totally compatible with any and all other data on Quandl. You can merge multiple datasets on Quandl quickly and easily (coming soon).
Permanence Once a dataset is on Quandl, it stays there forever. It is always up-to-date and available at a permanent, unchanging URL.
Connectivity Every dataset on Quandl is accessible by a simple API. Whether or not the original publisher offered an API no longer matters because Quandl always does. Quandl is the universal API for numerical data on the internet.
Recency Every single dataset on Quandl is guaranteed to be the most recent version of that data, retrieved afresh directly from the original publisher.
Utility Data on Quandl is organized and presented for maximum utility: Actual data is examinable immediately; the data is graphed (properly); description, attribution, units, and export tools are clear and concise.

I have my doubts about the “fusibility” claims. You can check the US Leading Indicators data list and note that “level” and “units” use different units of measurement. Other semantic issues lurk just beneath the surface.

Still, the name of the engine does not begin with “B” or “G” and illustrates there is enormous potential for curated data collections.

Come to think of it, topic maps are curated data collections.

Are you in need of a data curator?

I first saw this in a tweet by Gregory Piatetsky.

November 2, 2012

Predicting what topics will trend on Twitter [Predicting Merging?]

Filed under: Merging,Prediction,Time Series,Tweets — Patrick Durusau @ 1:40 pm

Predicting what topics will trend on Twitter

From the post:

Twitter’s home page features a regularly updated list of topics that are “trending,” meaning that tweets about them have suddenly exploded in volume. A position on the list is highly coveted as a source of free publicity, but the selection of topics is automatic, based on a proprietary algorithm that factors in both the number of tweets and recent increases in that number.

At the Interdisciplinary Workshop on Information and Decision in Social Networks at MIT in November, Associate Professor Devavrat Shah and his student, Stanislav Nikolov, will present a new algorithm that can, with 95 percent accuracy, predict which topics will trend an average of an hour and a half before Twitter’s algorithm puts them on the list — and sometimes as much as four or five hours before.

If you can’t attend the Interdisciplinary Workshop on Information and Decision in Social Networks workshop, which has an exciting final program, try Stanislav Nikolov thesis, Trend or No Trend: A Novel Nonparametric Method for Classifying Time Series.

Abstract:

In supervised classification, one attempts to learn a model of how objects map to labels by selecting the best model from some model space. The choice of model space encodes assumptions about the problem. We propose a setting for model specification and selection in supervised learning based on a latent source model. In this setting, we specify the model by a small collection of unknown latent sources and posit that there is a stochastic model relating latent sources and observations. With this setting in mind, we propose a nonparametric classification method that is entirely unaware of the structure of these latent sources. Instead, our method relies on the data as a proxy for the unknown latent sources. We perform classification by computing the conditional class probabilities for an observation based on our stochastic model. This approach has an appealing and natural interpretation — that an observation belongs to a certain class if it sufficiently resembles other examples of that class.

We extend this approach to the problem of online time series classification. In the binary case, we derive an estimator for online signal detection and an associated implementation that is simple, efficient, and scalable. We demonstrate the merit of our approach by applying it to the task of detecting trending topics on Twitter. Using a small sample of Tweets, our method can detect trends before Twitter does 79% of the time, with a mean early advantage of 1.43 hours, while maintaining a 95% true positive rate and a 4% false positive rate. In addition, our method provides the flexibility to perform well under a variety of tradeoffs between types of error and relative detection time.

This will be interesting in many classification contexts.

Particularly predicting what topics a user will say represent the same subject.

September 28, 2012

Windows into Relational Events: Data Structures for Contiguous Subsequences of Edges

Filed under: Graphs,Networks,Social Media,Social Networks,Time,Time Series — Patrick Durusau @ 12:59 pm

Windows into Relational Events: Data Structures for Contiguous Subsequences of Edges by Michael J. Bannister, Christopher DuBois, David Eppstein, Padhraic Smyth.

Abstract:

We consider the problem of analyzing social network data sets in which the edges of the network have timestamps, and we wish to analyze the subgraphs formed from edges in contiguous subintervals of these timestamps. We provide data structures for these problems that use near-linear preprocessing time, linear space, and sublogarithmic query time to handle queries that ask for the number of connected components, number of components that contain cycles, number of vertices whose degree equals or is at most some predetermined value, number of vertices that can be reached from a starting set of vertices by time-increasing paths, and related queries.

Among other interesting questions, raises the issue of what time span of connections constitutes a network of interest? More than being “dynamic.” A definitional issue for the social network in question.

If you are working with social networks, a must read.

PS: You probably need to read: Relational events vs graphs, a posting by David Eppstein.

David details several different terms for “relational event data,” and says there are probably others they did not find. (Topic maps anyone?)

July 6, 2012

UCR Time Series Classification/Clustering Page

Filed under: Classification,Clustering,Time Series — Patrick Durusau @ 6:48 pm

UCR Time Series Classification/Clustering Page

I encountered this while hunting down references on the insect identification contest.

How does your thinking about topic maps or other semantic solutions fare against:

Machine learning research has, to a great extent, ignored an important aspect of many real world applications: time. Existing concept learners predominantly operate on a static set of attributes; for example, classifying flowers described by leaf size, petal colour and petal count. The values of these attributes is assumed to be unchanging — the flower never grows or loses leaves.

However, many real datasets are not “static”; they cannot sensibly be represented as a fi xed set of attributes. Rather, the examples are expressed as features that vary temporally, and it is the temporal variation itself that is used for classifi cation. Consider a simple gesture recognition domain, in which the temporal features are the position of the hands, finger bends, and so on. Looking at the position of the hand at one point in time is not likely to lead to a successful classifi cation; it is only by analysing changes in position that recognition is possible.

(Temporal Classi cation: Extending the Classi cation Paradigm to Multivariate Time Series by Mohammed Waleed Kadous (2002))

A decade old now but still a nice summary of the issue.

Can we substitute “identification” for “machine learning research?”

Are you relying “…on a static set of attributes” for identity purposes?

June 21, 2012

Basic Time Series with Cassandra

Filed under: Cassandra,Time,Time Series — Patrick Durusau @ 4:24 pm

Basic Time Series with Cassandra

From the post:

One of the most common use cases for Cassandra is tracking time-series data. Server log files, usage, sensor data, SIP packets, stuff that changes over time. For the most part this is a straight forward process but given that Cassandra has real-world limitations on how much data can or should be in a row, there are a few details to consider.

As it says in the title, “basic” time series, the post concludes with:

Indexing and Aggregation

Indexing and aggregation of time-series data is a more complicated topic as they are highly application dependent. Various new and upcoming features of Cassandra also change the best practices for how things like aggregation are done so I won’t go into that. For more details, hit #cassandra on irc.freenode and ask around. There is usually somebody there to help.

But why would you collect time-series data if you weren’t going to index and/or aggregate it?

Anyone care to suggest “best practices?”

April 2, 2012

iSAX

Filed under: Data Mining,iSAX,SAX,Time Series — Patrick Durusau @ 5:47 pm

iSAX

An extension of the SAX software for larger data sets. Detailed in: iSAX: Indexing and Mining Terabyte Sized Time Series.

Abstract:

Current research in indexing and mining time series data has produced many interesting algorithms and representations. However, it has not led to algorithms that can scale to the increasingly massive datasets encountered in science, engineering, and business domains. In this work, we show how a novel multiresolution symbolic representation can be used to index datasets which are several orders of magnitude larger than anything else considered in the literature. Our approach allows both fast exact search and ultra fast approximate search. We show how to exploit the combination of both types of search as sub-routines in data mining algorithms, allowing for the exact mining of truly massive real world datasets, containing millions of time series.

There are a number of data sets at this page with “…warning 500meg file.”

SAX (Symbolic Aggregate approXimation)

Filed under: Data Mining,SAX,Time Series — Patrick Durusau @ 5:47 pm

SAX (Symbolic Aggregate approXimation)

From the webpage:

SAX is the first symbolic representation for time series that allows for dimensionality reduction and indexing with a lower-bounding distance measure. In classic data mining tasks such as clustering, classification, index, etc., SAX is as good as well-known representations such as Discrete Wavelet Transform (DWT) and Discrete Fourier Transform (DFT), while requiring less storage space. In addition, the representation allows researchers to avail of the wealth of data structures and algorithms in bioinformatics or text mining, and also provides solutions to many challenges associated with current data mining tasks. One example is motif discovery, a problem which we defined for time series data. There is great potential for extending and applying the discrete representation on a wide class of data mining tasks.

From a testimonial on the webpage:

the performance SAX enables is amazing, and I think a real breakthrough. As an example, we can find similarity searches using edit distance over 10,000 time series in 50 milliseconds. Ray Cromwell, Timepedia.org

Don’t usually see “testimonials” on an academic website but they appear to be merited in this case.

Serious similarity software. Take the time to look.

BTW, you may also be interested in a SAX time series/Shape tutorial. (120 slides about what makes SAX special.)

UCR Time Series Classification/Clustering Page

Filed under: Classification,Clustering,Dataset,Time Series — Patrick Durusau @ 5:46 pm

UCR Time Series Classification/Clustering Page

From the webpage:

This webpage has been created as a public service to the data mining/machine learning community, to encourage reproducible research for time series classification and clustering.

While chasing the details on Eamonn Keogh and his time series presentation, I encountered this collection of data sets.

February 13, 2011

dygraphs JavaScript Visualization Library

Filed under: Graphics,Javascript,Time Series — Patrick Durusau @ 5:50 am

dygraphs JavaScript Visualization Library

From the website:

dygraphs is an open source JavaScript library that produces produces interactive, zoomable charts of time series. It is designed to display dense data sets and enable users to explore and interpret them.

If your topic map contains or can be viewed as a time series, this graphics library may be of interest to you.

Powered by WordPress