Another Word For It Patrick Durusau on Topic Maps and Semantic Diversity

February 24, 2016

Open-Source Sequence Clustering Methods Improve the State Of the Art

Open-Source Sequence Clustering Methods Improve the State Of the Art by Evguenia Kopylova et al.

Abstract:

Sequence clustering is a common early step in amplicon-based microbial community analysis, when raw sequencing reads are clustered into operational taxonomic units (OTUs) to reduce the run time of subsequent analysis steps. Here, we evaluated the performance of recently released state-of-the-art open-source clustering software products, namely, OTUCLUST, Swarm, SUMACLUST, and SortMeRNA, against current principal options (UCLUST and USEARCH) in QIIME, hierarchical clustering methods in mothur, and USEARCH’s most recent clustering algorithm, UPARSE. All the latest open-source tools showed promising results, reporting up to 60% fewer spurious OTUs than UCLUST, indicating that the underlying clustering algorithm can vastly reduce the number of these derived OTUs. Furthermore, we observed that stringent quality filtering, such as is done in UPARSE, can cause a significant underestimation of species abundance and diversity, leading to incorrect biological results. Swarm, SUMACLUST, and SortMeRNA have been included in the QIIME 1.9.0 release.

IMPORTANCE Massive collections of next-generation sequencing data call for fast, accurate, and easily accessible bioinformatics algorithms to perform sequence clustering. A comprehensive benchmark is presented, including open-source tools and the popular USEARCH suite. Simulated, mock, and environmental communities were used to analyze sensitivity, selectivity, species diversity (alpha and beta), and taxonomic composition. The results demonstrate that recent clustering algorithms can significantly improve accuracy and preserve estimated diversity without the application of aggressive filtering. Moreover, these tools are all open source, apply multiple levels of multithreading, and scale to the demands of modern next-generation sequencing data, which is essential for the analysis of massive multidisciplinary studies such as the Earth Microbiome Project (EMP) (J. A. Gilbert, J. K. Jansson, and R. Knight, BMC Biol 12:69, 2014, http://dx.doi.org/10.1186/s12915-014-0069-1).

Bioinformatics has specialized clustering issues but improvements in clustering algorithms are likely to have benefits for others.

Not to mention garage gene hackers, who may benefit more directly.

January 14, 2015

ExAC Browser (Beta) | Exome Aggregation Consortium

Filed under: Bioinformatics,Genome,Genomics — Patrick Durusau @ 4:38 pm

ExAC Browser (Beta) | Exome Aggregation Consortium

From the webpage:

The Exome Aggregation Consortium (ExAC) is a coalition of investigators seeking to aggregate and harmonize exome sequencing data from a wide variety of large-scale sequencing projects, and to make summary data available for the wider scientific community.

The data set provided on this website spans 61,486 unrelated individuals sequenced as part of various disease-specific and population genetic studies. The ExAC Principal Investigators and groups that have contributed data to the current release are listed here.

All data here are released under a Fort Lauderdale Agreement
for the benefit of the wider biomedical community – see the terms of use here.

Sign up for our mailing list for future release announcements here.

“Big data” is so much more than “likes,” “clicks,” “visits,” “views,” etc.

I first saw this in a tweet by Mark McCarthy.

December 17, 2014

History & Philosophy of Computational and Genome Biology

Filed under: Bioinformatics,Biology,Genome — Patrick Durusau @ 8:35 pm

History & Philosophy of Computational and Genome Biology by Mark Boguski.

A nice collection of books and articles on computational and genome biology. It concludes with this anecdote:

Despite all of the recent books and biographies that have come out about the Human Genome Project, I think there are still many good stories to be told. One of them is the origin of the idea for whole-genome shotgun and assembly. I recall a GRRC (Genome Research Review Committee) review that took place in late 1996 or early 1997 where Jim Weber proposed a whole-genome shotgun approach. The review panel, at first, wanted to unceremoniously “NeRF” (Not Recommend for Funding) the grant but I convinced them that it deserved to be formally reviewed and scored, based on Jim’s pioneering reputation in the area of genetic polymorphism mapping and its impact on the positional cloning of human disease genes and the origins of whole-genome genotyping. After due deliberation, the GRRC gave the Weber application a non-fundable score (around 350 as I recall) largely on the basis of Weber’s inability to demonstrate that the “shotgun” data could be assembled effectively.

Some time later, I was giving a ride to Jim Weber who was in Bethesda for a meeting. He told me why his grant got a low score and asked me if I knew any computer scientists that could help him address the assembly problem. I suggested he talk with Gene Myers (I knew Gene and his interests well since, as one of the five authors of the BLAST algorithm, he was a not infrequent visitor to NCBI).

The following May, Weber and Myers submitted a “perspective” for publication in Genome Research entitled “Human whole-genome shotgun sequencing“. This article described computer simulations which showed that assembly was possible and was essentially a rebuttal to the negative review and low priority score that came out of the GRRC. The editors of Genome Research (including me at the time) sent the Weber/Myers article to Phil Green (a well-known critic of shotgun sequencing) for review. Phil’s review was extremely detailed and actually longer that the Weber/Myers paper itself! The editors convinced Phil to allow us to publish his critique entitled “Against a whole-genome shotgun” as a point-counterpoint feature alongside the Weber-Myers article in the journal.

The rest, as they say, is history, because only a short time later, Craig Venter (whose office at TIGR had requested FAX copies of both the point and counterpoint as soon as they were published) and Mike Hunkapiller announced their shotgun sequencing and assembly project and formed Celera. They hired Gene Myers to build the computational capabilities and assemble their shotgun data which was first applied to the Drosophila genome as practice for tackling a human genome which, as is now known, was Venter’s own. Three of my graduate students (Peter Kuehl, Jiong Zhang and Oxana Pickeral) and I participated in the Drosophila annotation “jamboree” (organized by Mark Adams of Celera and Gerry Rubin) working specifically on an analysis of the counterparts of human disease genes in the Drosophila genome. Other aspects of the Jamboree are described in a short book by one of the other participants, Michael Ashburner.

The same type of stories exist not only from the early days of computer science but since then as well. Stories that will capture the imaginations of potential CS majors as well as illuminate areas where computer science can or can’t be useful.

How many of those stories have you captured?

I first saw this in a tweet by Neil Saunders.

October 2, 2014

Data Auditing and Contamination in Genome Databases

Filed under: Data Auditing,Data Contamination,Genome,Genomics — Patrick Durusau @ 3:50 pm

Contamination of genome databases highlight the need for data auditing trails.

Consider:

Abundant Human DNA Contamination Identified in Non-Primate Genome Databases by Mark S. Longo, Michael J. O’Neill, Rachel J. O’Neill (rachel.oneill@uconn.edu). (Longo MS, O’Neill MJ, O’Neill RJ (2011) Abundant Human DNA Contamination Identified in Non-Primate Genome Databases. PLoS ONE 6(2): e16410. doi:10.1371/journal.pone.0016410) (herein, Longo.

During routine screens of the NCBI databases using human repetitive elements we discovered an unlikely level of nucleotide identity across a broad range of phyla. To ascertain whether databases containing DNA sequences, genome assemblies and trace archive reads were contaminated with human sequences, we performed an in depth search for sequences of human origin in non-human species. Using a primate specific SINE, AluY, we screened 2,749 non-primate public databases from NCBI, Ensembl, JGI, and UCSC and have found 492 to be contaminated with human sequence. These represent species ranging from bacteria (B. cereus) to plants (Z. mays) to fish (D. rerio) with examples found from most phyla. The identification of such extensive contamination of human sequence across databases and sequence types warrants caution among the sequencing community in future sequencing efforts, such as human re-sequencing. We discuss issues this may raise as well as present data that gives insight as to how this may be occurring.

Mining of public sequencing databases supports a non-dietary origin for putative foreign miRNAs: underestimated effects of contamination in NGS. by Tosar JP, Rovira C, Naya H, Cayota A. (RNA. 2014 Jun;20(6):754-7. doi: 10.1261/rna.044263.114. Epub 2014 Apr 11.)

The report that exogenous plant miRNAs are able to cross the mammalian gastrointestinal tract and exert gene-regulation mechanism in mammalian tissues has yielded a lot of controversy, both in the public press and the scientific literature. Despite the initial enthusiasm, reproducibility of these results was recently questioned by several authors. To analyze the causes of this unease, we searched for diet-derived miRNAs in deep-sequencing libraries performed by ourselves and others. We found variable amounts of plant miRNAs in publicly available small RNA-seq data sets of human tissues. In human spermatozoa, exogenous RNAs reached extreme, biologically meaningless levels. On the contrary, plant miRNAs were not detected in our sequencing of human sperm cells, which was performed in the absence of any known sources of plant contamination. We designed an experiment to show that cross-contamination during library preparation is a source of exogenous RNAs. These contamination-derived exogenous sequences even resisted oxidation with sodium periodate. To test the assumption that diet-derived miRNAs were actually contamination-derived, we sought in the literature for previous sequencing reports performed by the same group which reported the initial finding. We analyzed the spectra of plant miRNAs in a small RNA sequencing study performed in amphioxus by this group in 2009 and we found a very strong correlation with the plant miRNAs which they later reported in human sera. Even though contamination with exogenous sequences may be easy to detect, cross-contamination between samples from the same organism can go completely unnoticed, possibly affecting conclusions derived from NGS transcriptomics.

Whether the contamination of these databases is significant or not, is a matter for debate. See the comments to Longo.

Even if errors are “easy to spot,” the question remains for both users and curators of these databases, how to provide data auditing for corrections/updates?

At a minimum, one would expect to know:

  • Database/dataset values for any given date?
  • When values changed?
  • What values changed?
  • Who changed those values?
  • On what basis were the changes made?
  • Comments on the changes
  • Links to literature concerning the changes
  • Do changes have an “audit” trail that includes both the original and new values?

If there is no “audit” trail, on what basis would I “trust” the data on a particular date?

Suggestions on current correction practices?

I first saw this in a post by Mick Watson.

August 28, 2014

Thou Shalt Share!

Filed under: Bioinformatics,Genome,Genomics,Open Data — Patrick Durusau @ 1:46 pm

NIH Tells Genomic Researchers: ‘You Must Share Data’ by Paul Basken.

From the post:

Scientists who use government money to conduct genomic research will now be required to quickly share the data they gather under a policy announced on Wednesday by the National Institutes of Health.

The data-sharing policy, which will take effect with grants awarded in January, will give agency-financed researchers six months to load any genomic data they collect—from human or nonhuman subjects—into a government-established database or a recognized alternative.

NIH officials described the move as the latest in a series of efforts by the federal government to improve the efficiency of taxpayer-financed research by ensuring that scientific findings are shared as widely as possible.

“We’ve gone from a circumstance of saying, ‘Everybody should share data,’ to now saying, in the case of genomic data, ‘You must share data,’” said Eric D. Green, director of the National Human Genome Research Institute at the NIH.

A step in the right direction!

Waiting for other government funding sources and private funders (including in the humanities) to take the same step.

I first saw this in a tweet by Kevin Davies.

August 14, 2014

Are You A Kardashian?

Filed under: Genome,Humor,Science — Patrick Durusau @ 1:42 pm

The Kardashian index: a measure of discrepant social media profile for scientists by Neil Hall.

Abstract:

In the era of social media there are now many different ways that a scientist can build their public profile; the publication of high-quality scientific papers being just one. While social media is a valuable tool for outreach and the sharing of ideas, there is a danger that this form of communication is gaining too high a value and that we are losing sight of key metrics of scientific value, such as citation indices. To help quantify this, I propose the ‘Kardashian Index’, a measure of discrepancy between a scientist’s social media profile and publication record based on the direct comparison of numbers of citations and Twitter followers.

A playful note on a new index based on a person’s popularity on twitter and their citation record. Not to be taken too seriously but not to be ignored altogether. The influence of popularity, the media asking Neil deGrasse Tyson, an astrophysicist and TV scientist, his opinion about GMOs, is a good example.

Tyson sees no difference between modern GMOs and selective breeding, which has been practiced for thousands of years. Tyson overlooks selective breeding’s requirement of an existing trait to bred towards. In other words, selective breeding has a natural limit built into the process.

For example, there are no naturally fluorescent Zebrafish:

Zebrafish

so you can’t selectively breed fluorescent ones.

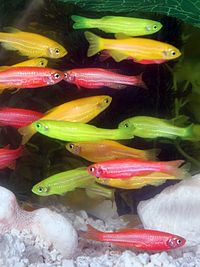
On the other hand, with genetic modification, you can produce a variety of fluorescent Zebrafish know as GloFish:

Glofish

Genetic modification has no natural boundary as is present in selective breeding.

With that fact in mind, I think everyone would agree that selective breeding and genetic modification aren’t the same thing. Similar but different.

A subtle distinction that eludes Kardashian TV scientist Neil deGrasse Tyson (Twitter, 2.26M followers).

I first saw this in a tweet by Steven Strogatz.

July 21, 2014

Christmas in July?

Filed under: Bioinformatics,Genome,Genomics — Patrick Durusau @ 4:18 pm

It won’t be Christmas in July but bioinformatics folks will feel like it with the release of the full annotation of the human genome assembly (GRCh38) due to drop at the end of July 2014.

Dan Murphy covers progress on the annotation and information about the upcoming release in: The new human annotation is almost here!

This is an important big data set.

How would you integrate it with other data sets?

I first saw this in a tweet by Neil Saunders.

August 4, 2013

The 97% Junk Part of Human DNA

Filed under: Bioinformatics,Biomedical,Gene Ontology,Genome,Genomics — Patrick Durusau @ 9:21 am

Researchers from the Gene and Stem Cell Therapy Program at Sydney’s Centenary Institute have confirmed that, far from being “junk,” the 97 per cent of human DNA that does not encode instructions for making proteins can play a significant role in controlling cell development.

And in doing so, the researchers have unravelled a previously unknown mechanism for regulating the activity of genes, increasing our understanding of the way cells develop and opening the way to new possibilities for therapy.

Using the latest gene sequencing techniques and sophisticated computer analysis, a research group led by Professor John Rasko AO and including Centenary’s Head of Bioinformatics, Dr William Ritchie, has shown how particular white blood cells use non-coding DNA to regulate the activity of a group of genes that determines their shape and function. The work is published today in the scientific journal Cell.*

There’s a poke with a sharp stick to any gene ontology.

Roles in associations of genes have suddenly expanded.

Your call:

  1. Wait until a committee can officially name the new roles and parts of the “junk” that play those roles, or
  2. Create names/roles on the fly and merge those with subsequent identifiers on an ongoing basis as our understanding improves.

Any questions?

*Justin J.-L. Wong, William Ritchie, Olivia A. Ebner, Matthias Selbach, Jason W.H. Wong, Yizhou Huang, Dadi Gao, Natalia Pinello, Maria Gonzalez, Kinsha Baidya, Annora Thoeng, Teh-Liane Khoo, Charles G. Bailey, Jeff Holst, John E.J. Rasko. Orchestrated Intron Retention Regulates Normal Granulocyte Differentiation. Cell, 2013; 154 (3): 583 DOI: 10.1016/j.cell.2013.06.052

April 3, 2013

Biological Database of Images and Genomes

Filed under: Associations,Biology,Genome,Genomics — Patrick Durusau @ 4:48 am

Biological Database of Images and Genomes: tools for community annotations linking image and genomic information by Andrew T Oberlin, Dominika A Jurkovic, Mitchell F Balish and Iddo Friedberg. (Database (2013) 2013 : bat016 doi: 10.1093/database/bat016)

Abstract:

Genomic data and biomedical imaging data are undergoing exponential growth. However, our understanding of the phenotype–genotype connection linking the two types of data is lagging behind. While there are many types of software that enable the manipulation and analysis of image data and genomic data as separate entities, there is no framework established for linking the two. We present a generic set of software tools, BioDIG, that allows linking of image data to genomic data. BioDIG tools can be applied to a wide range of research problems that require linking images to genomes. BioDIG features the following: rapid construction of web-based workbenches, community-based annotation, user management and web services. By using BioDIG to create websites, researchers and curators can rapidly annotate a large number of images with genomic information. Here we present the BioDIG software tools that include an image module, a genome module and a user management module. We also introduce a BioDIG-based website, MyDIG, which is being used to annotate images of mycoplasmas.

Database URL: BioDIG website: http://biodig.org

BioDIG source code repository: http://github.com/FriedbergLab/BioDIG

The MyDIG database: http://mydig.biodig.org/

Linking image data to genomic data. Sounds like associations to me.

You?

Not to mention the heterogeneity of genomic data.

Imagine extending an image/genomic data association by additional genomic data under a different identification.

February 19, 2013

How Stable is Your Ontology?

Filed under: Gene Ontology,Genome,Ontology — Patrick Durusau @ 8:00 am

Assessing identity, redundancy and confounds in Gene Ontology annotations over time by Jesse Gillis and Paul Pavlidis. (Bioinformatics (2013) 29 (4): 476-482. doi: 10.1093/bioinformatics/bts727)

Abstract:

Motivation: The Gene Ontology (GO) is heavily used in systems biology, but the potential for redundancy, confounds with other data sources and problems with stability over time have been little explored.

Results: We report that GO annotations are stable over short periods, with 3% of genes not being most semantically similar to themselves between monthly GO editions. However, we find that genes can alter their ‘functional identity’ over time, with 20% of genes not matching to themselves (by semantic similarity) after 2 years. We further find that annotation bias in GO, in which some genes are more characterized than others, has declined in yeast, but generally increased in humans. Finally, we discovered that many entries in protein interaction databases are owing to the same published reports that are used for GO annotations, with 66% of assessed GO groups exhibiting this confound. We provide a case study to illustrate how this information can be used in analyses of gene sets and networks.

Availability: Data available at http://chibi.ubc.ca/assessGO.

How does your ontology account for changes in identity over time?

December 21, 2012

New Public-Access Source With 3-D Information for Protein Interactions

Filed under: Bioinformatics,Biomedical,Genome,Genomics — Patrick Durusau @ 5:24 pm

New Public-Access Source With 3-D Information for Protein Interactions

From the post:

Researchers have developed a platform that compiles all the atomic data, previously stored in diverse databases, on protein structures and protein interactions for eight organisms of relevance. They apply a singular homology-based modelling procedure.

The scientists Roberto Mosca, Arnaud Ceol and Patrick Aloy provide the international biomedical community with Interactome3D (interactome3d.irbbarcelona.org), an open-access and free web platform developed entirely by the Institute for Research in Biomedicine (IRB Barcelona). Interactome 3D offers for the first time the possibility to anonymously access and add molecular details of protein interactions and to obtain the information in 3D models. For researchers, atomic level details about the reactions are fundamental to unravel the bases of biology, disease development, and the design of experiments and drugs to combat diseases.

Interactome 3D provides reliable information about more than 12,000 protein interactions for eight model organisms, namely the plant Arabidopsis thaliana, the worm Caenorhabditis elegans, the fly Drosophila melanogaster, the bacteria Escherichia coli and Helicobacter pylori, the brewer’s yeast Saccharomyces cerevisiae, the mouse Mus musculus, and Homo sapiens. These models are considered the most relevant in biomedical research and genetic studies. The journal Nature Methods presents the research results and accredits the platform on the basis of it high reliability and precision in modelling interactions, which reaches an average of 75%.

Further details can be found at:

Interactome3D: adding structural details to protein networks by Roberto Mosca, Arnaud Céol and Patrick Aloy. (Nature Methods (2012) doi:10.1038/nmeth.2289)

Abstract:

Network-centered approaches are increasingly used to understand the fundamentals of biology. However, the molecular details contained in the interaction networks, often necessary to understand cellular processes, are very limited, and the experimental difficulties surrounding the determination of protein complex structures make computational modeling techniques paramount. Here we present Interactome3D, a resource for the structural annotation and modeling of protein-protein interactions. Through the integration of interaction data from the main pathway repositories, we provide structural details at atomic resolution for over 12,000 protein-protein interactions in eight model organisms. Unlike static databases, Interactome3D also allows biologists to upload newly discovered interactions and pathways in any species, select the best combination of structural templates and build three-dimensional models in a fully automated manner. Finally, we illustrate the value of Interactome3D through the structural annotation of the complement cascade pathway, rationalizing a potential common mechanism of action suggested for several disease-causing mutations.

Interesting not only for its implications for bioinformatics but for the development of homology modeling (superficially, similar proteins have similar interaction sites) to assist in their work.

The topic map analogy would be to show a subject domain, different identifications of the same subject tend to have the same associations or to fall into other patterns.

Then constructing a subject identity test based upon a template of associations or other values.

November 12, 2012

KEGG: Kyoto Encyclopedia of Genes and Genomes

Filed under: Bioinformatics,Biomedical,Genome — Patrick Durusau @ 8:01 pm

KEGG: Kyoto Encyclopedia of Genes and Genomes

From the webpage:

KEGG is a database resource for understanding high-level functions and utilities of the biological system, such as the cell, the organism and the ecosystem, from molecular-level information, especially large-scale molecular datasets generated by genome sequencing and other high-throughput experimental technologies (See Release notes for new and updated features).

Anyone in biological research is probably already using KEGG. Take the opportunity to educate yourself about this resource. In particular how to use it with other resources.

The KEGG project, like any other project, needs funding. Consider passing this site along to funders interested in biological research resources.

I first saw this in a tweet by Anita de Waard.

October 20, 2012

Bio4j 0.8, some numbers

Filed under: Bio4j,Bioinformatics,Genome,Graphs — Patrick Durusau @ 10:29 am

Bio4j 0.8, some numbers by Pablo Pareja Tobes.

Bio4j 0.8 was recently released and now it’s time to have a deeper look at its numbers (as you can see we are quickly approaching the 1 billion relationships and 100M nodes):

  • Number of Relationships: 717.484.649
  • Number of Nodes: 92.667.745
  • Relationship types: 144
  • Node types: 42

If Pablo gets tired of his brilliant career in bioinformatics he can always run for office in the United States with claims like: “…we are quickly approaching the 1 billion relationships….” 😉

Still, a stunning achievement!

See Pablo’s post for more analysis.

Pass the project along to anyone with doubts about graph databases.

October 16, 2012

The “O” Word (Ontology) Isn’t Enough

Filed under: Bioinformatics,Biomedical,Gene Ontology,Genome,Medical Informatics,Ontology — Patrick Durusau @ 10:36 am

The Units Ontology makes reference to the Gene Ontology as an example of a successful web ontology effort.

As it should. The Gene Ontology (GO) is the only successful web ontology effort. A universe with one (1) inhabitant.

The GO has a number of differences from wannabe successful ontology candidates. (see the article below)

The first difference echoes loudly across the semantic engineering universe:

One of the factors that account for GO’s success is that it originated from within the biological community rather than being created and subsequently imposed by external knowledge engineers. Terms were created by those who had expertise in the domain, thus avoiding the huge effort that would have been required for a computer scientist to learn and organize large amounts of biological functional information. This also led to general acceptance of the terminology and its organization within the community. This is not to say that there have been no disagreements among biologists over the conceptualization, and there is of course a protocol for arriving at a consensus when there is such a disagreement. However, a model of a domain is more likely to conform to the shared view of a community if the modelers are within or at least consult to a large degree with members of that community.

Did you catch that first line?

One of the factors that account for GO’s success is that it originated from within the biological community rather than being created and subsequently imposed by external knowledge engineers.

Saying the “O” word, ontology, that will benefit everyone if they will just listen to you, isn’t enough.

There are other factors to consider:

A Short Study on the Success of the Gene Ontology by Michael Bada, Robert Stevens, Carole Goble, Yolanda Gil, Michael Ashburner, Judith A. Blake, J. Michael Cherry, Midori Harris, Suzanna Lewis.

Abstract:

While most ontologies have been used only by the groups who created them and for their initially defined purposes, the Gene Ontology (GO), an evolving structured controlled vocabulary of nearly 16,000 terms in the domain of biological functionality, has been widely used for annotation of biological-database entries and in biomedical research. As a set of learned lessons offered to other ontology developers, we list and briefly discuss the characteristics of GO that we believe are most responsible for its success: community involvement; clear goals; limited scope; simple, intuitive structure; continuous evolution; active curation; and early use.

October 13, 2012

Bio4j 0.8 is here!

Filed under: Bio4j,Bioinformatics,Biomedical,Genome — Patrick Durusau @ 1:57 pm

Bio4j 0.8 is here! by Pablo Pareja Tobes.

You will find “5.488.000 new proteins and 3.233.000 genes” and other improvements!

Whether you are interested in graph databases (Neo4j), bioinformatics or both, this is welcome news!

October 12, 2012

PathNet: A tool for pathway analysis using topological information

Filed under: Bioinformatics,Biomedical,Genome,Graphs,Networks — Patrick Durusau @ 3:12 pm

PathNet: A tool for pathway analysis using topological information by Bhaskar Dutta, Anders Wallqvist and Jaques Reifman. (Source Code for Biology and Medicine 2012, 7:10 doi:10.1186/1751-0473-7-10)

Abstract:

Background

Identification of canonical pathways through enrichment of differentially expressed genes in a given pathway is a widely used method for interpreting gene lists generated from highthroughput experimental studies. However, most algorithms treat pathways as sets of genes, disregarding any inter- and intra-pathway connectivity information, and do not provide insights beyond identifying lists of pathways.

Results

We developed an algorithm (PathNet) that utilizes the connectivity information in canonical pathway descriptions to help identify study-relevant pathways and characterize non-obvious dependencies and connections among pathways using gene expression data. PathNet considers both the differential expression of genes and their pathway neighbors to strengthen the evidence that a pathway is implicated in the biological conditions characterizing the experiment. As an adjunct to this analysis, PathNet uses the connectivity of the differentially expressed genes among all pathways to score pathway contextual associations and statistically identify biological relations among pathways. In this study, we used PathNet to identify biologically relevant results in two Alzheimers disease microarray datasets, and compared its performance with existing methods. Importantly, PathNet identified deregulation of the ubiquitin-mediated proteolysis pathway as an important component in Alzheimers disease progression, despite the absence of this pathway in the standard enrichment analyses.

Conclusions

PathNet is a novel method for identifying enrichment and association between canonical pathways in the context of gene expression data. It takes into account topological information present in pathways to reveal biological information. PathNet is available as an R workspace image from http://www.bhsai.org/downloads/pathnet/.

Important work for genomics but also a reminder that a list of paths is just that, a list of paths.

The value-add and creative aspect of data analysis is in the scoring of those paths in order to wring more information from them.

How is it for you? Just lists of paths or something a bit more clever?

September 10, 2012

Mapping solution to heterogeneous data sources

Filed under: Bioinformatics,Biomedical,Genome,Heterogeneous Data,Mapping — Patrick Durusau @ 2:21 pm

dbSNO: a database of cysteine S-nitrosylation by Tzong-Yi Lee, Yi-Ju Chen, Cheng-Tsung Lu, Wei-Chieh Ching, Yu-Chuan Teng, Hsien-Da Huang and Yu-Ju Chen. (Bioinformatics (2012) 28 (17): 2293-2295. doi: 10.1093/bioinformatics/bts436)

OK, the title doesn’t jump out and say “mapping solution here!” 😉

Reading a bit further, you discover that text mining is used to locate sequences and that data is then mapped to “UniProtKB protein entries.”

The data set provides access to:

  • UniProt ID
  • Organism
  • Position
  • PubMed Id
  • Sequence

My concern is what happens when X is mapped to a UniProtKB protein entry to:

  • The prior identifier for X (in the article or source), and
  • The mapping from X to the UniProtKB protein entry?

If both of those are captured, then prior literature can be annotated upon rendering to point to later aggregation of information on a subject.

If the prior identifier, place of usage, the mapping, etc., are not captured, then prior literature, when we encounter it, remains frozen in time.

Mapping solutions work, but repay the effort several times over if the prior identifier and its mapping to the “new” identifier are captured as part of the process.

Abstract

Summary: S-nitrosylation (SNO), a selective and reversible protein post-translational modification that involves the covalent attachment of nitric oxide (NO) to the sulfur atom of cysteine, critically regulates protein activity, localization and stability. Due to its importance in regulating protein functions and cell signaling, a mass spectrometry-based proteomics method rapidly evolved to increase the dataset of experimentally determined SNO sites. However, there is currently no database dedicated to the integration of all experimentally verified S-nitrosylation sites with their structural or functional information. Thus, the dbSNO database is created to integrate all available datasets and to provide their structural analysis. Up to April 15, 2012, the dbSNO has manually accumulated >3000 experimentally verified S-nitrosylated peptides from 219 research articles using a text mining approach. To solve the heterogeneity among the data collected from different sources, the sequence identity of these reported S-nitrosylated peptides are mapped to the UniProtKB protein entries. To delineate the structural correlation and consensus motif of these SNO sites, the dbSNO database also provides structural and functional analyses, including the motifs of substrate sites, solvent accessibility, protein secondary and tertiary structures, protein domains and gene ontology.

Availability: The dbSNO is now freely accessible via http://dbSNO.mbc.nctu.edu.tw. The database content is regularly updated upon collecting new data obtained from continuously surveying research articles.

Contacts: francis@saturn.yu.edu.tw or yujuchen@gate.sinica.edu.tw.

Reveal—visual eQTL analytics [Statistics of Identity/Association]

Filed under: Bioinformatics,Biomedical,Genome — Patrick Durusau @ 1:36 pm

Reveal—visual eQTL analytics by Günter Jäger, Florian Battke and Kay Nieselt. (Bioinformatics (2012) 28 (18): i542-i548. doi: 10.1093/bioinformatics/bts382)

Abstract

Motivation: The analysis of expression quantitative trait locus (eQTL) data is a challenging scientific endeavor, involving the processing of very large, heterogeneous and complex data. Typical eQTL analyses involve three types of data: sequence-based data reflecting the genotypic variations, gene expression data and meta-data describing the phenotype. Based on these, certain genotypes can be connected with specific phenotypic outcomes to infer causal associations of genetic variation, expression and disease.

To this end, statistical methods are used to find significant associations between single nucleotide polymorphisms (SNPs) or pairs of SNPs and gene expression. A major challenge lies in summarizing the large amount of data as well as statistical results and to generate informative, interactive visualizations.

Results: We present Reveal, our visual analytics approach to this challenge. We introduce a graph-based visualization of associations between SNPs and gene expression and a detailed genotype view relating summarized patient cohort genotypes with data from individual patients and statistical analyses.

Availability: Reveal is included in Mayday, our framework for visual exploration and analysis. It is available at http://it.inf.uni-tuebingen.de/software/reveal/.

Contact: guenter.jaeger@uni-tuebingen.de

Interesting work on a number of fronts, not the least of it being “…analysis of expression quantitative trait locus (eQTL) data.”

Its use of statistical methods to discover “significant associations,” interactive visualizations and processing of “large, heterogeneous and complex data” are of more immediate interest to me.

Wikipedia is evidence for subjects (including relationships) that can be usefully identified using URLs. But that is only a fraction of all the subjects and relationships we may want to include in our topic maps.

An area I need to work up for my next topic map course is probabilistic identification of subjects and their relationships. What statistical techniques are useful for what fields? Or even what subjects within what fields? What are the processing tradeoffs versus certainty of identification?

Suggestions/comments?

August 31, 2012

Next Generation Sequencing, GNU-Make and .INTERMEDIATE

Filed under: Bioinformatics,Genome — Patrick Durusau @ 9:41 am

Next Generation Sequencing, GNU-Make and .INTERMEDIATE by Pierre Lindenbaum.

From the post:

I gave a crash course about NGS to a few colleagues today. For my demonstration I wrote a simple Makefile. Basically, it downloads a subset of the human chromosome 22, indexes it with bwa, generates a set of fastqs with wgsim, align the fastqs, generates the *.sai, the *.sam, the *.bam, sorts the bam and calls the SNPs with mpileup.

An illustration that there is plenty of life left in GNU Make.

Plus an interesting tip on the use of .intermediate in make scripts.

As a starting point, consider Make (software).

August 15, 2012

BiologicalNetworks

Filed under: Bioinformatics,Biomedical,Genome — Patrick Durusau @ 10:25 am

BiologicalNetworks

From the webpage:

BiologicalNetworks research environment enables integrative analysis of:

  • Interaction networks, metabolic and signaling pathways together with transcriptomic, metabolomic and proteomic experiments data
  • Transcriptional regulation modules (modular networks)
  • Genomic sequences including gene regulatory regions (e.g. binding sites, promoter regions) and respective transcription factors, as well as NGS data
  • Comparative genomics, homologous/orthologous genes and phylogenies
  • 3D protein structures and ligand binding, small molecules and drugs
  • Multiple ontologies including GeneOntology, Cell and Tissue types, Diseases, Anatomy and taxonomies

BiologicalNetworks backend database (IntegromeDB) integrates >1000 curated data sources (from the NAR list) for thousands of eukaryotic, prokaryotic and viral organisms and millions of public biomedical, biochemical, drug, disease and health-related web resources.

Correction: As of 3 July 2012, “IntegromeDB’s index reaches 1 Billion (biomedical resources links) milestone.”

IntegromeDB collects all the biomedical, biochemical, drug and disease related data available in the public domain and brings you the most relevant data for your search. It provides you with an integrative view on the genomic, proteomic, transcriptomic, genetic and functional information featuring gene/protein names, synonyms and alternative IDs, gene function, orthologies, gene expression, pathways and molecular (protein-protein, TF-gene, genetic, etc.) interactions, mutations and SNPs, disease relationships, drugs and compounds, and many other. Explore and enjoy!

Sounds a lot like a topic map doesn’t it?

One interesting feature is Inconsistency in the integrated data.

The data sets are available for download as RDF files.

How would you:

  • Improve the consistency of integrated data?
  • Enable crowd participation in curation of data?
  • Enable the integration of data files into other data systems?

August 10, 2012

The Story Behind “Scaling Metagenome Assembly with Probabilistic de Bruijn Graphs”

Filed under: Bioinformatics,Biomedical,De Bruijn Graphs,Genome,Graphs — Patrick Durusau @ 3:11 pm

The Story Behind “Scaling Metagenome Assembly with Probabilistic de Bruijn Graphs” by C. Titus Brown.

From the post:

This is the story behind our PNAS paper, “Scaling Metagenome Assembly with Probabilistic de Bruijn Graphs” (released from embargo this past Monday).

Why did we write it? How did it get started? Well, rewind the tape 2 years and more…

There we were in May 2010, sitting on 500 million Illumina reads from shotgun DNA sequencing of an Iowa prairie soil sample. We wanted to reconstruct the microbial community contents and structure of the soil sample, but we couldn’t figure out how to do that from the data. We knew that, in theory, the data contained a number of partial microbial genomes, and we had a technique — de novo genome assembly — that could (again, in theory) reconstruct those partial genomes. But when we ran the software, it choked — 500 million reads was too big a data set for the software and computers we had. Plus, we were looking forward to the future, when we would get even more data; if the software was dying on us now, what would we do when we had 10, 100, or 1000 times as much data?

A perfect post to read over the weekend!

Not all research ends successfully, but when it does, it is a story that inspires.

August 8, 2012

The 2012 Nucleic Acids Research Database Issue…

Filed under: Bioinformatics,Biomedical,Genome — Patrick Durusau @ 1:50 pm

The 2012 Nucleic Acids Research Database Issue and the online Molecular Biology Database Collection by Michael Y. Galperin, and Xosé M. Fernández-Suárez.

Abstract:

The 19th annual Database Issue of Nucleic Acids Research features descriptions of 92 new online databases covering various areas of molecular biology and 100 papers describing recent updates to the databases previously described in NAR and other journals. The highlights of this issue include, among others, a description of neXtProt, a knowledgebase on human proteins; a detailed explanation of the principles behind the NCBI Taxonomy Database; NCBI and EBI papers on the recently launched BioSample databases that store sample information for a variety of database resources; descriptions of the recent developments in the Gene Ontology and UniProt Gene Ontology Annotation projects; updates on Pfam, SMART and InterPro domain databases; update papers on KEGG and TAIR, two universally acclaimed databases that face an uncertain future; and a separate section with 10 wiki-based databases, introduced in an accompanying editorial. The NAR online Molecular Biology Database Collection, available at http://www.oxfordjournals.org/nar/database/a/, has been updated and now lists 1380 databases. Brief machine-readable descriptions of the databases featured in this issue, according to the BioDBcore standards, will be provided at the http://biosharing.org/biodbcore web site. The full content of the Database Issue is freely available online on the Nucleic Acids Research web site (http://nar.oxfordjournals.org/).

Abstract of the article describing: Nucleic Acids Research, Database issue, Volume 40 Issue D1 January 2012.

Very much like being a kid in a candy store. Hard to know what to look at next! Both for subject matter experts and those of us interested in the technology aspects of the databases.

ANNOVAR: functional annotation of genetic variants….

Filed under: Bioinformatics,Biomedical,Genome — Patrick Durusau @ 1:50 pm

ANNOVAR: functional annotation of genetic variants from high-throughput sequencing data by Kai Wang, Mingyao Li, and Hakon Hakonarson. (Nucl. Acids Res. (2010) 38 (16): e164. doi: 10.1093/nar/gkq603)

Just in case you are unfamiliar with ANNOVAR, the software mentioned in: gSearch: a fast and flexible general search tool for whole-genome sequencing:

Abstract:

High-throughput sequencing platforms are generating massive amounts of genetic variation data for diverse genomes, but it remains a challenge to pinpoint a small subset of functionally important variants. To fill these unmet needs, we developed the ANNOVAR tool to annotate single nucleotide variants (SNVs) and insertions/deletions, such as examining their functional consequence on genes, inferring cytogenetic bands, reporting functional importance scores, finding variants in conserved regions, or identifying variants reported in the 1000 Genomes Project and dbSNP. ANNOVAR can utilize annotation databases from the UCSC Genome Browser or any annotation data set conforming to Generic Feature Format version 3 (GFF3). We also illustrate a ‘variants reduction’ protocol on 4.7 million SNVs and indels from a human genome, including two causal mutations for Miller syndrome, a rare recessive disease. Through a stepwise procedure, we excluded variants that are unlikely to be causal, and identified 20 candidate genes including the causal gene. Using a desktop computer, ANNOVAR requires ∼4 min to perform gene-based annotation and ∼15 min to perform variants reduction on 4.7 million variants, making it practical to handle hundreds of human genomes in a day. ANNOVAR is freely available at http://www.openbioinformatics.org/annovar/.

Approximately two years separates ANNOVAR from gSearch. Should give you an idea of the speed of development in bioinformatics. They haven’t labored over finding a syntax for everyone to use for more than a decade. I suspect there is a lesson in there somewhere.

gSearch: a fast and flexible general search tool for whole-genome sequencing

Filed under: Bioinformatics,Biomedical,Genome — Patrick Durusau @ 1:49 pm

gSearch: a fast and flexible general search tool for whole-genome sequencing by Taemin Song, Kyu-Baek Hwang, Michael Hsing, Kyungjoon Lee, Justin Bohn, and Sek Won Kong.

Abstract:

Background: Various processes such as annotation and filtering of variants or comparison of variants in different genomes are required in whole-genome or exome analysis pipelines. However, processing different databases and searching among millions of genomic loci is not trivial.

Results: gSearch compares sequence variants in the Genome Variation Format (GVF) or Variant Call Format (VCF) with a pre-compiled annotation or with variants in other genomes. Its search algorithms are subsequently optimized and implemented in a multi-threaded manner. The proposed method is not a stand-alone annotation tool with its own reference databases. Rather, it is a search utility that readily accepts public or user-prepared reference files in various formats including GVF, Generic Feature Format version 3 (GFF3), Gene Transfer Format (GTF), VCF and Browser Extensible Data (BED) format. Compared to existing tools such as ANNOVAR, gSearch runs more than 10 times faster. For example, it is capable of annotating 52.8 million variants with allele frequencies in 6 min.

Availability: gSearch is available at http://ml.ssu.ac.kr/gSearch. It can be used as an independent search tool or can easily be integrated to existing pipelines through various programming environments such as Perl, Ruby and Python.

As the abstract says: “…searching among millions of genomic loci is not trivial.”

Either for integration with topic map tools in a pipeline or for searching technology, definitely worth a close reading.

August 3, 2012

De novo assembly and genotyping of variants using colored de Bruijn graphs

Filed under: Bioinformatics,De Bruijn Graphs,Genome,Graphs,Networks — Patrick Durusau @ 2:06 pm

De novo assembly and genotyping of variants using colored de Bruijn graphs by Zamin Iqbal, Mario Caccamo, Isaac Turner, Paul Flicek & Gil McVean. (Nature Genetics 44, 226–232 (2012))

Abstract:

Detecting genetic variants that are highly divergent from a reference sequence remains a major challenge in genome sequencing. We introduce de novo assembly algorithms using colored de Bruijn graphs for detecting and genotyping simple and complex genetic variants in an individual or population. We provide an efficient software implementation, Cortex, the first de novo assembler capable of assembling multiple eukaryotic genomes simultaneously. Four applications of Cortex are presented. First, we detect and validate both simple and complex structural variations in a high-coverage human genome. Second, we identify more than 3 Mb of sequence absent from the human reference genome, in pooled low-coverage population sequence data from the 1000 Genomes Project. Third, we show how population information from ten chimpanzees enables accurate variant calls without a reference sequence. Last, we estimate classical human leukocyte antigen (HLA) genotypes at HLA-B, the most variable gene in the human genome.

You will need access to Nature Genetics but rounding out today’s posts on de Bruijn graphs with a recent research article.

Comments on the Cortex software appreciated.

Genome assembly and comparison using de Bruijn graphs

Filed under: Bioinformatics,De Bruijn Graphs,Genome,Graphs,Networks — Patrick Durusau @ 10:41 am

Genome assembly and comparison using de Bruijn graphs by Daniel Robert Zerbino. (thesis)

Abstract:

Recent advances in sequencing technology made it possible to generate vast amounts of sequence data. The fragments produced by these high-throughput methods are, however, far shorter than in traditional Sanger sequencing. Previously, micro-reads of less than 50 base pairs were considered useful only in the presence of an existing assembly. This thesis describes solutions for assembling short read sequencing data de novo, in the absence of a reference genome.

The algorithms developed here are based on the de Bruijn graph. This data structure is highly suitable for the assembly and comparison of genomes for the following reasons. It provides a flexible tool to handle the sequence variants commonly found in genome evolution such as duplications, inversions or transpositions. In addition, it can combine sequences of highly different lengths, from short reads to assembled genomes. Finally, it ensures an effective data compression of highly redundant datasets.

This thesis presents the development of a collection of methods, called Velvet, to convert a de Bruijn graph into a traditional assembly of contiguous sequences. The first step of the process, termed Tour Bus, removes sequencing errors and handles biological variations such as polymorphisms. In its second part, Velvet aims to resolve repeats based on the available information, from low coverage long reads (Rock Band) or paired shotgun reads (Pebble). These methods were tested on various simulations for precision and efficiency, then on control experimental datasets.

De Bruijn graphs can also be used to detect and analyse structural variants from unassembled data. The final chapter of this thesis presents the results of collaborative work on the analysis of several experimental unassembled datasets.

De Bruijn graphs are covered in pages 22-42 if you want to cut to the chase.

Obviously of interest to the bioinformatics community.

Where else would you use de Bruijn graph structures?

Is “Massive Data” > “Big Data”?

Filed under: BigData,Bioinformatics,Genome,Graphs,Networks — Patrick Durusau @ 8:32 am

Science News announces: New Computational Technique Relieves Logjam from Massive Amounts of Data, which is a better title than: Scaling metagenome sequence assembly with probabilistic de Bruijn graphs by Jason Pell, Arend Hintze, Rosangela Canino-Koning, Adina Howe, James M. Tiedje, and C. Titus Brown.

But I have to wonder about “massive data,” versus “big data,” versus “really big data,” versus “massive data streams,” as informative phrases. True, I have a weakness for an eye-catching headline but in prose, shouldn’t we say what data is under consideration? Let the readers draw their own conclusions?

The paper abstract reads:

Deep sequencing has enabled the investigation of a wide range of environmental microbial ecosystems, but the high memory requirements for de novo assembly of short-read shotgun sequencing data from these complex populations are an increasingly large practical barrier. Here we introduce a memory-efficient graph representation with which we can analyze the k-mer connectivity of metagenomic samples. The graph representation is based on a probabilistic data structure, a Bloom filter, that allows us to efficiently store assembly graphs in as little as 4 bits per k-mer, albeit inexactly. We show that this data structure accurately represents DNA assembly graphs in low memory. We apply this data structure to the problem of partitioning assembly graphs into components as a prelude to assembly, and show that this reduces the overall memory requirements for de novo assembly of metagenomes. On one soil metagenome assembly, this approach achieves a nearly 40-fold decrease in the maximum memory requirements for assembly. This probabilistic graph representation is a significant theoretical advance in storing assembly graphs and also yields immediate leverage on metagenomic assembly.

If “de Bruijn graphs,” sounds familiar, see: Memory Efficient De Bruijn Graph Construction [Attn: Graph Builders, Chess Anyone?].

July 30, 2012

BioExtract Server

Filed under: Bioinformatics,Genome — Patrick Durusau @ 2:54 pm

BioExtract Server: data access, analysis, storage and workflow creation

From “About us:”

BioExtract harnesses the power of online informatics tools for creating and customizing workflows. Users can query online sequence data, analyze it using an array of informatics tools (web service and desktop), create and share custom workflows for repeated analysis, and save the resulting data and workflows in standardized reports. This work was initially supported by NSF grant 0090732. Current work is being supported by NSF DBI-0606909.

A great tool for sequence data researchers and a good example of what is possible with other structured data sets.

Much has been made (and rightly so) of the need for and difficulties of processing unstructured data.

But we should not ignore the structured data dumps being released by governments and other groups around the world.

And we should recognize that hosted workflows and processing can make insights into data a matter of skill, rather than ownership of enough hardware.

July 26, 2012

Mining the pharmacogenomics literature—a survey of the state of the art

Filed under: Bioinformatics,Genome,Pharmaceutical Research,Text Mining — Patrick Durusau @ 1:23 pm

Mining the pharmacogenomics literature—a survey of the state of the art by Udo Hahn, K. Bretonnel Cohen, and Yael Garten. (Brief Bioinform (2012) 13 (4): 460-494. doi: 10.1093/bib/bbs018)

Abstract:

This article surveys efforts on text mining of the pharmacogenomics literature, mainly from the period 2008 to 2011. Pharmacogenomics (or pharmacogenetics) is the field that studies how human genetic variation impacts drug response. Therefore, publications span the intersection of research in genotypes, phenotypes and pharmacology, a topic that has increasingly become a focus of active research in recent years. This survey covers efforts dealing with the automatic recognition of relevant named entities (e.g. genes, gene variants and proteins, diseases and other pathological phenomena, drugs and other chemicals relevant for medical treatment), as well as various forms of relations between them. A wide range of text genres is considered, such as scientific publications (abstracts, as well as full texts), patent texts and clinical narratives. We also discuss infrastructure and resources needed for advanced text analytics, e.g. document corpora annotated with corresponding semantic metadata (gold standards and training data), biomedical terminologies and ontologies providing domain-specific background knowledge at different levels of formality and specificity, software architectures for building complex and scalable text analytics pipelines and Web services grounded to them, as well as comprehensive ways to disseminate and interact with the typically huge amounts of semiformal knowledge structures extracted by text mining tools. Finally, we consider some of the novel applications that have already been developed in the field of pharmacogenomic text mining and point out perspectives for future research.

At thirty-six (36) pages and well over 200 references, this is going to take a while to digest.

Some questions to be thinking about while reading:

How are entity recognition issues same/different?

What techniques have you seen before? How different/same?

What other techniques would you suggest?

July 17, 2012

Memory Efficient De Bruijn Graph Construction [Attn: Graph Builders, Chess Anyone?]

Filed under: Bioinformatics,Genome,Graphs,Networks — Patrick Durusau @ 10:44 am

Memory Efficient De Bruijn Graph Construction by Yang Li, Pegah Kamousi, Fangqiu Han, Shengqi Yang, Xifeng Yan, and Subhash Suri.

Abstract:

Massively parallel DNA sequencing technologies are revolutionizing genomics research. Billions of short reads generated at low costs can be assembled for reconstructing the whole genomes. Unfortunately, the large memory footprint of the existing de novo assembly algorithms makes it challenging to get the assembly done for higher eukaryotes like mammals. In this work, we investigate the memory issue of constructing de Bruijn graph, a core task in leading assembly algorithms, which often consumes several hundreds of gigabytes memory for large genomes. We propose a disk-based partition method, called Minimum Substring Partitioning (MSP), to complete the task using less than 10 gigabytes memory, without runtime slowdown. MSP breaks the short reads into multiple small disjoint partitions so that each partition can be loaded into memory, processed individually and later merged with others to form a de Bruijn graph. By leveraging the overlaps among the k-mers (substring of length k), MSP achieves astonishing compression ratio: The total size of partitions is reduced from $\Theta(kn)$ to $\Theta(n)$, where $n$ is the size of the short read database, and $k$ is the length of a $k$-mer. Experimental results show that our method can build de Bruijn graphs using a commodity computer for any large-volume sequence dataset.

A discovery in one area of data processing can have a large impact in a number of others. I suspect that will be the case with the technique described here.

The use of substrings for compression and to determine the creation of partitions was particularly clever.

Software and data sets

Questions:

  1. What are the substring characteristics of your data?
  2. How would you use a De Bruijn graph with your data?

If you don’t know the answers to those questions, you might want to find out.

Additional Resources:

De Bruijn Graph (Wikipedia)

De Bruijn Sequence (Wikipedia)

How to apply de Bruijn graphs to genome assembly by Phillip E C Compeau, Pavel A Pevzner, and Glenn Tesler. Nature Biotechnology 29, 987–991 (2011) doi:10.1038/nbt.2023

And De Bruijn graphs/sequences are not just for bioinformatics: from the Chess Programming Wiki: De Bruijn Sequences. (Lots of pointers and additional references.)

Older Posts »

Powered by WordPress