Another Word For It Patrick Durusau on Topic Maps and Semantic Diversity

January 11, 2018

W. E. B. Du Bois as Data Scientist

Filed under: Data Science,Social Sciences,Socioeconomic Data,Visualization — Patrick Durusau @ 3:51 pm

W. E. B. Du Bois’s Modernist Data Visualizations of Black Life by Allison Meier.

From the post:

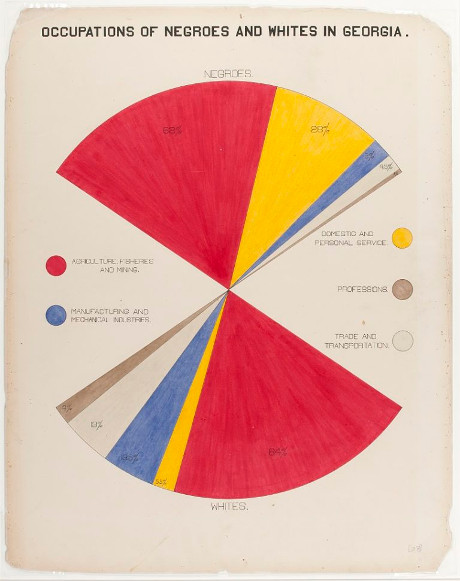
For the 1900 Exposition Universelle in Paris, African American activist and sociologist W. E. B. Du Bois led the creation of over 60 charts, graphs, and maps that visualized data on the state of black life. The hand-drawn illustrations were part of an “Exhibit of American Negroes,” which Du Bois, in collaboration with Thomas J. Calloway and Booker T. Washington, organized to represent black contributions to the United States at the world’s fair.

This was less than half a century after the end of American slavery, and at a time when human zoos displaying people from colonized countries in replicas of their homes were still common at fairs (the ruins of one from the 1907 colonial exhibition in Paris remain in the Bois de Vincennes). Du Bois’s charts (recently shared by data artist Josh Begley on Twitter) focus on Georgia, tracing the routes of the slave trade to the Southern state, the value of black-owned property between 1875 and 1889, comparing occupations practiced by blacks and whites, and calculating the number of black students in different school courses (2 in business, 2,252 in industrial).

Ellen Terrell, a business reference specialist at the Library of Congress, wrote a blog post in which she cites a report by Calloway that laid out the 1900 exhibit’s goals:

It was decided in advance to try to show ten things concerning the negroes in America since their emancipation: (1) Something of the negro’s history; (2) education of the race; (3) effects of education upon illiteracy; (4) effects of education upon occupation; (5) effects of education upon property; (6) the negro’s mental development as shown by the books, high class pamphlets, newspapers, and other periodicals written or edited by members of the race; (7) his mechanical genius as shown by patents granted to American negroes; (8) business and industrial development in general; (9) what the negro is doing for himself though his own separate church organizations, particularly in the work of education; (10) a general sociological study of the racial conditions in the United States.

Georgia was selected to represent these 10 points because, according to Calloway, “it has the largest negro population and because it is a leader in Southern sentiment.” Rebecca Onion on Slate Vault notes that Du Bois created the charts in collaboration with his students at Atlanta University, examining everything from the value of household and kitchen furniture to the “rise of the negroes from slavery to freedom in one generation.”

The post is replete with images created by Du Bois for the exposition, of which this is an example:

As we all know, but rarely say in public, data science and visualization of data isn’t a new discipline.

The data science/visualization by Du Bois merits notice during Black History month (February) but the rest of the year as well. It’s part of our legacy in data science and we should be proud of it.

December 9, 2014

Parable of the Polygons

Filed under: Politics,Simulations,Social Networks,Socioeconomic Data — Patrick Durusau @ 7:26 pm

Parable of the Polygons – A Playable Post on the Shape of Society by VI Hart and Nicky Case.

From the post:

This is a story of how harmless choices can make a harmful world.

A must play post!

Deeply impressive simulation of how segregation comes into being. Moreover, how small choices may not create the society you are trying to achieve.

Bear in mind that these simulations, despite being very instructive, are orders of magnitudes less complex than the social aspects of de jure segregation I grew up under as a child.

That complexity is one of the reasons the ham-handed social engineering projects of government, be they domestic or foreign rarely reach happy results. Some people profit, mostly the architects of such programs and the people they intended to help, well, decades later things haven’t changed all that much.

If you think you have the magic touch to engineer a group, locality, nation or the world, please try your hand at these simulations first. Bearing in mind that we have no working simulations of society that supports social engineering on the scale attempted by various nation states that come to mind.

Highly recommended!

PS: Creating alternatives to show the impacts of variations in data analysis would be quite instructive as well.

January 22, 2014

Social Science Dataset Prize!

Filed under: Contest,Dataset,Social Sciences,Socioeconomic Data,Statistics — Patrick Durusau @ 5:49 pm

Statwing is awarding $1,500 for the best insights from its massive social science dataset by Derrick Harris.

All submissions are due through the form on this page by January 30 at 11:59pm PST.

From the post:

Statistics startup Statwing has kicked off a competition to find the best insights from a 406-variable social science dataset. Entries will be voted on by the crowd, with the winner getting $1,000, second place getting $300 and third place getting $200. (Check out all the rules on the Statwing site.) Even if you don’t win, though, it’s a fun dataset to play with.

The data comes from the General Social Survey and dates back to 1972. It contains variables ranging from sex to feelings about education funding, from education level to whether respondents think homosexual men make good parents. I spent about an hour slicing and dicing variable within the Statwing service, and found some at least marginally interesting stuff. Contest entries can use whatever tools they want, and all 79 megabytes and 39,662 rows are downloadable from the contest page.

Time is short so you better start working.

The rules page, where you make your submission, emphasizes:

Note that this is a competition for the most interesting finding(s), not the best visualization.

Use any tool or method, just find the “most interesting finding(s)” as determined by crowd vote.

On the dataset:

Every other year since 1972, the General Social Survey (GSS) has asked thousands of Americans 90 minutes of questions about religion, culture, beliefs, sex, politics, family, and a lot more. The resulting dataset has been cited by more than 14,000 academic papers, books, and dissertations—more than any except the U.S. Census.

I can’t decide if Americans have more odd opinions now than before. 😉

Maybe some number crunching will help with that question.

March 10, 2013

Cool GSS training video! And cumulative file 1972-2012!

Filed under: Dataset,Social Sciences,Socioeconomic Data — Patrick Durusau @ 8:42 pm

Cool GSS training video! And cumulative file 1972-2012! by Andrew Gelman.

From the post:

Felipe Osorio made the above video to help people use the General Social Survey and R to answer research questions in social science. Go for it!

From the GSS: General Social Survey website:

The General Social Survey (GSS) conducts basic scientific research on the structure and development of American society with a data-collection program designed to both monitor societal change within the United States and to compare the United States to other nations.

The GSS contains a standard ‘core’ of demographic, behavioral, and attitudinal questions, plus topics of special interest. Many of the core questions have remained unchanged since 1972 to facilitate time-trend studies as well as replication of earlier findings. The GSS takes the pulse of America, and is a unique and valuable resource. It has tracked the opinions of Americans over the last four decades.

The information “gap” is becoming more of a matter of skill than access to underlying data.

How would you match the GSS data up to other data sets?

May 10, 2012

Trawling the web for socioeconomic data? Look no further than Knoema

Filed under: Data Source,News,Socioeconomic Data — Patrick Durusau @ 2:21 pm

Trawling the web for socioeconomic data? Look no further than Knoema

From the Guardian Datablog, John Burn-Murdoch writes:

A joint venture by Russian and Indian technology professionals aims to be the Youtube of data. Knoema which launched last month and is marketed by its creators as “your personal knowledge highway”, combines data-gathering with presentation to create an online bank of socioeconomic and environmental data-sets.

The website’s homepage shows a selection of the topics on which Knoema has collected data. Among the categories are broad fields such as commodities and energy, but also more specialised collections including sexual exploitation and biofuels.

[graphics omitted]

Within each subject-area you can find one or more ‘dashboards’ – simple yet comprehensive presentations of data for a given topic, with all source-material documented. Knoema also provides choropleth maps for many of the datasets where figures are given for geographical areas.

Commodity passports‘ are another format in which Knoema offers some of its data. These give a detailed breakdown of production, consumption, imports, exports and market prices for a diverse range of products and materials including apples, cotton and natural gas.

Resource listings following the site review, including the Guardian’s world government data gateway and other resources.

Powered by WordPress