It’s a click-bait title but I’m entirely serious. There are security flaws in IoT adult toys, flaws that enable you to discover and manipulate those toys. I use Congress as an example but the same principles apply to banks, Wall Street offices, government agencies, law firms, etc.
Discovering such a device could result in a lower mortgage interest rate, a favorable administrative decision, changes to pending legislation, dismissal of charges, any number of things normally associated with class-based privilege.
I encountered John Leyden‘s report Dildon’ts of Bluetooth: Pen test boffins sniff out Berlin’s smart butt plugs – You’ve heard of wardriving – say hello to screwdriving (warning NSFW image) first:
Security researchers have figured out how to locate and exploit smart adult toys.
Various shenanigans are possible because of the easy discoverability and exploitability of internet-connected butt plugs and the like running Bluetooth’s baby brother, Bluetooth Low Energy (BLE), a wireless personal area network technology. The tech has support for security but it’s rarely implemented in practice, as El Reg has noted before.
The shortcoming allowed boffins at Pen Test Partners to hunt for Bluetooth adult toys, a practice it dubbed screwdriving, in research that builds on its earlier investigation into Wi-Fi camera dildo hacking earlier this year.
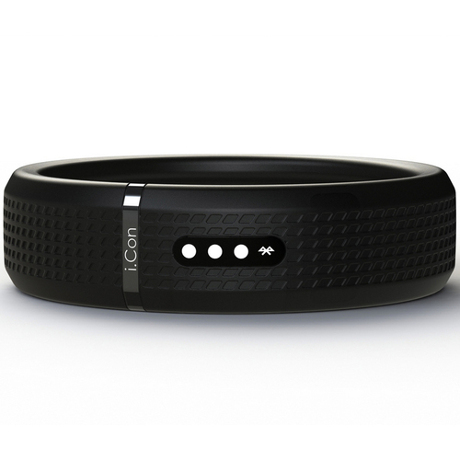
BLE devices also advertise themselves for discovery. The Lovense Hush, an IoT-enabled butt plug, calls itself LVS-Z001. Other Hush devices use the same identifier.
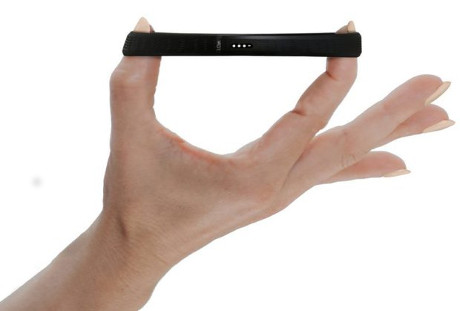
The Hush, like every other sex toy tested by PTP (the Kiiroo Fleshlight, Lelo, Lovense Nora and Max), all lacked adequate PIN or password protection. If the devices did have a PIN it was generic (0000 / 1234 etc). This omission is for understandable reasons. PTP explains: “The challenge is the lack of a UI to enter a classic Bluetooth pairing PIN. Where do you put a UI on a butt plug, after all?”
… (bold emphasis added)
Indeed, a UI for a butt plug is difficult to imagine. 
For the technical details, with more NSFW images, Alex Lomas describes the insecurity of adult toys in great detail in Screwdriving. Locating and exploiting smart adult toys.
From the post:
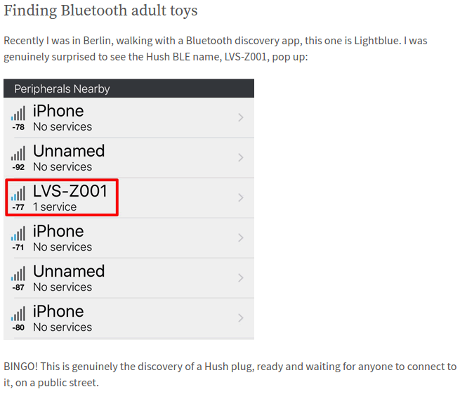
Alex is using LightBlue Explorer® — Bluetooth Low Energy (Google Play), (AppStore), although other Bluetooth discovery apps would work just as well.
Searching Congressional Offices For Newbies
If you are comfortable with Bluetooth and hex commands, you have all you need to surf for butt plugs in congressional offices.
Others, especially those who only use smart phone apps, may need some additional instructions.
At the risk of more NSFW images, the Hush butt plug homepage advises:
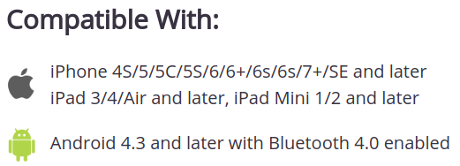
(Google Play), (AppStore),
You install the Hush app, fire it up (sorry), walk about waiting for a connection to appear. How hard is that? (Scanning tip, 360 degrees, standing, up to 30 feet; sitting, 5 to 10 feet.)
Cautions?
Unauthorized interception of even advertised signals may be a crime in some jurisdictions. Not to mention unauthorized interaction with a remote device is likely to constitute battery (a crime).
That said, the insecurity of Bluetooth devices and other cyberinsecurities are opportunities to challenge existing privilege systems. Whether you take up that challenge or choose to support the status quo, is entirely up to you.


