GIJN (Global Investigation Journalism Network) tweeted a link to Corporate misconduct – individual consequences, 14th Global Fraud Survey this morning.
From the foreword by David L. Stulb:
In the aftermath of recent major terrorist attacks and the revelations regarding widespread possible misuse of offshore jurisdictions, and in an environment where geopolitical tensions have reached levels not seen since the Cold War, governments around the world are under increased pressure to face up to the immense global challenges of terrorist financing, migration and corruption. At the same time, certain positive events, such as the agreement by the P5+1 group (China, France, Russia, the United Kingdom, the United States, plus Germany) with Iran to limit Iran’s sensitive nuclear activities are grounds for cautious optimism.
These issues contribute to volatility in financial markets. The banking sector remains under significant regulatory focus, with serious stress points remaining. Governments, meanwhile, are increasingly coordinated in their approaches to investigating misconduct, including recovering the proceeds of corruption. The reason for this is clear. Bribery and corruption continue to represent a substantial threat to sluggish global growth and fragile financial markets.
Law enforcement agencies, including the United States Department of Justice and the United States Securities and Exchange Commission, are increasingly focusing on individual misconduct when investigating impropriety. In this context, boards and executives need to be confident that their businesses comply with rapidly changing laws and regulations wherever they operate.
For this, our 14th Global Fraud Survey, EY interviewed senior executives with responsibility for tackling fraud, bribery and corruption. These individuals included chief financial officers, chief compliance officers, heads of internal audit and heads of legal departments. They are ideally placed to provide insight into the impact that fraud and corruption is having on business globally.
Despite increased regulatory activity, our research finds that boards could do significantly more to protect both themselves and their companies.
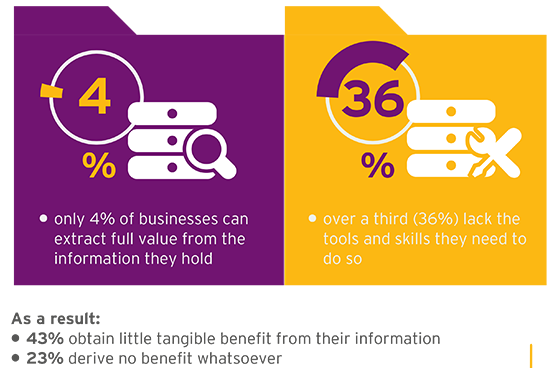
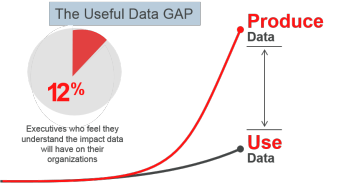
Many businesses have failed to execute anti-corruption programs to proactively mitigate their risk of corruption. Similarly, many businesses are not yet taking advantage of rich seams of information that would help them identify and mitigate fraud, bribery and corruption issues earlier.
Between October 2015 and January 2016, we interviewed 2,825 individuals from 62 countries and territories. The interviews identified trends, apparent contradictions and issues about which boards of directors should be aware.
Partners from our Fraud Investigation & Dispute Services practice subsequently supplemented the Ipsos MORI research with in-depth discussions with senior executives of multinational companies. In these interviews, we explored the executives’ experiences of operating in certain key business environments that are perceived to expose companies to higher fraud and corruption risks. Our conversations provided us with additional insights into the impact that changing legislation, levels of enforcement and cultural behaviors are having on their businesses. Our discussions also gave us the opportunity to explore pragmatic steps that leading companies have been taking to address these risks.
The executives to whom we spoke highlighted many matters that businesses must confront when operating across borders: how to adapt market-entry strategies in countries where cultural expectations of acceptable behaviors can differ; how to get behind a corporate structure to understand a third party’s true ownership; the potential negative impact that highly variable pay can have on incentives to commit fraud and how to encourage whistleblowers to speak up despite local social norms to the contrary, to highlight a few.
Our survey finds that many respondents still maintain the view that fraud, bribery and corruption are other people’s problems despite recognizing the prevalence of the issue in their own countries. There remains a worryingly high tolerance or misunderstanding of conduct that can be considered inappropriate — particularly among respondents from finance functions. While companies are typically aware of the historic risks, they are generally lagging behind on the emerging ones, for instance the potential impact of cybercrime on corporate reputation and value, while now well publicized, remains a matter of varying priority for our respondents. In this context, companies need to bolster their defenses. They should apply anti-corruption compliance programs, undertake appropriate due diligence on third parties with which they do business and encourage and support whistleblowers to come forward with confidence. Above all, with an increasing focus on the accountability of the individual, company leadership needs to set the right tone from the top. It is only by taking such steps that boards will be able to mitigate the impact should the worst happen.
This survey is intended to raise challenging questions for boards. It will, we hope, drive better conversations and ongoing dialogue with stakeholders on what are truly global issues of major importance.
We acknowledge and thank all those executives and business leaders who participated in our survey, either as respondents to Ipsos MORI or through meeting us in person, for their contributions and insights. (emphasis in original)
Apologies for the long quote but it was necessary to set the stage of the significance of:
…increasingly focusing on individual misconduct when investigating impropriety.
That policy grants a “bye” to corporations who benefit from individual mis-coduct, in favor of punishing individual actors within a corporation.
While granting the legitimacy of punishing individuals, corporations cannot act except by their agents, failing to punish corporations enables their shareholders to continue to benefit from illegal behavior.
Another point of significance, listing of countries on page 44, gives the percentage of respondents that agree “…bribery/corrupt practices happen widely…” as follows (in part):
| Rank | Country | % Agree |
| 30 | Poland | 34 |
| 31 | Russia | 34 |
| 32 | U.S. | 34 |
When the Justice Department gets hoity-toity about law and corruption, keep those figures in mind.
If the Justice Department representative you are talking to isn’t corrupt, it happens, there’s one on either side of them that probably is.
Topic maps can help ferret out or manage “corruption,” depending upon your point of view. Even structural corruption, take the U.S. political campaign donation process.