Another Word For It Patrick Durusau on Topic Maps and Semantic Diversity

January 31, 2018

GraphDBLP [“dblp computer science bibliography” as a graph]

Filed under: Computer Science,Graphs,Neo4j,Networks — Patrick Durusau @ 3:30 pm

GraphDBLP: a system for analysing networks of computer scientists through graph databases by Mario Mezzanzanica, et al.

Abstract:

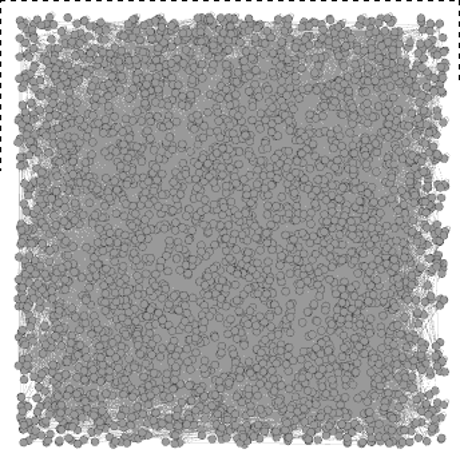
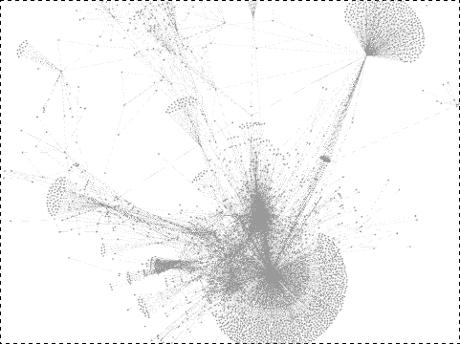
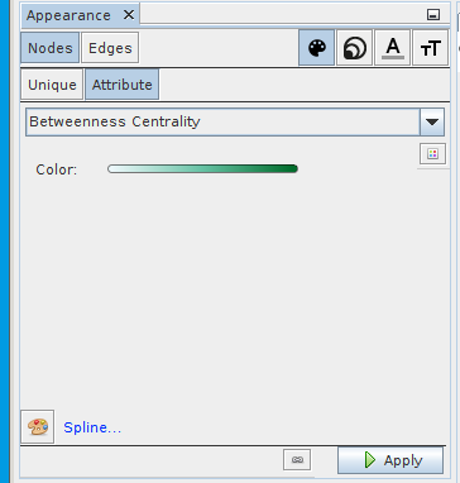
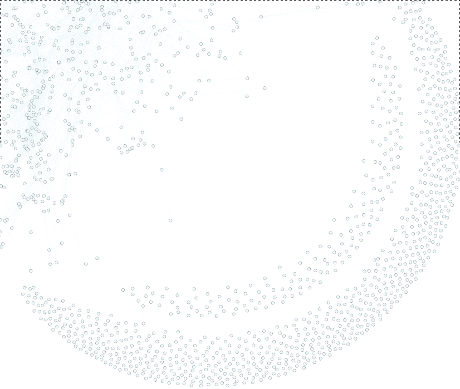
This paper presents GraphDBLP, a system that models the DBLP bibliography as a graph database for performing graph-based queries and social network analyses. GraphDBLP also enriches the DBLP data through semantic keyword similarities computed via word-embedding. In this paper, we discuss how the system was formalized as a multi-graph, and how similarity relations were identified through word2vec. We also provide three meaningful queries for exploring the DBLP community to (i) investigate author profiles by analysing their publication records; (ii) identify the most prolific authors on a given topic, and (iii) perform social network analyses over the whole community. To date, GraphDBLP contains 5+ million nodes and 24+ million relationships, enabling users to explore the DBLP data by referencing more than 3.3 million publications, 1.7 million authors, and more than 5 thousand publication venues. Through the use of word-embedding, more than 7.5 thousand keywords and related similarity values were collected. GraphDBLP was implemented on top of the Neo4j graph database. The whole dataset and the source code are publicly available to foster the improvement of GraphDBLP in the whole computer science community.

Although the article is behind a paywall, GraphDBLP as a tool is not! https://github.com/fabiomercorio/GraphDBLP.

From the webpage:

GraphDBLP is a tool that models the DBLP bibliography as a graph database for performing graph-based queries and social network analyses.

GraphDBLP also enriches the DBLP data through semantic keyword similarities computed via word-embedding.

GraphDBLP provides to users three meaningful queries for exploring the DBLP community:

  1. investigate author profiles by analysing their publication records;
  2. identify the most prolific authors on a given topic;
  3. perform social network analyses over the whole community;
  4. perform shortest-paths over DBLP (e.g., the shortest-path between authors, the analysis of co-author networks, etc.)

… (emphasis in original)

Sorry to see author, title, venue, publication, keyword all as flat strings but that’s not uncommon. Disappointing but not uncommon.

Viewing these flat strings as parts of structured representatives will be in addition to this default.

Not to minimize the importance of improving the usefulness of the dblp, but imagine integrating the GraphDBLP into your local library system. Without a massive data mapping project. That’s what lies just beyond the reach of this data project.

December 6, 2017

Paradise Papers – The Hand Job Edition – Some Small Joy

Filed under: Graphs,Neo4j,Paradise Papers — Patrick Durusau @ 11:18 am

I need to revise my assessment in Neo4j Desktop Download of Paradise Papers [It’s Not What You Hope For, Disappointment Ahead] to say it is disappointing, but does deliver a hand job version of Paradise Papers data for use in other programs.

Assuming you have made the AppImage file executable, here are the steps on Linux:

1. At the Linux command line type: ./neo4j-desktop-for-icij-1.0.0-x86_64.AppImage

2. Your initial start screen:

3. Notice the Manage Offshore Leaks Graph button:

4. The results of selecting “manage:”

5. Follow the natural progression to data/databases/graph.db and you will find, among other files:

  • neostore.labelscanstore.db (729.1 KB)
  • neostore.nodestore.db (18.1 MB)
  • neostore.propertystore.db (347.9 MB)
  • neostore.propertystore.db.strings (414.9 MB)
  • neostore.relationshipstore.db (64.6 MB TGA image)

The files are, of course, in some binary format, but that’s solved easily enough.

6. Export the data following Michael Hunger’s Export a (sub)graph to Cypher script and import it again post.

7. Load into your favorite graph tool for data exploration.

People who profit from stolen data are very sensitive to licensing issues. Neo4j released this AppImage and its contents under GNU and some parts under an Apache license.

Looking forward to the day when you and the general public can explore all of the Paradise papers, not just selected facts others have chosen for you.

December 5, 2017

Neo4j Desktop Download of Paradise Papers [It’s Not What You Hope For, Disappointment Ahead]

Filed under: Graphs,Journalism,Neo4j,News,Reporting — Patrick Durusau @ 8:52 pm

Neo4j Desktop Download of Paradise Papers

Not for the first time, Neo4j marketing raises false hopes among potential users.

When you or I read “Paradise Papers,” we quite naturally think of the reputed cache of:

…13.4 million leaked files from a combination of offshore service providers and the company registries of some of the world’s most secretive countries.

Well, you aren’t going to find those “Paradise Papers” in the Neo4j Desktop download.

What you will find is highly processed data summarized as:


Data contained in the Paradise Papers:

  • Officer: a person or company who plays a role in an offshore entity.
  • Intermediary: go-between for someone seeking an offshore corporation and an offshore service provider — usually a law-firm or a middleman that asks an offshore service provider to create an offshore firm for a client.
  • Entity: a company, trust or fund created in a low-tax, offshore jurisdiction by an agent.
  • Address: postal address as it appears in the original databases obtained by ICIJ.
  • Other: additional information items.

Make no mistake, International Consortium of Investigative Journalists (ICIJ) does vital work that isn’t being done by anyone else. For that they merit full marks. Not to mention the quality of their data mining and reporting on the data they collect.

However, their hoarding of primary source materials deprives other journalists and indeed the general public of the ability to judge the accuracy and fairness of their reporting.

Using data derived from those hoarded materials to create a teaser database such as the “Paradise Papers” distributed by Neo4j only adds insult to injury. A journalist or member of the public can learn who is mentioned but is denied access to the primary materials that would make that mention meaningful.

You can learn a lot of about Neo4j from the “Paradise Papers,” but about the people and transactions mentioned in the actual Paradise Papers, not so much.

Imagine this as a public resource for citizens and law enforcement around the world, with links back to the primary documents.

That could make a difference for the citizens of entire countries, instead of for the insiders journalists managing the access to and use of the Paradise Papers.

PS: Have you thought about how you would extract the graph data from the .AppImage file?

June 30, 2017

Neo4j 3.3.0-alpha02 (Graphs For Schemas?)

Filed under: Cypher,Graphs,Neo4j,Visualization,XML Schema — Patrick Durusau @ 10:19 am

Neo4j 3.3.0-alpha02

A bit late (release was 06/15/2017) but give Neo4j 3.3.0-alpha02 a spin over the weekend.

From the post:


Detailed Changes and Docs

For the complete list of all changes, please see the changelog. Look for 3.3 Developer manual here, and 3.3 Operations manual here.

Neo4j is one of the graph engines a friend wants to use for analysis/modeling of the ODF 1.2 schema. The traditional indented list is only one tree visualization out of the four major ones.

(From: Trees & Graphs by Nathalie Henry Riche, Microsoft Research)

Riche’s presentation covers a number of other ways to visualize trees and if you relax the “tree” requirement for display, interesting graph visualizations that may give insight into a schema design.

The slides are part of the materials for CSE512 Data Visualization (Winter 2014), so references for visualizing trees and graphs need to be updated. Check the course resources link for more visualization resources.

October 26, 2016

No Frills Gephi (8.2) Import of Clinton/Podesta Emails (1-18)

Filed under: Gephi,Graphs,Hillary Clinton,Neo4j,Networks,Politics,Visualization — Patrick Durusau @ 7:19 pm

Using Gephi 8.2, you can create graphs of the Clinton/Podesta emails based on terms in subject lines or the body of the emails. You can interactively work with all 30K+ (as of today) emails and extract networks based on terms in the posts. No programming required. (Networks based on terms will appear tomorrow.)

If you have Gephi 8.2 (I can’t find the import spigot in 9.0 or 9.1), you can import the Clinton/Podesta Emails (1-18) for analysis as a network.

To save you the trouble of regressing to Gephi 8.2, I performed a no frills/default import and exported that file as podesta-1-18-network.gephi.gz.

Download and uncompress podesta-1-18-network.gephi.gz, then you can pickup at timemark 3.49.

Open the file (your location may differ):

gephi-podesta-open-460

Obligatory hair-ball graph visualization. 😉

gephi-first-look-460

Considerably less appealing that Jennifer Golbeck’s but be patient!

First step, Layout -> Yifan Hu. My results:

yifan-hu-first-460

Second step, Network Diameter statistics (right side, run).

No visible impact on the graph but, now you can change the color and size of nodes in the graph. That is they have attributes on which you can base the assignment of color and size.

Tutorial gotcha: Not one of Jennifer’s tutorials but I was watching a Gephi tutorial that skipped the part about running statistics on the graph prior to assignment of color and size. Or I just didn’t hear it. The menu options appear in documentation but you can’t access them unless and until you run network statistics or have attributes for the assignment of color and size. Run statistics first!

Next, assign colors based on betweenness centrality:

gephi-betweenness-460

The densest node is John Podesta, but if you remove his node, rerun the network statistics and re-layout the graph, here is part of what results:

delete-central-node-460

A no frills import of 31,819 emails results in a graph of 3235 nodes and 11,831 edges.

That’s because nodes and edges combine (merge to you topic map readers) when they have the same identifier or for edges are between the same nodes.

Subject to correction, when that combining/merging occurs, the properties on the respective nodes/edges are accumulated.

Topic mappers already realize there are important subjects missing, some 31,819 of them. That is the emails themselves don’t by default appear as nodes in the network.

Ian Robinson, Jim Webber & Emil Eifrem illustrate this lossy modeling in Graph Databases this way:

graph-databases-lossy-460

Modeling emails without the emails is rather lossy. 😉

Other nodes/subjects we might want:

  • Multiple to: emails – Is who was also addressed important?
  • Multiple cc: emails – Same question as with to:.
  • Date sent as properties? So evolution of network/emails can be modeled.
  • Capture “reply-to” for relationships between emails?

Other modeling concerns?

Bear in mind that we can suppress a large amount of the detail so you can interactively explore the graph and only zoom into/display data after finding interesting patterns.

Some helpful links:

https://archive.org/details/PodestaEmailszipped: The email collection as bulk download, thanks to Michael Best, @NatSecGeek.

https://github.com/gephi/gephi/releases: Where you can grab a copy of Gephi 8.2.

May 10, 2016

Panama Papers Import Scripts for Neo4j and Docker

Filed under: Graphs,Neo4j,Panama Papers — Patrick Durusau @ 3:35 pm

Panama Papers Import Scripts for Neo4j and Docker by Michael Hunger.

Michael’s import scripts enable you too to explore and visualize, a sub-set of the Panama Papers data.

Thanks Michael!

Panama Papers Database Warning: You Will Be Tracked

Filed under: Neo4j,Panama Papers — Patrick Durusau @ 9:49 am

As promised, a teaser database of 214,000 offshore entities created in 21 jurisdictions, has been released by International Consortium of Investigative Journalists (ICIJ).

I say “teaser” because of the information you won’t find in the database:


The new data that ICIJ is now making public represents a fraction of the Panama Papers, a trove of more than 11.5 million leaked files from the Panama-based law firm Mossack Fonseca, one of the world’s top creators of hard-to-trace companies, trusts and foundations.

ICIJ is not publishing the totality of the leak, and it is not disclosing raw documents or personal information en masse. The database contains a great deal of information about company owners, proxies and intermediaries in secrecy jurisdictions, but it doesn’t disclose bank accounts, email exchanges and financial transactions contained in the documents.

In all, the interactive application reveals more than 360,000 names of people and companies behind secret offshore structures. As the data are from leaked sources and not a standardized registry, there may be some duplication of names.

Warning: Even visits to the database are being logged, as shown by this initial greeting:

panama-papers-warning-450

How deep the tracking is post-entry to the site isn’t readily evident.

I would assume all searches are logged along with the IP address of origin.

Use Tor if you plan to visit this resource.

A couple of positive comments about the database:

First, you can download the database as CSV files, a file for each type of node and the other for edges (think relationships). A release of the Neo4j data files is forthcoming.

Second, the ICIJ gets the licensing right:

The ICIJ Offshore Leaks Database is licensed under the Open Database License and its contents under Creative Commons Attribution-ShareAlike license. Always cite the International Consortium of Investigative Journalists when using this data.

Be forewarned that a lot of loose headlines will be appearing about this release, such as: The Panama Papers can now be searched online. Hardly, see the ICIJ’s own statement of exclusions above. It’s always better to read a post before commenting on it.

I don’t now nor have I ever disagreed with the statement “the > 370 reporters and the ICIJ have done a great job of reporting on the Panama Papers.”

I do disagree with the refusal of the ICIJ to release the leak contents to law enforcement under the guise of protecting the leaker and its plans to never release the full leak to the public.

As I have said before, some period of exclusive access is understandable given the investment of ICIJ in the leak but only for a reasonable period of time.

April 26, 2016

Visual Searching with Google – One Example – Neo4j – Raspberry Pi

Filed under: Graphs,Neo4j,Searching — Patrick Durusau @ 7:16 pm

Just to show I don’t spend too much time thinking of ways to gnaw on the ankles of Süddeutsche Zeitung (SZ), the hoarders of the Panama Papers, here is my experience with visual searching with Google today.

I saw this image on Twitter:

neo4j-cluster

I assumed that cutting the “clutter” from around the cluster might produce a better result. Besides, the plastic separators looked (to me) to be standard and not custom made.

Here is my cropped image for searching:

neo4j-cluster-cropped

Google responded this looks like: “water.” 😉

OK, so I tried cropping it more just to show the ports, thinking that might turn up similar port arrangements, here’s that image:

neo4j-cluster-ports

Google says: “machinery.” With a number of amusing “similar” images.

BTW, when I tried the full image, the first one, Google says: “electronics.”

OK, so much for Google image searching. What if I try?

Searching on neo4j cluster and raspberry pi (the most likely suspect), my first “hit” had this image:

1st-neo4j-hit

Same height as the search image.

My seventh “hit” has this image:

bruggen-cluster

Same height and logo as the search image. That’s Stefan Armbruster next to the cluster. (He does presentations on building the cluster, but I have yet to find a video of one of those presentations.)

My eight “hit

neo4j-8th

Common wiring color (networking cable), height.

Definitely Raspberry Pi but I wasn’t able to uncover further details.

Very interested in seeing a video of Stefan putting one of these together!

April 23, 2016

Loading the Galaxy Network of the “Cosmic Web” into Neo4j

Filed under: Astroinformatics,Graphs,Neo4j,Science — Patrick Durusau @ 6:50 pm

Loading the Galaxy Network of the “Cosmic Web” into Neo4j by Michael Hunger.

Cypher script for loading “Cosmic Web” into Neo4j.

You remember “Cosmic Web:”

cosmic-web-fll-full-visualization-kim-albrecht

Enjoy!

April 5, 2016

NSA-grade surveillance software: IBM i2 Analyst’s Notebook (Really?)

Filed under: Government,Graphs,Neo4j,NSA,Privacy,Social Networks — Patrick Durusau @ 8:20 pm

I stumbled across Revealed: Denver Police Using NSA-Grade Surveillance Software which had this description of “NSA-grade surveillance software…:”


Intelligence gathered through Analyst’s Notebook is also used in a more active way to guide decision making, including with deliberate targeting of “networks” which could include loose groupings of friends and associates, as well as more explicit social organizations such as gangs, businesses, and potentially political organizations or protest groups. The social mapping done with Analyst’s Notebook is used to select leads, targets or points of intervention for future actions by the user. According to IBM, the i2 software allows the analyst to “use integrated social network analysis capabilities to help identify key individuals and relationships within networks” and “aid the decision-making process and optimize resource utilization for operational activities in network disruption, surveillance or influencing.” Product literature also boasts that Analyst’s Notebook “includes Social Network Analysis capabilities that are designed to deliver increased comprehension of social relationships and structures within networks of interest.”

Analyst’s Notebook is also used to conduct “call chaining” (show who is talking to who) and analyze telephone metadata. A software extension called Pattern Tracer can be used for “quickly identifying potential targets”. In the same vein, the Esri Edition of Analyst’s Notebook integrates powerful geo-spatial mapping, and allows the analyst to conduct “Pattern-of-Life Analysis” against a target. A training video for Analyst’s Notebook Esri Edition demonstrates the deployment of Pattern of Life Analysis in a military setting against an example target who appears appears to be a stereotyped generic Muslim terrorism suspect:

Perhaps I’m overly immune to IBM marketing pitches but I didn’t see anything in this post that could not be done with Python, R and standard visualization techniques.

I understand that IBM markets the i2 Analyst’s Notebook (and training too) as:

…deliver[ing] timely, actionable intelligence to help identify, predict, prevent and disrupt criminal, terrorist and fraudulent activities.

to a reported tune of over 2,500 organizations worldwide.

However, you have to bear in mind the software isn’t delivering that value-add but rather the analyst plus the right data and the IBM software. That is the software is at best only one third of what is required for meaningful results.

That insight seems to have gotten lost in IBM’s marketing pitch for the i2 Analyst’s Notebook and its use by the Denver police.

But to be fair, I have included below the horizontal bar, the complete list of features for the i2 Analyst’s Notebook.

Do you see any that can’t be duplicated with standard software?

I don’t.

That’s another reason to object to the Denver Police falling into the clutches of maintenance agreements/training on software that is likely irrelevant to their day to day tasks.


IBM® i2® Analyst’s Notebook® is a visual intelligence analysis environment that can optimize the value of massive amounts of information collected by government agencies and businesses. With an intuitive and contextual design it allows analysts to quickly collate, analyze and visualize data from disparate sources while reducing the time required to discover key information in complex data. IBM i2 Analyst’s Notebook delivers timely, actionable intelligence to help identify, predict, prevent and disrupt criminal, terrorist and fraudulent activities.

i2 Analyst’s Notebook helps organizations to:

Rapidly piece together disparate data

Identify key people, events, connections and patterns

Increase understanding of the structure, hierarchy and method of operation

Simplify the communication of complex data

Capitalize on rapid deployment that delivers productivity gains quickly

Be sure to leave a comment if you see “NSA-grade” capabilities. We would all like to know what those are.

January 16, 2016

Building Web Apps Using Flask and Neo4j [O’Reilly Market Pricing For Content?]

Filed under: Flash Storage,Graphs,Marketing,Neo4j — Patrick Durusau @ 5:37 pm

Building Web Apps Using Flask and Neo4j

When I first saw this on one of my incoming feeds today I thought it might be of interest.

When I followed the link, I found an O’Reilly video, which broke out to be:

25:23 free minutes and 133:01 minutes for $59.99.

Rounding down that works out to about $30/hour for the video.

When you compare that to other links I saw today:

What is the value proposition that sets the price on an O’Reilly video?

So far as I can tell, pricing for content on the Internet is similar the pricing of seats on airlines.

Pricing for airline seats is beyond “arbitrary” or “capricious.” More akin to “absurd” and/or “whatever a credulous buyer will pay.”

Speculations on possible pricing models O’Reilly is using?

Suggestions on a viable pricing model for content?

October 17, 2015

Congressional PageRank… [How To Avoid Bribery Charges]

Filed under: Graphs,GraphX,Neo4j,PageRank,Spark — Patrick Durusau @ 3:25 pm

Congressional PageRank – Analyzing US Congress With Neo4j and Apache Spark by William Lyon.

From the post:

As we saw previously, legis-graph is an open source software project that imports US Congressional data from Govtrack into the Neo4j graph database. This post shows how we can apply graph analytics to US Congressional data to find influential legislators in Congress. Using the Mazerunner open source graph analytics project we are able to use Apache Spark GraphX alongside Neo4j to run the PageRank algorithm on a collaboration graph of US Congress.

While Neo4j is a powerful graph database that allows for efficient OLTP queries and graph traversals using the Cypher query language, it is not optimized for global graph algorithms, such as PageRank. Apache Spark is a distributed in-memory large-scale data processing engine with a graph processing framework called GraphX. GraphX with Apache Spark is very efficient at performing global graph operations, like the PageRank algorithm. By using Spark alongside Neo4j we can enhance our analysis of US Congress using legis-graph.

Excellent walk-through to get you started on analyzing influence in congress, with modern data analysis tools. Getting a good grip on all these tools with be valuable.

Political scientists, among others, have studied the question of influence in Congress for decades so if you don’t want to repeat the results of others, being by consulting the American Political Science Review for prior work in this area.

An article that reports counter-intuitive results is: The Influence of Campaign Contributions on the Legislative Process by Lynda W. Powell.

From the introduction:

Do campaign donors gain disproportionate influence in the legislative process? Perhaps surprisingly, political scientists have struggled to answer this question. Much of the research has not identified an effect of contributions on policy; some political scientists have concluded that money does not matter; and this bottom line has been picked up by reporters and public intellectuals.1 It is essential to answer this question correctly because the result is of great normative importance in a democracy.

It is important to understand why so many studies find no causal link between contributions and policy outcomes. (emphasis added)

Linda cites much of the existing work on the influence of donations on process so her work makes a great starting point for further research.

As far as the lack of a “casual link between contributions and policy outcomes,” I think the answer is far simpler than Linda suspects.

The existence of a quid-pro-quo, the exchange of value for a vote on a particular bill, is the essence of the crime of public bribery. For the details (in the United States), see: 18 U.S. Code § 201 – Bribery of public officials and witnesses

What isn’t public bribery is to donate funds to an office holder on a regular basis, unrelated to any particular vote or act on the part of that official. Think of it as bribery on an installment plan.

When U.S. officials, such as former Secretary of State Hillary Clinton complain of corruption in other governments, they are criticizing quid-pro-quo bribery and not installment plan bribery as it is practiced in the United States.

Regular contributions gains ready access to legislators and, not surprisingly, more votes will go in your favor than random chance would allow.

Regular contributions are more expensive than direct bribes but avoiding the “causal link” is essential for all involved.

October 15, 2015

CyGraph: Cybersecurity Situational Awareness…

Filed under: Cybersecurity,Graphs,Neo4j,Security — Patrick Durusau @ 4:06 pm

CyGraph: Cybersecurity Situational Awareness That’s More Scalable, Flexible & Comprehensive by Steven Noel. (MITRE Corporation, if you can’t tell from the title.)

From the post:

Preventing and reacting to attacks in cyberspace involves a complex and rapidly changing milieu of factors, requiring a flexible architecture for advanced analytics, queries and graph visualization.

Information Overload in Security Analytics

Cyber warfare is conducted in complex environments, with numerous factors contributing to attack success and mission impacts. Network topology, host configurations, vulnerabilities, firewall settings, intrusion detection systems, mission dependencies and many other elements all play important parts.

To go beyond rudimentary assessments of security posture and attack response, organizations need to merge isolated data into higher-level knowledge of network-wide attack vulnerability and mission readiness in the face of cyber threats.

Network environments are always changing, with machines added and removed, patches applied, applications installed, firewall rules changed, etc., all with potential impact on security posture. Intrusion alerts and anti-virus warnings need attention, and even seemingly benign events such as logins, service connections and file share accesses could be associated with adversary activity.

The problem is not lack of information, but rather the ability to assemble disparate pieces of information into an overall analytic picture for situational awareness, optimal courses of action and maintaining mission readiness.

CyGraph: Turning Cybersecurity Information into Knowledge

To address these challenges, researchers at the MITRE Corporation are developing CyGraph, a tool for cyber warfare analytics, visualization and knowledge management.

Graph databases, Neo4j being one of many, can be very useful in managing complex security data.

However, as I mentioned earlier today, one of the primary issues in cybersecurity is patch management, with a full 76% of applications remaining unpatched more than two years after vulnerabilities have been discovered. (Yet Another Flash Advisory (YAFA) [Patch Due 19 October 2015])

If you haven’t taken basic steps on an issue like patch management, as in evaluating and installing patches in a timely manner, a rush to get the latest information is mis-placed.

Just in case you are wondering, if you do visit MITRE Corporation, you will find that a search for “CyGraph” comes up empty. Must not be quite to the product stage just yet.

Watch for name conflicts:

and others of course.

October 14, 2015

Neo4j 2.3 RC1 is out!

Filed under: Graphs,Neo4j — Patrick Durusau @ 8:57 pm

I saw a tweet from Michael Hunger saying Neo4j 2.3 RC1 is out.

For development only – check here.

Comment early and often!

October 9, 2015

Using Graph Structure Record Linkage on Irish Census

Filed under: Census Data,Graphs,Neo4j — Patrick Durusau @ 8:26 pm

Using Graph Structure Record Linkage on Irish Census Data with Neo4j by Brian Underwood.

From the post:

For just over a year I’ve been obsessed on-and-off with a project ever since I stayed in the town of Skibbereen, Ireland. Taking data from the 1901 and 1911 Irish censuses, I hoped I would be able to find a way to reliably link resident records from the two together to identify the same residents.

Since then I’ve learned a bit about master data management and record linkage and so I thought I would give it another stab.

Here I’d like to talk about how I’ve been matching records based on the local data space around objects to improve my record linkage scoring.

An interesting issue that has currency with intelligence agencies slurping up digital debris at every opportunity. So you have trillions of records. Which ones have you been able to reliably match up?

From a topic map perspective, I could not help but notice that in the 1901 census, the categories for Marriage were:

  • Married
  • Widower
  • Widow
  • Not Married

Whereas the 1911 census records:

  • Married
  • Widower
  • Widow
  • Single

As you know, one of the steps in record linkage is normalization of the data headings and values before you apply the standard techniques to link records together.

In traditional record linkage, the shift from “not married” to “single” is lost in the normalization.

May not be meaningful for your use case but could be important for someone studying shifts in marital relationship language. Or shifts in religious, ethnic, or racist language.

Or for that matter, shifts in the names of database column headers and/or tables. (Like anyone thinks those are stable.)

Pay close attention to how Brian models similarity candidates.

Once you move beyond string equivalent identifiers (TMDM), you are going to be facing the same issues.

September 30, 2015

Tracking Congressional Whores

Filed under: Government,Graphs,Neo4j — Patrick Durusau @ 2:06 pm

Introducing legis-graph – US Congressional Data With Govtrack and Neo4j by William Lyon.

From the post:

Interactions among members of any large organization are naturally a graph, yet the tools we use to collect and analyze data about these organizations often ignore the graphiness of the data and instead map the data into structures (such as relational databases) that make taking advantage of the relationships in the data much more difficult when it comes time to analyze the data. Collaboration networks are a perfect example. So let’s focus on one of the most powerful collaboration networks in the world: the US Congress.

Introducing legis-graph: US Congress in a graph

The goal of legis-graph is to provide a way of converting the data provided by Govtrack into a rich property-graph model that can be inserted into Neo4j for analysis or integrating with other datasets.

The code and instructions are available in this Github repo. The ETL workflow works like this:

  1. A shell script is used to rsync data from Govtrack for a specific Congress (i.e. the 114th Congress). The Govtrack data is a mix of JSON, CSV, and YAML files. It includes information about legislators, committees, votes, bills, and much more.
  2. To extract the pieces of data we are interested in for legis-graph a series of Python scripts are used to extract and transform the data from different formats into a series of flat CSV files.
  3. The third component is a series of Cypher statements that make use of LOAD CSV to efficiently import this data into Neo4j.

To get started with legis-graph in Neo4j you can follow the instructions here. Alternatively, a Neo4j data store dump is available here for use without having to execute the import scripts. We are currently working to streamline the ETL process so this may change in the future, but any updates will be appear in the Github README.

This project began during preparation for a graph database focused Meetup presentation. George Lesica and I wanted to provide an interesting dataset in Neo4j for new users to explore.

Whenever the U.S. Congress is mentioned, I am reminded of the Obi-Wan Kenobi’s line about Mos Eisley:

You will never find a more wretched hive of scum and villainy. We must be cautious.

The data model for William’s graph:

lgdatamodel

As you can see from the diagram above, the datamodel is rich and captures quite a bit of information about the actions of legislators, committees, and bills in Congress. Information about what properties are currently included is available here.

A great starting place that can be extended and enriched.

In terms of the data model, note that “subject” is now the title of a bill. Definitely could use some enrichment there.

Another association for the bill, “who_benefits.”

If you are really ambitious, try developing information on what individuals or groups make donations to the legislator on an annual basis.

To clear noise out of the data set, drop everyone who doesn’t contribute annually and even then, any total less than $5,000. Remember that members of congress depend on regular infusions of cash so erratic or one-time donors may get a holiday card but they are not on the ready access list.

The need for annual cash is one reason why episodic movements may make the news but they rarely make a difference. To make a difference requires years of steady funding and grooming of members of congress and improving your access, plus your influence.

Don’t be disappointed if you can “prove” member of congress X is in the pocket of Y or Z organization/corporation and nothing happens. More likely than not, such proof will increase their credibility for fund raising.

As Leonard Cohen says (Everybody Knows):

Everybody knows the dice are loaded, Everybody rolls with their fingers crossed

September 28, 2015

Neo4j 2.3.0 Milestone 3 Release

Filed under: Graphs,Neo4j — Patrick Durusau @ 7:55 pm

Neo4j 2.3.0 Milestone 3 Release by Andreas Kollegger.

From the post:

Great news for all those Neo4j alpha-developers out there: The third (and final) milestone release of Neo4j 2.3 is now ready for download! Get your copy of Neo4j 2.3.0-M03 here.

Quick clarification: Milestone releases like this one are for development and experimentation only, and not all features are in their finalized form. Click here for the most fully stable version of Neo4j (2.2.5).

So, what cool new features made it into this milestone release of Neo4j? Let’s dive in.

If you want to “kick the tires” on Neo4j 2.3.0 before the production version arrives, now would be a good time.

Andreas covers new features in Neo4j 2.3.0, such as triadic selection, constraints, deletes and others.

As I read Andreas’ explanation of “triadic selection” and its role in recommendations, I started to wonder how effective recommendations are outside of movies, books, fast food, etc.

The longer I thought about it, the harder I was pressed to come up with a buying decision that isn’t influenced by recommendations, either explicit or implicit.

Can a “rational” market exist if we are all more or less like lemmings when it comes to purchasing (and other) decisions?

You don’t have to decide that question to take Neo4j 2.3.0 for a spin.

September 24, 2015

Guesstimating the Future

Filed under: Cypher,Graphs,Neo4j — Patrick Durusau @ 7:07 pm

I ran across some introductory slides on Neo4j with the line:

Forrester estimates that over 25% of enterprises will be using graph databases by 2017.

Well, Forrester also predicted that tablet sales would over take laptops sales in 2015: Forrester: Tablet Sales Will Eclipse Laptop Sales by 2015.

You might want to check that prediction against: Laptop sales ‘stronger than ever’ versus tablets – PCR Retail Advisory Board.

The adage “It is difficult to make predictions, especially about the future.,” remains appropriate.

Neo4j doesn’t need lemming-like behavior among consumers of technology to make a case for itself.

Compare Neo4j and its query language, Cypher, to your use cases and I think you will agree.

September 1, 2015

Sturctr Restructuring

Filed under: Graphs,Neo4j,structr — Patrick Durusau @ 7:46 pm

Over several recent tweets I have seen that Structr is restructuring its websites to better separate structr.com (commercial) from structr.org (open source) communities.

The upcoming structr release is 2.0 and is set for just before @GraphConnect (Oct. 21, 2015). Another tweet says there are lots of new features, full-text file and URL indexing, SSH/SCP support, a new Files UI etc.)

That makes October seem further away that it was just moments ago. 😉

August 26, 2015

Spreadsheets are graphs too!

Filed under: Cypher,Neo4j,Spreadsheets,SQL — Patrick Durusau @ 8:25 pm

Spreadsheets are graphs too! by Felienne Hermans.

Presentation with transcript.

Felienne starts with a great spreadsheet story:

When I was in grad school, I worked with an investment bank doing spreadsheet research. On my first day, I went to the head of the Excel team.

I said, ‘Hello, can I have a list of all your spreadsheets?’

There was no such thing.

‘We don’t have a list of all the spreadsheets,’ he said. ‘You could ask Frank in Accounting or maybe Harry over at Finance. He’s always talking about spreadsheets. I don’t really know, but I think we might have 10,000 spreadsheets.’

10,000 spreadsheets was a gold mine of research, so I went to the IT department and conducted my first spreadsheet scan with root access in Windows Explorer.

Within one second, it had already found 10,000 spreadsheets. Within an hour, it was still finding more, with over one million Excel files located. Eventually, we found 2.5 million spreadsheets.

In short, spreadsheets run the world.

She continues to outline spreadsheet horror stories and then demonstrates how complex relationships between cells can be captured by Neo4j.

Which are much easier to query with Cypher than SQL!

While I applaud:


I realized that spreadsheet information is actually very graphy. All the cells are connected to references to each other and they happen to be in a worksheet or on the spreadsheet, but that’s not really what matters. What matters is the connections.

I would be more concerned with the identity of the subjects between which connections have been made.

Think of it as documenting the column headers from a five year old spreadsheet, that you are now using by rote.

Knowing the connections between cells is a big step forward. Knowing what the cells are supposed to represent is an even bigger one.

June 15, 2015

Neo4j 2.3.0 Milestone 2 Release

Filed under: Graphs,Neo4j — Patrick Durusau @ 4:32 pm

Neo4j 2.3.0 Milestone 2 Release by Michael Hunger.

New features (not all operational) include:

  • Highly Scalable Off-Heap Graph Cache
  • Mac Installer
  • Cypher Cost-Based Optimizer Improvements
  • Compiled Runtime
  • UX Improvements

And the important information:

Download: http://neo4j.com/download/#milestone

Documentation: http://neo4j.com/docs/milestone/

Cypher Reference Card: http://neo4j.com/docs/milestone/cypher-refcard

Feedback please to: feedback@neotechnology.com

GitHub: http://github.com/neo4j/neo4j/issues

Enjoy!

June 9, 2015

SciGraph

Filed under: Graphs,Neo4j,Ontology — Patrick Durusau @ 5:41 pm

SciGraph

From the webpage:

SciGraph aims to represent ontologies and data described using ontologies as a Neo4j graph. SciGraph reads ontologies with owlapi and ingests ontology formats available to owlapi (OWL, RDF, OBO, TTL, etc). Have a look at how SciGraph translates some simple ontologies.

Goals:

  • OWL 2 Support
  • Provide a simple, usable, Neo4j representation
  • Efficient, parallel ontology ingestion
  • Provide basic “vocabulary” support
  • Stay domain agnostic

Non-goals:

  • Create ontologies based on the graph
  • Reasoning support

Some applications of SciGraph:

  • the Monarch Initiative uses SciGraph for both ontologies and biological data modeling [repaired link] [Monarch enables navigation across a rich landscape of phenotypes, diseases, models, and genes for translational research.]
  • SciCrunch uses SciGraph for vocabulary and annotation services [biomedical but also has US patents?]
  • CINERGI uses SciGraph for vocabulary and annotation services [Community Inventory of EarthCube Resources for Geosciences Interoperability, looks very ripe for a topic map discussion]

If you are interested in representation, modeling or data integration with ontologies, you definitely need to take a look at SciGraph.

Enjoy!

May 28, 2015

Content Recommendation From Links Shared on Twitter Using Neo4j and Python

Filed under: Cypher,Graphs,Neo4j,Python,Twitter — Patrick Durusau @ 4:50 pm

Content Recommendation From Links Shared on Twitter Using Neo4j and Python by William Lyon.

From the post:

Overview

I’ve spent some time thinking about generating personalized recommendations for articles since I began working on an iOS reading companion for the Pinboard.in bookmarking service. One of the features I want to provide is a feed of recommended articles for my users based on articles they’ve saved and read. In this tutorial we will look at how to implement a similar feature: how to recommend articles for users based on articles they’ve shared on Twitter.

Tools

The main tools we will use are Python and Neo4j, a graph database. We will use Python for fetching the data from Twitter, extracting keywords from the articles shared and for inserting the data into Neo4j. To find recommendations we will use Cypher, the Neo4j query language.

Very clear and complete!

Enjoy!

April 24, 2015

jQAssistant 1.0.0 released

Filed under: Neo4j,Programming,Software,Software Engineering — Patrick Durusau @ 2:25 pm

jQAssistant 1.0.0 released by Dirk Mahler.

From the webpage:

We’re proud to announce the availability of jQAssistant 1.0.0 – lots of thanks go to all the people who made this possible with their ideas, criticism and code contributions!

Feature Overview

  • Static code analysis tool using the graph database Neo4j
  • Scanning of software related structures, e.g. Java artifacts (JAR, WAR, EAR files), Maven descriptors, XML files, relational database schemas, etc.
  • Allows definition of rules and automated verification during a build process
  • Rules are expressed as Cypher queries or scripts (e.g. JavaScript, Groovy or JRuby)
  • Available as Maven plugin or CLI (command line interface)
  • Highly extensible by plugins for scanners, rules and reports
  • Integration with SonarQube
  • It’s free and Open Source

Example Use Cases

  • Analysis of existing code structures and matching with proposed architecture and design concepts
  • Impact analysis, e.g. which test is affected by potential code changes
  • Visualization of architectural concepts, e.g. modules, layers and their dependencies
  • Continuous verification and reporting of constraint violations to provide fast feedback to developers
  • Individual gathering and filtering of metrics, e.g. complexity per component
  • Post-Processing of reports of other QA tools to enable refactorings in brown field projects
  • and much more…

Get it!

jQAssistant is available as a command line client from the downloadable distribution

jqassistant.sh scan -f my-application.war
jqassistant.sh analyze
jqassistant.sh server

or as Maven plugin:

<dependency>
    <groupId>com.buschmais.jqassistant.scm</groupId>
    <artifactId>jqassistant-maven-plugin</artifactId>
    <version>1.0.0</version>
</dependency>

For a list of latest changes refer to the release notes, the documentation provides usage information.

Those who are impatient should go for the Get Started page which provides information about the first steps about scanning applications and running analysis.

Your Feedback Matters

Every kind of feedback helps to improve jQAssistant: feature requests, bug reports and even questions about how to solve specific problems. You can choose between several channels – just pick your preferred one: the discussion group, stackoverflow, a Gitter channel, the issue tracker, e-mail or just leave a comment below.

Workshops

You want to get started quickly for an inventory of an existing Java application architecture? Or you’re interested in setting up a continuous QA process that verifies your architectural concepts and provides graphical reports?
The team of buschmais GbR offers individual workshops for you! For getting more information and setting up an agenda refer to http://jqassistant.de (German) or just contact us via e-mail!

Short of wide spread censorship, in order for security breaches to fade from the news spotlight, software quality/security must improve.

jQAssistant 1.0.0 is one example of the type of tool required for software quality/security to improve.

Of particular interest is its use of Neo4j, enables having named relationships of materials to your code.

I don’t mean to foster the “…everything is a graph…” any more than I would foster “…everything is a set of relational tables…” or “…everything is a key/value pair…,” etc. Yes, but the question is: “What is the best way, given my requirements and constraints to achieve objective X?” Whether relationships are explicit, if so, what can I say about them?, or implicit, depends on my requirements, not those of a vendor.

In the case of recording who wrote the most buffer overflows and where, plus other flaws, tracking named relationships and similar information should be part of your requirements and graphs are a good way to meet that requirement.

April 14, 2015

Attribute-Based Access Control with a graph database [Topic Maps at NIST?]

Filed under: Cybersecurity,Graphs,Neo4j,NIST,Security,Subject Identity,Topic Maps — Patrick Durusau @ 3:25 pm

Attribute-Based Access Control with a graph database by Robin Bramley.

From the post:

Traditional access control relies on the identity of a user, their role or their group memberships. This can become awkward to manage, particularly when other factors such as time of day, or network location come into play. These additional factors, or attributes, require a different approach, the US National Institute of Standards and Technology (NIST) have published a draft special paper (NIST 800-162) on Attribute-Based Access Control (ABAC).

This post, and the accompanying Graph Gist, explore the suitability of using a graph database to support policy decisions.

Before we dive into the detail, it’s probably worth mentioning that I saw the recent GraphGist on Entitlements and Access Control Management and that reminded me to publish my Attribute-Based Access Control GraphGist that I’d written some time ago, originally in a local instance having followed Stefan Armbruster’s post about using Docker for that very purpose.

Using a Property Graph, we can model attributes using relationships and/or properties. Fine-grained relationships without qualifier properties make patterns easier to spot in visualisations and are more performant. For the example provided in the gist, the attributes are defined using solely fine-grained relationships.

Graph visualization (and querying) of attribute-based access control.

I found this portion of the NIST draft particularly interesting:


There are characteristics or attributes of a subject such as name, date of birth, home address, training record, and job function that may, either individually or when combined, comprise a unique identity that distinguishes that person from all others. These characteristics are often called subject attributes. The term subject attributes is used consistently throughout this document.

In the course of a person’s life, he or she may work for different organizations, may act in different roles, and may inherit different privileges tied to those roles. The person may establish different personas for each organization or role and amass different attributes related to each persona. For example, an individual may work for Company A as a gate guard during the week and may work for Company B as a shift manager on the weekend. The subject attributes are different for each persona. Although trained and qualified as a Gate Guard for Company A, while operating in her Company B persona as a shift manager on the weekend she does not have the authority to perform as a Gate Guard for Company B.
…(emphasis in the original)

Clearly NIST recognizes that subjects, at least in the sense of people, are identified by a set of “subject attributes” that uniquely identify that subject. It doesn’t seem like much of a leap to recognize that for other subjects, including the attributes used to identify subjects.

I don’t know what other US government agencies have similar language but it sounds like a starting point for a robust discussion of topic maps and their advantages.

Yes?

Importing the Hacker News Interest Graph

Filed under: Graphs,Neo4j — Patrick Durusau @ 6:58 am

Importing the Hacker News Interest Graph by Max De Marzi.

From the post:

Graphs are everywhere. Think about the computer networks that allow you to read this sentence, the road or train networks that get you to work, the social network that surrounds you and the interest graph that holds your attention. Everywhere you look, graphs. If you manage to look somewhere and you don’t see a graph, then you may be looking at an opportunity to build one. Today we are going to do just that. We are going to make use of the new Neo4j Import tool to build a graph of the things that interest Hacker News.

The basic premise of Hacker News is that people post a link to a Story, people read it, and comment on what they read and the comments of other people. We could try to extract a Social Graph of people who interact with each other, but that wouldn’t be super helpful. Want to know the latest comment Patio11 made? You’ll have to find their profile and the threads they participated in. Unlike Facebook, Twitter or other social networks, Hacker News is an open forum.

A good starting point if you want to build a graph of Hacker News.

Enjoy!

March 31, 2015

Graph Resources for Neo4j

Filed under: Graphs,Neo4j — Patrick Durusau @ 8:43 am

GitHub – GraphAware

A small sampling of what you will find at GraphAware’s GitHub page:

GithubNeo4j – Demo Application importing User Github Public Events into Neo4j.

neo4j-timetree – Java and REST APIs for working with time-representing tree in Neo4j.

neo4j-changefeed – A GraphAware Framework Runtime Module allowing users to find out what were the latest changes performed on the graph.

Others await your discovery at: GitHub – GraphAware

Enjoy!

I first saw this in a tweet by Jeremy Deane.

March 19, 2015

Detecting potential typos using EXPLAIN

Filed under: Cypher,Graphs,Neo4j — Patrick Durusau @ 7:10 pm

Detecting potential typos using EXPLAIN by Mark Needham.

Mark illustrates use of EXPLAIN (in Neo4j 2.2.0 RC1) to detect typos (not potential, actual typos) to debug a query.

Now if I could just find a way to incorporate EXPLAIN into documentation prose.

PS: I say that in jest but using a graph model, it should be possible to create a path through documentation that highlights the context of a particular point in the documentation. Trivial example: I find “setting margin size” but don’t know how that relates to menus in an application. “Explain” in that context displays a graph with the nodes necessary to guide me to other parts of the documentation. Each of those nodes might have additional information at each of their “contexts.”

March 11, 2015

Getting Started with Apache Spark and Neo4j Using Docker Compose

Filed under: Graphs,Neo4j,Spark — Patrick Durusau @ 4:08 pm

Getting Started with Apache Spark and Neo4j Using Docker Compose by Kenny Bastani.

From the post:

I’ve received a lot of interest since announcing Neo4j Mazerunner. People from around the world have reached out to me and are excited about the possibilities of using Apache Spark and Neo4j together. From authors who are writing new books about big data to PhD researchers who need it to solve the world’s most challenging problems.

I’m glad to see such a wide range of needs for a simple integration like this. Spark and Neo4j are two great open source projects that are focusing on doing one thing very well. Integrating both products together makes for an awesome result.

Less is always more, simpler is always better.

Both Apache Spark and Neo4j are two tremendously useful tools. I’ve seen how both of these two tools give their users a way to transform problems that start out both large and complex into problems that become simpler and easier to solve. That’s what the companies behind these platforms are getting at. They are two sides of the same coin.

One tool solves for scaling the size, complexity, and retrieval of data, while the other is solving for the complexity of processing the enormity of data by distributed computation at scale. Both of these products are achieving this without sacrificing ease of use.

Inspired by this, I’ve been working to make the integration in Neo4j Mazerunner easier to install and deploy. I believe I’ve taken a step forward in this and I’m excited to announce it in this blog post.

….

Now for something a bit more esoteric than CSV. 😉

This guide will get you into Docker land as well.

Please share and forward.

Enjoy!

March 8, 2015

How to Use R for Connecting Neo4j and Tableau (A Recommendation Use Case)

Filed under: Neo4j,R,Tableau — Patrick Durusau @ 5:57 pm

How to Use R for Connecting Neo4j and Tableau (A Recommendation Use Case) by Roberto Rösler.

From the post:

Year is just a little bit more than two months old and we got the good news from Tableau – beta testing for version 9.0 started. But it looks like that one of my most favored features didn’t manage to be part of the first release – the Tableau Web Data Connector (it’s mentioned in Christian Chabot keynote at 01:18:00 you can find here). The connector can be used to access REST APIs from within Tableau.
Instead of waiting for the unknown release containing the Web Data Connector, I will show in this post how you can still use the current version of Tableau together with R to build your own “Web Data Connector”. Specifically, this means we connect to an instance of the graph database Neo4j using Neo4js REST API. However, that is not the only good news: our approach that will create a life connection to the “REST API data source” goes beyond any attempt that utilizes Tableaus Data Extract API, static tde files that could be loaded in Tableau.

In case you aren’t familiar with Tableau, it is business analytics/visualization software that has both commercial and public versions.

Roberto moves data crunching off of Tableau (into Neo4j) and builds a dashboard (playing to Tableau’s strengths) for display of the results.

If you don’t have the time to follow R-Bloggers, you should make the time to follow Roberto’s blog, Data * Science + R. His posts explore interesting issues at length, with data and code.

I first saw this in a tweet by DataSciGeek.

Older Posts »

Powered by WordPress