Another Word For It Patrick Durusau on Topic Maps and Semantic Diversity

February 9, 2017

Fast and Flexible Query Analysis at MapD with Apache Calcite [Merging Data?]

Filed under: Apache Calcite,MapD,Query Rewriting,SQL — Patrick Durusau @ 8:30 pm

Fast and Flexible Query Analysis at MapD with Apache Calcite by Alex Şuhan.

From the post:

After evaluating a few other options, we decided for Apache Calcite, an incubation stage project at the time. It takes SQL queries and generates extended relational algebra, using a highly configurable cost-based optimizer. Several projects use Calcite already for SQL parsing and query optimization.

One of the main strengths of Calcite is its highly modular structure, which allows for multiple integration points and creative uses. It offers a relational algebra builder, which makes moving to a different SQL parser (or adding a non-SQL frontend) feasible.

In our product, we need runtime functions which are not recognized by Calcite by default. For example, trigonometric functions are necessary for on-the-fly geo projections used for point map rendering. Fortunately, Calcite allows specifying such functions and they become first-class citizens, with proper type checking in place.

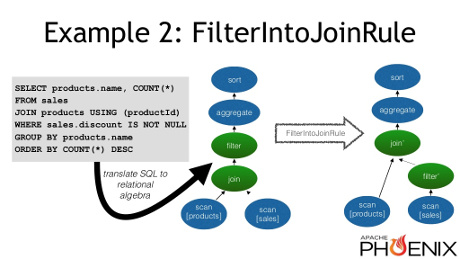
Calcite also includes a highly capable and flexible cost-based optimizer, which can apply high-level transformations to the relational algebra based on query patterns and statistics. For example, it can push part of a filter through a join in order to reduce the size of the input, like the following figure shows:

join_filter_pushdown-460

You can find this example and more about the cost-based optimizer in Calcite in this presentation on using it in the Apache Phoenix project. Such optimizations complement the low-level optimizations we do ourselves to achieve great speed improvements.

Relational algebra example
Let’s take a simple query: SELECT A.x, COUNT(*) FROM test JOIN B ON A.x = B.x WHERE A.y > 41 GROUP BY A.x; and analyze the relational algebra generated for it.

In Calcite relational algebra, there are a few main node types, corresponding to the theoretical extended relational algebra model: Scan, Filter, Project, Aggregate and Join. Each type of node, except Scan, has one or more (in the case of Join) inputs and its output can become the input of another node. The graph of nodes connected by data flow relationships is a
directed acyclic graph (abbreviated as “DAG”). For our query, Calcite outputs the following DAG:

DAG

The Scan nodes have no inputs and output all the rows and the columns in tables A and B, respectively. The Join node specifies the join condition (in our case A.x = B.x) and its output contains the columns in A and B concatenated. The Filter node only allows the rows which pass the specified condition and its output preserves all columns of input. The Project node only preserves the specified expressions as columns in the output. Finally, the Aggregate specifies the group by expressions and aggregates.

The physical implementation of the nodes is up to the system using Calcite as a frontend. Nothing in the Join node mandates a certain implementation of the join operation (equijoin in our case). Indeed, using a condition which can’t be implemented as a hash join, like A.x < B.x, would only be reflected by the condition in the Filter node.

You’re not MapD today but that’s no excuse for poor query performance.

Besides, learning Apache Calcite will increase your attractiveness as data and queries on it become more complex.

I haven’t read all the documentation but the “metadata” in Apache Calcite is as flat as any you will find.

Which means integration of different data sources is either luck of the draw or you asked someone the “meaning” of the metadata.

The tutorial has this example:

calcite-460

The column header “GENDER” for example appears to presume the common male/female distinction. But without further exploration of the data set, there could be other genders encoded in that field as well.

If “GENDER” seems too easy, what would you say about “NAME,” bearing in mind that Japanese family names are written first and given names written second. How would those appear under “NAME?”

Apologies! My screen shot missed field “S.”

I have utterly no idea what “S” may or may not represent as a field header. Do you?

If the obviousness of field headers fails with “GENDER” and “NAME,” what do you suspect will happen with less “obvious” field headers?

How successful will merging of data be?

Where would you add subject identity information and how would you associate it with data processed by Apache Calcite?

November 7, 2016

Election for Sale

Filed under: Government,MapD,Mapping,Politics — Patrick Durusau @ 8:23 pm

Election for Sale by Keir Clarke.

mapsmania2-460

MapD’s US Political Donations map allows you to explore the donations made to the Democratic and Republican parties dating back to 2001. The map includes a number of tools which allow you to filter the map by political party, by recipient and by date.

After filtering the map by party and date you can explore details of the donations received using the markers on the map. If you select the colored markers on the map you can view details on the amount of the donation, the name of the recipient & recipient’s party and the name of the donor. It is also possible to share a link to your personally filtered map.

The MapD blog has used the map to pick out a number of interesting stories that emerge from the map. These stories include an analysis of the types of donations received by both Hilary Clinton and Donald Trump.

An appropriate story for November 7th, the day prior to the U.S. Government sale day, November 8th.

It’s a great map but that isn’t to say it could not be enhanced by merging in other data.

While everyone acknowledges donations, especially small ones, are made for a variety of reasons, consistent and larger donations are made with an expectation of something in return.

One feature this map is missing is what did consistent and larger donors get in return?

Harder to produce and maintain than a map based on public campaign donation records but far more valuable to the voting public.

Imagine that level of transparency for the tawdry story of Hillary Clinton and Big Oil. How Hillary Clinton’s State Department Fought For Oil 5,000 Miles Away.

Apparent Browser Incompatibility: The MapD map loads fine with Firefox (49.0.2) but crashes with Chrome (Version 54.0.2840.90 (64-bit)) (Failed to load dashboard. TypeError: Cannot read property ‘resize’ of undefined). Both on Ubuntu 14.04.

September 30, 2016

Going My Way? – Explore 1.2 billion taxi rides

Filed under: MapD,Maps,Visualization — Patrick Durusau @ 8:20 pm

Explore 1.2 billion taxi rides by Hannah Judge.

From the post:

Last year the New York City Taxi and Limousine Commission released a massive dataset of pickup and dropoff locations, times, payment types, and other attributes for 1.2 billion trips between 2009 and 2015. The dataset is a model for municipal open data, a tool for transportation planners, and a benchmark for database and visualization platforms looking to test their mettle.

MapD, a GPU-powered database that uses Mapbox for its visualization layer, made it possible to quickly and easily interact with the data. Mapbox enables MapD to display the entire results set on an interactive map. That map powers MapD’s dynamic dashboard, updating the data as you zoom and pan across New York.

Very impressive demonstration of the capabilities of MapD!

Imagine how you can visualize data from your hundreds of users geo-spotting security forces with their smartphones.

Or visualizing data from security forces tracking your citizens.

Technology cuts both ways.

The question is whether the sharper technology sword is going to be in your hands or those of your opponents?

February 6, 2014

Map-D: A GPU Database…

Filed under: GPU,MapD,NVIDIA — Patrick Durusau @ 8:34 pm

Map-D: A GPU Database for Real-time Big Data Analytics and Interactive Visualization by Todd Mostak (map-D) and Tom Graham (map-D). (MP4)

From the description:

map-D makes big data interactive for anyone! map-D is a super-fast GPU database that allows anyone to interact and visualize streaming big data in real time. Its unique architecture runs 70-1,000x faster than other in-memory databases or big data analytics platforms. To boot, it works with any size or kind of dataset; works with data that is streaming live on to the system; uses cheap, off-the-shelf hardware; is easily scalable.map-D is focused on learning from big data. At the moment, the map-D team is working on projects with MIT CSAIL, the Harvard Center for Geographic Analysis and the Harvard-Smithsonian Center for Astrophysics. Join Todd Mostak and Tom Graham, key members of the map-D team, as they demonstrate the speed and agility of map-D and describe the live processing, search and mapping of over 1 billion tweets.

I have been haunting the GTC On-Demand page waiting for this to be posted.

I had to download the MP4. (Approximately 124 MB) Suspect they are creating a lot of traffic at the GTC On-Demand page.

As a bonus, see also:

Map-D: GPU-Powered Databases and Interactive Social Science Research in Real Time by Tom Graham (Map_D) and Todd Mostak (Map_D) (streaming) or PDF.

From the description:

Map-D (Massively Parallel Database) uses multiple NVIDIA GPUs to interactively query and visualize big data in real-time. Map-D is an SQL-enabled column store that generates 70-400X speedups over other in-memory databases. This talk discusses the basic architecture of the system, the advantages and challenges of running queries on the GPU, and the implications of interactive and real-time big data analysis in the social sciences and beyond.

Suggestions of more links/papers on Map-D greatly appreciated!

Enjoy!

PS: Just so you aren’t too shocked, the Twitter demo involves scanning a billion row database in 5 mili-seconds.

January 29, 2014

Map-D (the details)

Filed under: GPU,MapD — Patrick Durusau @ 9:15 pm

MIT Spinout Exploits GPU Memory for Vast Visualization by Alex Woodie.

From the post:

An MIT research project turned open source project dubbed the Massively Parallel Database (Map-D) is turning heads for its capability to generate visualizations on the fly from billions of data points. The software—an SQL-based, column-oriented database that runs in the memory of GPUs—can deliver interactive analysis of 10TB datasets with millisecond latencies. For this reason, its creator feels comfortable is calling it “the fastest database in the world.”

Map-D is the brainchild of Todd Mostak, who created the software while taking a class in database development at MIT. By optimizing the database to run in the memory of off-the-shelf graphics processing units (GPUs), Mostak found that he could create a mini supercomputer cluster that offered an order of magnitude better performance than a database running on regular CPUs.

“Map-D is an in-memory column store coded into the onboard memory of GPUs and CPUs,” Mostak said today during Webinar on Map-D. “It’s really designed from the ground up to maximize whatever hardware it’s using, whether it’s running on Intel CPU or Nvidia GPU. It’s optimized to maximize the throughput, meaning if a GPU has this much memory bandwidth, what we really try to do is make sure we’re hitting that memory bandwidth.”

During the webinar, Mostak and Tom Graham, his fellow co-founder of the startup Map-D, demonstrated the technology’s capability to interactively analyze datasets composed of a billion individual records, constituting more than 1TB of data. The demo included a heat map of Twitter posts made from 2010 to the present. Map-D’s “TweetMap” (which the company also demonstrated at the recent SC 2013 conference) runs on eight K40 Tesla GPUs, each with 12 GB of memory, in a single node configuration.

You really need to try the TweetMap example. This rocks!

The details on TweetMap:

You can search tweet text, heatmap results, identify and animate trends, share maps and regress results against census data.

For each click Map-D scans the entire database and visualizes results in real-time. Unlike many other tweetmap demos, nothing is canned or pre-rendered. Recent tweets also stream live onto the system and are available for view within seconds of broadcast.

TweetMap is powered by 8 NVIDIA Tesla K40 GPUs with a total of 96GB of GPU memory in a single node. While we sometimes switch between interesting datasets of various size, for the most part TweetMap houses over 1 billion tweets from 2010 to the present.

Imagine interactive “merging” of subjects based on their properties.

Come to think of it, don’t GPUs handle edges between nodes? As in graphs? 😉

A couple of links for more information, although I suspect the list of resources on Map-D is going to grow by leaps and bounds:

Resources page (included videos of demonstrations).

An Overview of MapD (Massively Parallel Database) by Todd Mostak. (whitepaper)

April 24, 2013

Fast Database Emerges from MIT Class… [Think TweetMap]

Filed under: GPU,MapD,SQL — Patrick Durusau @ 4:39 pm

Fast Database Emerges from MIT Class, GPUs and Student’s Invention by Ian B. Murphy.

Details the invention of MapD by Todd Mostak.

From the post:

MapD, At A Glance:

MapD is a new database in development at MIT, created by Todd Mostak.

  • MapD stands for “massively parallel database.”
  • The system uses graphics processing units (GPUs) to parallelize computations. Some statistical algorithms run 70 times faster compared to CPU-based systems like MapReduce.
  • A MapD server costs around $5,000 and runs on the same power as five light bulbs.
  • MapD runs at between 1.4 and 1.5 teraflops, roughly equal to the fastest supercomputer in 2000.
  • MapD uses SQL to query data.
  • Mostak intends to take the system open source sometime in the next year.

Sam Madden (MIT) describes MapD this way:

Madden said there are three elements that make Mostak’s database a disruptive technology. The first is the millisecond response time for SQL queries across “huge” datasets. Madden, who was a co-creator of the Vertica columnar database, said MapD can do in milliseconds what Vertica can do in minutes. That difference in speed is everything when doing iterative research, he said.

The second is the very tight coupling between data processing and visually rendering the data; this is a byproduct of building the system from GPUs from the beginning. That adds the ability to visualize the results of the data processing in under a second. Third is the cost to build the system. MapD runs in a server that costs around $5,000.

“He can do what a 1000 node MapReduce cluster would do on a single processor for some of these applications,” Madden said.

Not a lot of technical detail but you could start learning CUDA while waiting for the open source release.

At 1.4 to 1.5 teraflops on $5,000 worth of hardware, how will clusters will retain their customer base?

Powered by WordPress