Another Word For It Patrick Durusau on Topic Maps and Semantic Diversity

September 30, 2017

Female Journalists Fight Online Harrassment [An Anti-Censorship Response]

Filed under: Censorship,Feminism,Free Speech,Journalism,News,Reporting — Patrick Durusau @ 2:24 pm

(Before you tweet, pro or con, I take everything Ricchiari reports as true and harassment of women as an issue that must be addressed.)

Female Journalists Fight Online Harrassment by Sherry Ricchiardi.

From the post:

Online tormentors have called Swedish broadcaster Alexandra Pascalidou a “dirty whore,” a “Greek parasite” (a reference to her ethnic heritage), a “stupid psycho,” “ugly liar” and “biased hater.” They have threatened her with gang rape and sexual torture in hideous detail.

But Pascalidou has chosen to fight back by speaking out publicly, as often as she can, against the online harassment faced by female journalists. In November 2016, she testified before a European commission about the impact of gender-based trolling. “(The perpetrators’) goal is our silence,” she told the commission. “It’s censorship hidden behind the veil of freedom of speech. Their freedom becomes our prison.”

In April 2017, Pascalidou appeared on a panel at the International Journalism Festival in Italy, discussing how to handle sexist attacks online. She described the vitriol and threats as “low-intense, constant warfare.”

“Some say switch it off, it’s just online,” she told The Sydney Morning Herald. “It doesn’t count. But it does count, and it’s having a real impact on our lives. Hate hurts. And it often fuels action IRL (in real life).”

Other media watchdogs have taken notice. International News Safety Institute director Hannah Storm has called online harassment “the scourge of the moment in our profession” and a “major threat to the safety and security of women journalists.”

“When women journalists are the target, online harassment quickly descends into sexualized hate or threats more often than with men,” she added. “Women are more likely to be subjected to graphic sexual and physical violence.”

You will be hard pressed to find a more radical supporter of free speech than myself. I don’t accept the need for censorship of any content, for any reason, by any public or private entity.

Having said that, users should be enabled to robustly filter speech they encounter, so as to avoid harassment, threats, etc. But they are filtering their information streams and not mine. There’s a difference.

Online harassment is consistent with the treatment of women IRL (in real life). Cultural details will vary but the all encompassing abuse described in Woman at point zero by Nawāl Saʻdāwī can be found in any culture.

The big answer is to change the treatment of women in society, which in turn will reduce online harassment. But big answers don’t provide relief to women who are suffering online now. Ricchiardi lists a number of medium answers, the success of which will vary from one newsroom to another.

I have a small answer that isn’t seeking a global, boil-the-ocean answer.

Follow female journalists on Twitter and other social media. Don’t be silent in the face of public harassment.

You can consider one or more of the journalists from Leading women journalists – A public list by Ellie Van Houtte.

Personally I’m looking for local or not-yet-leading female journalists to follow. A different perspective on the news than my usual feed plus an opportunity to be supportive in a hostile environment.

Being supportive requires no censorship and supplies aid where it is needed the most.

Yes?
September 29, 2017

Pipeline Resistance – Pipeline Locations – Protest Activity (GPS Locations of Pipelines)

Filed under: #DAPL,Environment,Protests — Patrick Durusau @ 8:25 pm

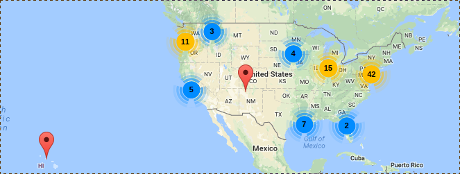
Mapping Fossil Fuel Resistance

An interactive map of groups resisting fossil fuel pipelines, which appears US-centric to me.

What do you think?

If you check the rest of the map, no groups at other locations, at least not yet.

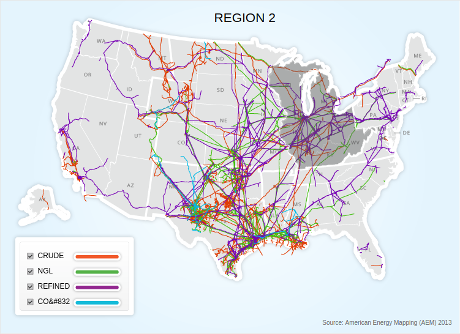
The distribution of protests is sparse, considering the number of pipelines in the US:

Pipeline image from: Pipeline 101 – Where Are Liquids Pipelines Located?.

Maps of pipelines, for national security reasons, are limited in their resolution.

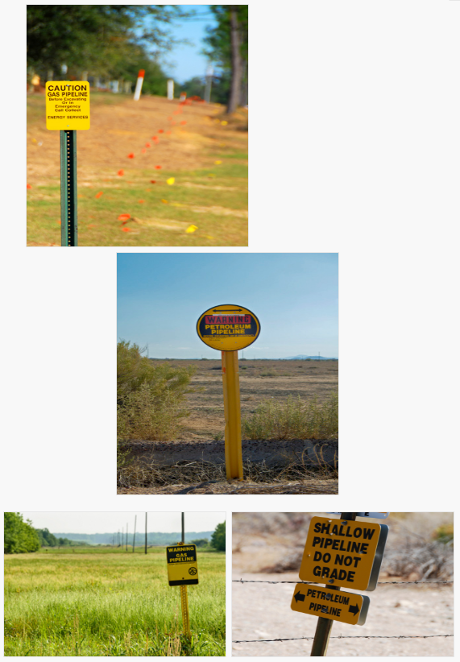
I’m not sure how effective limiting pipeline map resolution must be since Pipeline 101 -How Can You Identify Pipelines?, gives these examples:

You get close enough from a “security minded” pipeline map and then drive until you see a long flat area with a pipeline sign. That doesn’t sound very hard to me. You?

Possible protest activity. Using the GPS on your phone, record locations where pipelines cross highways. Collaborate on production of GPS-based pipeline maps. Free to the public (including protesters).

We have the technology. Do we have the will to create our own maps of pipeline locations?

@niccdias and @cward1e on Mis- and Dis-information [Additional Questions]

Filed under: Authoring Topic Maps,Journalism,News,Reporting,Social Media,Topic Maps — Patrick Durusau @ 7:50 pm

10 questions to ask before covering mis- and dis-information by Nic Dias and Claire Wardle.

From the post:

Can silence be the best response to mis- and dis-information?

First Draft has been asking ourselves this question since the French election, when we had to make difficult decisions about what information to publicly debunk for CrossCheck. We became worried that – in cases where rumours, misleading articles or fabricated visuals were confined to niche communities – addressing the content might actually help to spread it farther.

As Alice Marwick and Rebecca Lewis noted in their 2017 report, Media Manipulation and Disinformation Online, “[F]or manipulators, it doesn’t matter if the media is reporting on a story in order to debunk or dismiss it; the important thing is getting it covered in the first place.” Buzzfeed’s Ryan Broderick seemed to confirm our concerns when, on the weekend of the #MacronLeaks trend, he tweeted that 4channers were celebrating news stories about the leaks as a “form of engagement.”

We have since faced the same challenges in the UK and German elections. Our work convinced us that journalists, fact-checkers and civil society urgently need to discuss when, how and why we report on examples of mis- and dis-information and the automated campaigns often used to promote them. Of particular importance is defining a “tipping point” at which mis- and dis-information becomes beneficial to address. We offer 10 questions below to spark such a discussion.

Before that, though, it’s worth briefly mentioning the other ways that coverage can go wrong. Many research studies examine how corrections can be counterproductive by ingraining falsehoods in memory or making them more familiar. Ultimately, the impact of a correction depends on complex interactions between factors like subject, format and audience ideology.

Reports of disinformation campaigns, amplified through the use of bots and cyborgs, can also be problematic. Experiments suggest that conspiracy-like stories can inspire feelings of powerlessness and lead people to report lower likelihoods to engage politically. Moreover, descriptions of how bots and cyborgs were found give their operators the opportunity to change strategies and better evade detection. In a month awash with revelations about Russia’s involvement in the US election, it’s more important than ever to discuss the implications of reporting on these kinds of activities.

Following the French election, First Draft has switched from the public-facing model of CrossCheck to a model where we primarily distribute our findings via email to newsroom subscribers. Our election teams now focus on stories that are predicted (by NewsWhip’s “Predicted Interactions” algorithm) to be shared widely. We also commissioned research on the effectiveness of the CrossCheck debunks and are awaiting its results to evaluate our methods.

The ten questions (see the post) should provoke useful discussions in newsrooms around the world.

I have three additional questions that round Nic Dias and Claire Wardle‘s list to a baker’s dozen:

  1. How do you define mis- or dis-information?
  2. How do you evaluate information to classify it as mis- or dis-information?
  3. Are your evaluations of specific information as mis- or dis-information public?

Defining dis- or mis-information

The standard definitions (Merriam Webster) for:

disinformation: false information deliberately and often covertly spread (as by the planting of rumors) in order to influence public opinion or obscure the truth

misinformation: incorrect or misleading information

would find nodding agreement from Al Jazeera and the CIA, to the European Union and Recep Tayyip Erdoğan.

However, what is or is not disinformation or misinformation would vary from one of those parties to another.

Before reaching the ten questions of Nic Dias and Claire Wardle, define what you mean by disinformation or misinformation. Hopefully with numerous examples, especially ones that are close to the boundaries of your definitions.

Otherwise, all your readers know is that on the basis of some definition of disinformation/misinformation known only to you, information has been determined to be untrustworthy.

Documenting your process to classify as dis- or mis-information

Assuming you do arrive at a common definition of misinformation or disinformation, what process do you use to classify information according to those definitions? Ask your editor? That seems like a poor choice but no doubt it happens.

Do you consult and abide by an opinion found on Snopes? Or Politifact? Or FactCheck.org? Do all three have to agree for a judgement of misinformation or disinformation? What about other sources?

What sources do you consider definitive on the question of mis- or disinformation? Do you keep that list updated? How did you choose those sources over others?

Documenting your evaluation of information as dis- or mis-information

Having a process for evaluating information is great.

But have you followed that process? If challenged, how would you establish the process was followed for a particular piece of information?

Is your documentation office “lore,” or something more substantial?

An online form that captures the information, its source, the check fact source consulted with date, decision and person making the decision would take only seconds to populate. In addition to documenting the decision, you can build up a record of a source’s reliability.

Conclusion

Vagueness makes discussion and condemnation of mis- or dis-information easy to do and difficult to have a process for evaluating information, a common ground for classifying that information, to say nothing of documenting your decision on specific information.

Don’t be the black box of whim and caprice users experience at Twitter, Facebook and Google. You can do better than that.

September 28, 2017

NLP tools for East Asian languages

Filed under: Language,Natural Language Processing — Patrick Durusau @ 8:59 pm

NLP tools for East Asian languages

CLARIN is building a list of NLP tools for East Asian languages.

Oh, sorry:

CLARIN – European Research Infrastructure for Language Resources and Technology

CLARIN makes digital language resources available to scholars, researchers, students and citizen-scientists from all disciplines, especially in the humanities and social sciences, through single sign-on access. CLARIN offers long-term solutions and technology services for deploying, connecting, analyzing and sustaining digital language data and tools. CLARIN supports scholars who want to engage in cutting edge data-driven research, contributing to a truly multilingual European Research Area.

CLARIN stands for “Common Language Resources and Technology Infrastructure”.

Contribute to the spreadsheet of NLP tools and enjoy the CLARIN website.

Tails 3.2 Out! [Questions for Journalists]

Filed under: Cybersecurity,Journalism,Security,Tails,Tor — Patrick Durusau @ 8:48 pm

Tails 3.2 is out

From the about page:

Tails is a live system that aims to preserve your privacy and anonymity. It helps you to use the Internet anonymously and circumvent censorship almost anywhere you go and on any computer but leaving no trace unless you ask it to explicitly.

It is a complete operating system designed to be used from a USB stick or a DVD independently of the computer’s original operating system. It is Free Software and based on Debian GNU/Linux.

Tails comes with several built-in applications pre-configured with security in mind: web browser, instant messaging client, email client, office suite, image and sound editor, etc.

Does your editor keep all reporters supplied with a current version of Tails?

Are reporters trained on a regular basis in the use of Tails?

If your answer to either question is no, you should be looking for another employer.

EU Humps Own Leg – Demands More Censorship From Tech Companies

Filed under: Censorship,EU,Free Speech,Government — Patrick Durusau @ 8:09 pm

In its mindless pursuit of the marginal and irrelevant, the EU is ramping up pressure on tech companies censor more speech.

Security Union: Commission steps up efforts to tackle illegal content online

Brussels, 28 September 2017

The Commission is presenting today guidelines and principles for online platforms to increase the proactive prevention, detection and removal of illegal content inciting hatred, violence and terrorism online.

As a first step to effectively fight illegal content online, the Commission is proposing common tools to swiftly and proactively detect, remove and prevent the reappearance of such content:

  • Detection and notification: Online platforms should cooperate more closely with competent national authorities, by appointing points of contact to ensure they can be contacted rapidly to remove illegal content. To speed up detection, online platforms are encouraged to work closely with trusted flaggers, i.e. specialised entities with expert knowledge on what constitutes illegal content. Additionally, they should establish easily accessible mechanisms to allow users to flag illegal content and to invest in automatic detection technologies.
  • Effective removal: Illegal content should be removed as fast as possible, and can be subject to specific timeframes, where serious harm is at stake, for instance in cases of incitement to terrorist acts. The issue of fixed timeframes will be further analysed by the Commission. Platforms should clearly explain to their users their content policy and issue transparency reports detailing the number and types of notices received. Internet companies should also introduce safeguards to prevent the risk of over-removal.
  • Prevention of re-appearance: Platforms should take measures to dissuade users from repeatedly uploading illegal content. The Commission strongly encourages the further use and development of automatic tools to prevent the re-appearance of previously removed content.

… (emphasis in original)

Taking Twitter as an example, EU terrorism concerns are generously described as coke-fueled fantasies.

Twitter Terrorism By The Numbers

Don’t take my claims about Twitter as true without evidence! Such as statistics gathered on Twitter and Twitter’s own reports.

Twitter Statistics:

Total Number of Monthly Active Twitter Users: 328 million (as of 8/12/17)

Total Number of Tweets sent per Day: 500 million (as of 1/24/17)

Number of Twitter Daily Active Users: 100 million (as of 1/24/17)

Government terms of service reports Jan – Jun 30, 2017

Reports 338 reports on 1200 accounts suspended for promotion of terrorism.

Got that? From Twitter’s official report, 1200 accounts suspended for promotion of terrorism.

I read that to say 1200 accounts out of 328 million monthly users.

Aren’t you just shaking in your boots?

But it gets better, Twitter has a note on promotion of terrorism:

During the reporting period of January 1, 2017 through June 30, 2017, a total of 299,649 accounts were suspended for violations related to promotion of terrorism, which is down 20% from the volume shared in the previous reporting period. Of those suspensions, 95% consisted of accounts flagged by internal, proprietary spam-fighting tools, while 75% of those accounts were suspended before their first tweet. The Government TOS reports included in the table above represent less than 1% of all suspensions in the reported time period and reflect an 80% reduction in accounts reported compared to the previous reporting period.

We have suspended a total of 935,897 accounts in the period of August 1, 2015 through June 30, 2017.

That’s more than the 1200 reported by governments, but comparing 935,897 accounts total, against 328 million monthly users, assuming all those suspensions were warranted (more on that in a minute), “terrorism” accounts were less than 1/3 of 1% of all Twitter accounts.

The EU is urging more pro-active censorship over less than 1/3 of 1% of all Twitter accounts.

Please help the EU find something more trivial and less dangerous to harp on.

The Dangers of Twitter Censorship

Known Unknowns: An Analysis of Twitter Censorship in Turkey by Rima S. Tanash, et. al, studies Twitter censorship in Turkey:

Twitter, widely used around the world, has a standard interface for government agencies to request that individual tweets or even whole accounts be censored. Twitter, in turn, discloses country-by-country statistics about this censorship in its transparency reports as well as reporting specific incidents of censorship to the Chilling Effects web site. Twitter identifies Turkey as the country issuing the largest number of censorship requests, so we focused our attention there. Collecting over 20 million Turkish tweets from late 2014 to early 2015, we discovered over a quarter million censored tweets—two orders of magnitude larger than what Twitter itself reports. We applied standard machine learning / clustering techniques, and found the vast bulk of censored tweets contained political content, often critical of the Turkish government. Our work establishes that Twitter radically under-reports censored tweets in Turkey, raising the possibility that similar trends hold for censored tweets from other countries as well. We also discuss the relative ease of working around Twitter’s censorship mechanisms, although we can not easily measure how many users take such steps.

Are you surprised that:

  1. Censors lie about the amount of censoring done, or
  2. Censors censor material critical of governments?

It’s not only users in Turkey who have been victimized by Twitter censorship. Alfons López Tena has great examples of unacceptable Twitter censorship in: Twitter has gone from bastion of free speech to global censor.

You won’t notice Twitter censorship if you don’t care about Arab world news or Catalan independence. And, after all, you really weren’t interested in those topics anyway. (sarcasm)

Next Steps

The EU wants an opaque, private party to play censor for content on a worldwide basis. In pursuit of a gnat in the flood of social media content.

What could possibly go wrong? Well, as long as you don’t care about the Arab world, Catalan independence, or well, criticism of government in general. You don’t care about those things, right? Otherwise you might be a terrorist in the eyes of the EU and Twitter.

The EU needs to be distracted from humping its own leg and promoting censorship of social media.

Suggestions?

PS: Other examples of inappropriate Twitter censorship abound but the answer to all forms of censorship is NO. Clear, clean, easy to implement. Don’t want to see content? Filter your own feed, not mine.

Global Forest Change 2000–2015

Filed under: Geographic Data,Geography — Patrick Durusau @ 10:53 am

Global Forest Change 2000–2015

From the webpage:

Results from time-series analysis of Landsat images in characterizing global forest extent and change from 2000 through 2015. For additional information about these results, please see the associated journal article (Hansen et al., Science 2013).

Web-based visualizations of these results are also available at our main site:

http://earthenginepartners.appspot.com/science-2013-global-forest

Please use that URL when linking to this dataset.

We anticipate releasing updated versions of this dataset. To keep up to date with the latest updates, and to help us better understand how these data are used, please register as a user. Thanks!

User Notes for Version 1.3 Update

Some examples of improved change detection in the 2011–2015 update include the following:

  1. Improved detection of boreal forest loss due to fire.
  2. Improved detection of smallholder rotation agricultural clearing in dry and humid tropical forests.
  3. Improved detection of selective logging.
  4. Improved detection of the clearing of short cycle plantations in sub-tropical and tropical ecozones.

Detecting deforestation is the first step in walking up the chain of responsibility for this global scourge. One hopes with consequences at every level.

USGS Global Land Cover Characteristics Data Base Version 2.0

Filed under: Geographic Data,Geography — Patrick Durusau @ 10:14 am

Global Land Cover Characteristics Data Base Version 2.0

From the introduction:

The U.S. Geological Survey’s (USGS) National Center for Earth Resources Observation and Science (EROS), the University of Nebraska-Lincoln (UNL) and the Joint Research Centre of the European Commission have generated a 1-km resolution global land cover characteristics data base for use in a wide range of environmental research and modeling applications (Loveland and others, 2000). The land cover characterization effort is part of the National Aeronautics and Space Administration (NASA) Earth Observing System Pathfinder Program and the International Geosphere-Biosphere Programme-Data and Information System focus 1 activity. Funding for the project is provided by the USGS, NASA, U.S. Environmental Protection Agency, National Oceanic and Atmospheric Administration, U.S. Forest Service, and the United Nations Environment Programme.

The data set is derived from 1-km Advanced Very High Resolution Radiometer (AVHRR) data spanning a 12-month period (April 1992-March 1993) and is based on a flexible data base structure and seasonal land cover regions concepts. Seasonal land cover regions provide a framework for presenting the temporal and spatial patterns of vegetation in the database. The regions are composed of relatively homogeneous land cover associations (for example, similar floristic and physiognomic characteristics) which exhibit distinctive phenology (that is, onset, peak, and seasonal duration of greenness), and have common levels of primary production.

Rather than being based on precisely defined mapping units in a predefined land cover classification scheme, the seasonal land cover regions serve as summary units for both descriptive and quantitative attributes. The attributes may be considered as spreadsheets of region characteristics and permit updating, calculating, or transforming the entries into new parameters or classes. This provides the flexibility for using the land cover characteristics data base in a variety of models without extensive modification of model inputs.

The analytical strategy for global land cover characterization has evolved from methods initially tested during the development of a prototype 1-km land cover characteristics data base for the conterminous United States (Loveland and others, 1991, 1995; Brown and others, 1993). In the U.S. study, multitemporal AVHRR data, combined with other ancillary data sets, were used to produce a prototype land cover characteristics data base.

An older data set (April 1992-March 1993) at 1-km resolution, but still useful for data training, as historical data and you can imagine other planning uses.

Enjoy!

FAO GeoNETWORK

Filed under: Geographic Data,Geography — Patrick Durusau @ 10:05 am

FAO GeoNETWORK

From the about page:

The FAO GeoNetwork provides Internet access to interactive maps, satellite imagery and related spatial databases maintained by FAO and its partners.

It’s purpose is to improve access to and integrated use of spatial data and information.

Through this website FAO facilitates multidisciplinary approaches to sustainable development and supports decision making in agriculture, forestry, fisheries and food security.

Maps, including those derived from satellite imagery, are effective communicational tools and play an important role in the work of various types of users:

  • Decision Makers: e.g. Sustainable development planners and humanitarian and emergency managers in need of quick, reliable and up to date user-friendly cartographic products as a basis for action and better plan and monitor their activities.
  • GIS Experts in need of exchanging consistent and updated geographical data.
  • Spatial Analysts in need of multidisciplinary data to perform preliminary geographical analysis and reliable forecasts to better set up appropriate interventions in vulnerable areas.

The FAO GeoNetwork allows to easily share spatial data among different FAO Units, other UN Agencies, NGO’s and other institutions.

The FAO GeoNetwork site is powered by GeoNetwork opensource.

FAO and WFP, UNEP and more recently OCHA, have combined their research and mapping expertise to develop GeoNetwork opensource as a common strategy to effectively share their spatial databases including digital maps, satellite images and related statistics. The three agencies make extensive use of computer-based data visualization tools, known as Geographic Information System (GIS) and Remote Sensing (RS) software, mostly to create maps that combine various layers of information. GeoNetwork opensource provides them with the capacity to access a wide selection of maps and other spatial information stored in different databases around the world through a single entry point.

GeoNetwork opensource has been developed to connect spatial information communities and their data using a modern architecture, which is at the same time powerful and low cost, based on the principles of Free and Open Source Software (FOSS) and International and Open Standards for services and protocols (a.o. from ISO/TC211 and OGC).

For more information contact us at GeoNetwork@fao.org)

Apologies for the acronym heavy writing. Hard to say if it is meant as shorthand, as in scientific writing or to make ordinary writing opaque.

FAO – Food and Agriculture Organization of the United Nations

OCHA -United Nations Office for the Coordination of Humanitarian Affairs

OGC – Open Geospatial Consortium

UNEP – UN Environment

WFP – World Food Programme

Extremely rich collection of resources, not to mention opensource software for its use.

A site to bookmark in hopes your dreams of regime change evolve beyond spray paint and random acts of violence.

The CIA advises on such matters but their loyalty and motivations are highly suspect. Not to mention being subject to the whim and caprice of American politics.

Trust is ok, but independent analysis and verification is much better.

September 27, 2017

MarkLogic and Intel – “government-grade security” – Err, thanks but no thanks.

Filed under: Cybersecurity,MarkLogic — Patrick Durusau @ 4:32 pm

Big Data Solutions for Government Agencies—MarkLogic and Intel

I thought you might appreciate the hyperbole in this marketing fluff from Intel:

This paper summarizes the issues government agencies face today with relational database management system (RDBMS) + storage area network (SAN) data environments and why the combination of MarkLogic, Apache Hadoop*, and Intel provides a government-grade solution for big data. Running on Intel® technology and the enhancements Intel has brought to Apache Hadoop, this integration gives public agencies a true enterprise-class big data solution with government-grade security for storage, real-time queries, and analysis of all their data. (emphasis added)

Really? “…government-grade security….”

Do they mean like the CIA (Aldrich Ames), NSA (Snowden), Office of Personnel Management (OPM), that sort of “…government-grade security….?”

You could have quantum level encryption and equally secure software, but when you add users:

You new state of cybersecurity.

Discussion of security absent your users isn’t meaningful. Don’t lose money on consultants and hackers as well. The meaningful question is how secure is system X with my users? Ask that and judge vendors by their answers.

Salvation for the Left Behind on Twitter’s 280 Character Limit

Filed under: Social Media,Twitter — Patrick Durusau @ 3:14 pm

If you are one of the “left behind” on Twitter’s expansion to a 280 character limit, don’t despair!

Robert Graham (@ErrataRob) rides to your rescue with: Browser hacking for 280 character tweets.

Well, truth is Bob covers more than simply reaching the new 280 character limit for the left behind, covering HTTP requests, introduces Chrome’s DevTool, command line use of cURL.

Take a few minutes to walk through Bob’s post.

A little knowledge of browsers and tools will put you far ahead of your management.

InfoWord Bossie 2017 Awards Databases & Analytics

Filed under: Data Analysis,Database — Patrick Durusau @ 2:44 pm

InfoWorld’s Bossie awards for 2017 for databases and analytics.

In true InfoWorld fashion, the winners were in no particular order, one per slide and presented as images to prevent copy-n-paste.

Let’s re-arrange those “facts” for the time-pressed reader:

Hyperlinks are to the projects, the best information you will find for each one.

Enjoy!

#1 of the “Big Four” Falls – Odds On Your Mid-Term Candidate?

Filed under: Cybersecurity,Security — Patrick Durusau @ 10:37 am

Deloitte, one of the “Big Four” accounting firms has suffered an email leak. Ben Miller reports varying accounts of the breach in Deloitte Admits Email Hack, Says No Government Clients Impacted.

Deloitte minimizes the breach while others report the entire system was breached, months ago. Too early to know the details but I’m betting on complete breach.

Which is made all the more amusing by this description of the “Big Four:”

The majority of the world’s auditing services are performed by only four accounting firms.

Known as the ‘Big 4’, these firms completely dominate the industry, auditing more than 80 percent of all US public companies.

In addition, these mammoth organizations advise on tax and offer a wide range of management and assurance services.

Although usually identified as single companies, each one of the Big 4 Accounting Firms is actually a network of independent corporations who have entered into agreements with one another to set quality standards and share a common name.

….

Deloitte LLP is the number one firm in the United States (and in the world). The company began as the separate companies of William Deloitte, Charles Haskins, Elijah Sells, and George Touche. The three companies eventually merged to become Deloitte & Touche. Today the company is known primarily as Deloitte LLP, and has four subsidiaries: Deloitte & Touche LLP, Deloitte Consulting LLP, Deloitte Financial Advisory Services LLP and Deloitte Tax LLP.

The Big 4 Accounting Firms

With serious people failing at cybersecurity, what are the odds for your candidate for the 2018 congressional mid-terms? Or the odds for candidates you oppose in the same election?

All the more reason to mourn the passing of Leonard Cohen.

He could have written: Transparency is coming to the USA.

Are you on the side of transparency or opaqueness and privilege?

PS: A scoreboard for cybersecurity breaches of the “Big Four:”

Updates to: patrick@durusau.net

September 26, 2017

Exploratory Data Analysis of Tropical Storms in R

Filed under: Programming,R,Weather Data — Patrick Durusau @ 7:52 pm

Exploratory Data Analysis of Tropical Storms in R by Scott Stoltzman.

From the post:

The disastrous impact of recent hurricanes, Harvey and Irma, generated a large influx of data within the online community. I was curious about the history of hurricanes and tropical storms so I found a data set on data.world and started some basic Exploratory data analysis (EDA).

EDA is crucial to starting any project. Through EDA you can start to identify errors & inconsistencies in your data, find interesting patterns, see correlations and start to develop hypotheses to test. For most people, basic spreadsheets and charts are handy and provide a great place to start. They are an easy-to-use method to manipulate and visualize your data quickly. Data scientists may cringe at the idea of using a graphical user interface (GUI) to kick-off the EDA process but those tools are very effective and efficient when used properly. However, if you’re reading this, you’re probably trying to take EDA to the next level. The best way to learn is to get your hands dirty, let’s get started.

The original source of the data was can be found at DHS.gov.

Great walk through on exploratory data analysis.

Everyone talks about the weather but did you know there is a forty (40) year climate lag between cause and effect?

The human impact on the environment today, won’t be felt for another forty (40) years.

Can to predict the impact of a hurricane in 2057?

Some other data/analysis resources on hurricanes, Climate Prediction Center, Hurricane Forecast Computer Models, National Hurricane Center.

PS: Is a Category 6 Hurricane Possible? by Brian Donegan is an interesting discussion on going beyond category 5 for hurricanes. For reference on speeds, see: Fujita Scale (tornadoes).

GraphQL News

Filed under: Facebook,GraphQL,Graphs — Patrick Durusau @ 6:45 pm

Relicensing the GraphQL specification

From the post:

Today we’re relicensing the GraphQL specification under the Open Web Foundation Agreement (OWFa) v1.0. We think the OWFa is a great fit for GraphQL because it’s designed for collaborative open standards and supported by other well-known companies. The OWFa allows GraphQL to be implemented under a royalty-free basis, and allows other organizations to contribute to the project on reasonable terms.

Additionally, our reference implementation GraphQL.js and client-side framework Relay will be relicensed under the MIT license, following the React open source ecosystem’s recent change. The GraphQL specification and our open source software around GraphQL have different licenses because the open source projects’ license only covers the specific open source projects while the OWFa is meant to cover implementations of the GraphQL specification.

I want to thank everyone for their patience as we worked to arrive at this change. We hope that GraphQL adopting the Open Web Foundation Agreement, and GraphQL.js and Relay adopting the MIT license, will lead to more companies using and improving GraphQL, and pave the way for GraphQL to become a true standard across the web.

The flurry of relicensing at Facebook is an important lesson for anyone aiming for a web scale standard:

Restrictive licenses don’t scale. (full stop)

Got that?

The recent and sad experience with enabling DRM by the W3C, aka EME, doesn’t prove the contrary. An open API to DRM will come to an unhappy end when content providers realize DRM is a tax on all their income, not just a way to stop pirates.

Think of it this way, would you pay a DRM tax of 1% on your income to prevent theft of 0.01% of your income? If you would, you are going to enjoy EME! Those numbers are, of course, fictional, just like the ones on content piracy. Use them with caution.

571 threats to press freedom in first half of 2017 [Hiding the Perpetrators?]

Filed under: Censorship,Free Speech,Government,Journalism,News,Reporting — Patrick Durusau @ 6:09 pm

Mapping Media Freedom verifies 571 threats to press freedom in first half of 2017

First Limit on Coverage

When reading this report, which is excellent coverage of assaults on press freedom, bear in mind the following limitation:

Mapping Media Freedom identifies threats, violations and limitations faced by members of the press throughout European Union member states, candidates for entry and neighbouring countries.

You will not read about US-based and other threats to press freedom that fall outside the purview of Mapping Media Freedom.

From the post:

Index on Censorship’s database tracking violations of press freedom recorded 571 verified threats and limitations to media freedom during the first two quarters of 2017.

During the first six months of the year: three journalists were murdered in Russia; 155 media workers were detained or arrested; 78 journalists were assaulted; 188 incidents of intimidation, which includes psychological abuse, sexual harassment, trolling/cyberbullying and defamation, were documented; 91 criminal charges and civil lawsuits were filed; journalists and media outlets were blocked from reporting 91 times; 55 legal measures were passed that could curtail press freedom; and 43 pieces of content were censored or altered.

“The incidents reported to the Mapping Media Freedom in the first half of 2017 tell us that the task of keeping the public informed is becoming much harder and more dangerous for journalists. Even in countries with a tradition of press freedom journalists have been harassed and targeted by actors from across the political spectrum. Governments and law enforcement must redouble efforts to battle impunity and ensure fair treatment of journalists,” Hannah Machlin, Mapping Media Freedom project manager, said.

This is a study of threats, violations and limitations to media freedom throughout Europe as submitted to Index on Censorship’s Mapping Media Freedom platform. It is made up of two reports, one focusing on Q1 2017 and the other on Q2 2017.

You can obtain the report in PDF format.

Second Limit on Coverage

As I read about incident after incident, following the links, I only see “the prosecutor,” “the police,” “traffic police,” “its publisher,” “the publisher of the channel,” and similar opaque prose.

Surely “the prosecutor” and “the publisher” was known to the person reporting the incident. If that is the case, then why hide the perpetrators? What does that gain for freedom of the press?

Am I missing some unwritten rule that requires members of the press to be perpetual victims?

Exposing the perpetrators to the bright light of public scrutiny, enables local and remote defenders of press freedom to join in defense of the press.

Yes?

Global Land Survey (GLS) [Weaponizing Data]

Filed under: Geographic Data,Geography,Maps — Patrick Durusau @ 4:33 pm

Global Land Survey (GLS) is part of a collection I discovered at: 12 Sources to Download FREE Land Cover and Land Use Data. To use that collection you have to wade through pages of ads.

I am covering the sources separately and including their original descriptions.

From the GLS webpage:

The U.S. Geological Survey (USGS) and the National Aeronautics and Space Administration (NASA) collaborated from 2009 to 2011 to create the Global Land Surveys (GLS) datasets. Each of these collections were created using the primary Landsat sensor in use at the time for each collection epoch. The scenes used were a pre-collection format that met strict quality and cloud cover standards at the time the GLS files were created.

Additional details about the Global Land Survey collection can be found at http://landsat.usgs.gov/global-land-surveys-gls.

The Global Land Survey collection consists of images acquired from 1972 to 2012 combined into one dataset.

All Global Land Survey datasets contain the standard Landsat bands designated for each sensor. Band Designations can be found at http://landsat.usgs.gov/what-are-band-designations-landsat-satellites.

[data notes]

Global Land Survey data are available to search and download through EarthExplorer and GloVis. The collection can be found under the Global Land Survey category in EarthExplorer.

Users can download the full resolution LandsatLook jpg images http://landsat.usgs.gov/landsatlook-images, and the Level 1 Data Products http://landsat.usgs.gov/landsat-data-access.

Fifteen meter resolution in the panchromatic band. Nearly as accurate as someone stepping across a compound to establish target coordinates.

Which do you find more amazing: 1) Free access to data to weaponize or, 2) Lack of use of data as a weapon by NGOs?

MODIS Global Land Cover

Filed under: Geography,Geospatial Data,Maps — Patrick Durusau @ 1:11 pm

MODIS Global Land Cover is part of a collection I discovered at: 12 Sources to Download FREE Land Cover and Land Use Data. To use that collection you have to wade through pages of ads.

I am covering the sources separately and including their original descriptions.

From the webpage:

New NASA land cover maps are providing scientists with the most refined global picture ever produced of the distribution of Earth’s ecosystems and land use patterns. High-quality land cover maps aid scientists and policy makers involved in natural resource management and a range of research and global monitoring objectives.

The land cover maps were developed at Boston University in Boston, MA., using data from the Moderate Resolution Imaging Spectroradiometer (MODIS) instrument on NASA’s Terra satellite. The maps are based on a digital database of Earth images collected between November 2000 and October 2001.

“These maps, with spatial resolution of 1 kilometer (.6 mile), mark a significant step forward in global land cover mapping by providing a clearer, more detailed picture than previously available maps,” says Mark Friedl, one of the project’s investigators.

The MODIS sensor’s vantage point of a given location on Earth changes with each orbit of the satellite. An important breakthrough for these maps is the merging of those multiple looks into a single image. In addition, advances in remote sensing technology allow MODIS to collect higher-quality data than previous sensors. Improvements in data processing techniques have allowed the team to automate much of the classification, reducing the time to generate maps from months or years to about one week.

Each MODIS land cover map contains 17 different land cover types, including eleven natural vegetation types such as deciduous and evergreen forests, savannas, and wetlands. Agricultural land use and land surfaces with little or no plant cover—such as bare ground, urban areas and permanent snow and ice—are also depicted on the maps. Important uses include managing forest resources, improving estimates of the Earth’s water and energy cycles, and modeling climate and global carbon exchange among land, life, and the atmosphere.

Carbon cycle modeling is linked to greenhouse gas inventories—estimates of greenhouse emissions from human sources, and their removal by greenhouse gas sinks, such as plants that absorb and store carbon dioxide through photosynthesis. Many nations, including the United States, produce the inventories annually in an effort to understand and predict climate change.

“This product will have a major impact on our carbon budget work,” says Professor Steve Running of the University of Montana, Missoula, who uses the Boston University land cover maps in conjunction with other weekly observations from MODIS. “With the MODIS land cover product we can determine current vegetation in detail for each square kilometer; for example, whether there is mature vegetation, clear cutting, a new fire scar, or agricultural crops. This means we can produce annual estimates of net change in vegetation cover. This gets us one step closer to a global picture of carbon sources and sinks.”

This first map is an important milestone, but the land cover mapping group in Boston has other projects in progress. “With data collected over several years,” says Friedl, “we will be able to create maps that highlight global-scale changes in vegetation and land cover in response to climate change, such as drought. We’ll also be establishing the timing of seasonal changes in vegetation, defining when important transitions take place, such as the onset of the growing season.”

Launched December 18, 1999, Terra is the flagship of the Earth Observing System series of satellites and is a central part of NASA’s Earth Science Enterprise. The mission of the Earth Science Enterprise is to develop a scientific understanding of the Earth system and its response to natural and human-induced changes to enable improved prediction capability for climate, weather, and natural hazards.

Not recent data but depending upon your needs it is both a historical snapshot and a benchmark of then current technology.

Enjoy!

September 25, 2017

Evidence of Government Surveillance in Mexico Continues to Mount [Is This News?]

Filed under: Cybersecurity,Government,Journalism,News,Privacy,Reporting,Security — Patrick Durusau @ 4:19 pm

Evidence of Government Surveillance in Mexico Continues to Mount by Giovanna Salazar, translated by Omar Ocampo.

From the post:

In early September, further attempts to spy on activists in Mexico were confirmed. The president of Mexicans Against Corruption and Impunity (MCCI), an organization dedicated to investigative journalism, received several SMS messages that were intended to infect his mobile device with malicious software.

According to The New York Times, Claudio X. González Guajardo was threatened with Pegasus, a sophisticated espionage tool or “spyware” sold exclusively to governments that was acquired by the Mexican government in 2014 and 2015, with the alleged intention of combating organized crime. Once installed, Pegasus spyware allows the sender or attacker to access files on the targeted device, such as text messages, emails, passwords, contacts list, calendars, videos and photographs. It even allows the microphone and camera to activate at any time, inadvertently, on the infected device.

Salazar’s careful analysis of the evidence leaves little doubt:

these intrusive technologies are being used to intimidate and silence dissent.

But is this news?

I ask because my starting assumption is that governments buy surveillance technologies to invade the privacy of their citizens. The other reason would be?

You may think some targets merit surveillance, such as drug dealers, corrupt officials, but once you put surveillance tools in the hands of government, all citizens are living in the same goldfish bowl. Whether we are guilty of any crime or not.

The use of surveillance “to intimidate and silence dissent” is as natural to government as corruption.

The saddest part of Salazar’s report is that Pegasus is sold exclusively to governments.

Citizens need a free, open source edition of Pegasus Next Generation with which to spy on governments, businesses, banks, etc.

A way to invite them into the goldfish bowl in which ordinary citizens already live.

The ordinary citizen has no privacy left to lose.

The question is when current spy masters will lose theirs as well?

Awesome Windows Exploitation Resources (curated)

Filed under: Cybersecurity,Malware,Security — Patrick Durusau @ 3:27 pm

Awesome Windows Exploitation Resources

Not all of these resources are recent but with vulnerability lifetimes of a decade or more, there is much to learn here. I count two hundred and fifty (250) resources as of today.

Including election day, November 6, 2018, there are only 408 days left until the 2018 mid-term Congressional elections. You have a lot of reading to do.

You can contribute materials for listing.

If You Are Keeping A Public Enemies List…

Filed under: Government,Intellectual Property (IP) — Patrick Durusau @ 2:53 pm

Not everyone keeps a “public enemies” list and fewer still actively work against those on the list.

If you do more than grumble against your list members on Buttbook, I have important information for you.

Bell Calls for CRTC-Backed Website Blocking System and Complete Criminalization of Copyright in NAFTA

From the post:

Bell, Canada’s largest telecom company, has called on the government to support radical copyright and broadcast distribution reforms as part of the NAFTA renegotiation. Their proposals include the creation of a mandated website blocking system without judicial review overseen by the CRTC and the complete criminalization of copyright with criminal provisions attached to all commercial infringement. Bell also supports an overhaul of the current retransmission system for broadcasters, supporting a “consent model” that would either keep U.S. channels out of the Canadian market or dramatically increase their cost of access while maintaining simultaneous substitution.

There may be clearer declarations against the public good but I haven’t seen them. But, I haven’t read all the secret documents at the Office of the US Trade Representative (USTR). Judging from the Trans-Pacific Partnership (TPP) documents, the USTR advances only the interest of business, not the public.

You can picket the offices of Bell in Canada, collect arrest/citations while mugging for TV cameras at protests that disrupt traffic, etc., all the while Bell labors 24 x 7 to damage, irrevocably, the public good.

Bell and numerous others have openly declared war on the rights of the public (that includes you).

Just for your information.

September 24, 2017

Behind the First Arab Data Journalists’ Network – Open For Collaborations!

Filed under: Arabic,Journalism,News,Reporting — Patrick Durusau @ 8:23 pm

Behind the First Arab Data Journalists’ Network

From the post:

When it comes to data journalism in the Middle East, one name stands out. Amr Eleraqi is the data journalist spreading data journalism to the Middle East. In 2012, he launched infotimes.org, the first Arabic website specializing in data journalism in the region. Since then, Eleraqi and his organization have both been nominated for GEN Data Journalism Awards — once in 2015 as an individual, and the second in 2016 for the best data visualization website of the year.

His goal: to introduce Arab journalists to the concept of data visualization as a new tool for storytelling. It worked. As the site grew so did the interest of Arab journalists in the field of data journalism. So he and a team of nine recently launched the first Arab Data Journalists’ Network. Advocacy Assembly spoke with Eleraqi to learn more about the network and how it’s changing the scene for Arab journalists.

The website, Arab Data Journalists’ Network, is available in three languages (Arabic, English, French) and is focused on educational material for Arab journalists in Arabic.

The tweet from @gijn where I saw this says contact @arabdjn or @aeleraqi for collaborations!

Excellent opportunity to expand your news awareness and data journalism contacts.

Women in Data Science (~1200) – Potential Speaker List

Filed under: Data Science,Twitter — Patrick Durusau @ 3:49 pm

When I last posted about Data Science Renee‘s twitter list of women in data science in had ~632 members.

That was in April of 2016.

As of today, the list has 1,203 members! By the time you look, that number will be different again.

I call this a “potential speaker list” because not every member may be interested in your conference or have the time to attend.

Have you made a serious effort to recruit women speakers if you have not consulted this list and others like it?

Serious question.

Do you have a serious answer?

September 23, 2017

Syntacticus – Early Indo-European Languages

Filed under: Language,Linguistics — Patrick Durusau @ 4:42 pm

Syntacticus

From the about page:

Syntacticus provides easy access to around a million morphosyntactically annotated sentences from a range of early Indo-European languages.

Syntacticus is an umbrella project for the PROIEL Treebank, the TOROT Treebank and the ISWOC Treebank, which all use the same annotation system and share similar linguistic priorities. In total, Syntacticus contains 80,138 sentences or 936,874 tokens in 10 languages.

We are constantly adding new material to Syntacticus. The ultimate goal is to have a representative sample of different text types from each branch of early Indo-European. We maintain lists of texts we are working on at the moment, which you can find on the PROIEL Treebank and the TOROT Treebank pages, but this is extremely time-consuming work so please be patient!

The focus for Syntacticus at the moment is to consolidate and edit our documentation so that it is easier to approach. We are very aware that the current documentation is inadequate! But new features and better integration with our development toolchain are also on the horizon in the near future.

Language Size
Ancient Greek 250,449 tokens
Latin 202,140 tokens
Classical Armenian 23,513 tokens
Gothic 57,211 tokens
Portuguese 36,595 tokens
Spanish 54,661 tokens
Old English 29,406 tokens
Old French 2,340 tokens
Old Russian 209,334 tokens
Old Church Slavonic 71,225 tokens

The mention of Old Russian should attract attention, given the media frenzy over Russia these days. However, the data at Syntacticus is meaningful, unlike news reports that reflect Western ignorance more often than news.

You may have noticed US reports have moved from guilt by association to guilt by nationality (anyone who is Russian = Putin confidant) and are approaching guilt by proximity (citizen of any country near Russia = Putin puppet).

It’s hard to imagine a political campaign without crimes being committed by someone but traditionally, in law courts anyway, proof precedes a decision of guilt.

Looking forward to competent evidence (that’s legal terminology with a specific meaning), tested in an open proceeding against the elements of defined offenses. That’s a far cry from current discussions.

September 22, 2017

540,000 Car Tracking Devices – Leak Discovery Etiquette – #ActiveLeak

Filed under: Cybersecurity,Security — Patrick Durusau @ 8:44 pm

Passwords For 540,000 Car Tracking Devices Leaked Online by Swati Khandelwal.

From the post:

Login credentials of more than half a million records belonging to vehicle tracking device company SVR Tracking have leaked online, potentially exposing the personal data and vehicle details of drivers and businesses using its service.

Just two days ago, Viacom was found exposing the keys to its kingdom on an unsecured Amazon S3 server, and this data breach is yet another example of storing sensitive data on a misconfigured cloud server.

Stands for Stolen Vehicle Records, the SVR Tracking service allows its customers to track their vehicles in real time by attaching a physical tracking device to vehicles in a discreet location, so their customers can monitor and recover them in case their vehicles are stolen.

The leaked cache contained details of roughly 540,000 SVR accounts, including email addresses and passwords, as well as users’ vehicle data, like VIN (vehicle identification number), IMEI numbers of GPS devices.

Since the leaked passwords were stored using SHA-1, a 20-years-old weak cryptographic hash function that was designed by the US National Security Agency (NSA), which can be cracked with ease.

Interestingly, the exposed database also contained information where exactly in the car the physical tracking unit was hidden.

It’s not known if anyone else uncovered this data but as usual, there’s no penalty for misconfiguring your Amazon Web Server (AWS) S3 cloud storage bucket.

You will suffer a few minutes, perhaps hours of shame before other data leaks takes your place on the wall of shame, but it won’t be long.

But only after some enterprising security firm has discovered your error and the leak has been fixed. Translate: No adverse consequences for poor security practices. None.

When (not if) you find a mis-configured Amazon Web Server (AWS) S3 cloud storage bucket, post it with #ActiveLeak to Twitter. Makes it a race between the owner and hackers for the data.

You will still get credit for discovering the leak and the owner will learn a valuable lesson. The owner’s lesson being reinforced by whatever other consequences flow from the data leak.

MIT License Wins Converts (some anyway)

Filed under: Facebook,Licensing,Programming — Patrick Durusau @ 6:12 pm

Relicensing React, Jest, Flow, and Immutable.js by Adam Wolff.

From the post:

Next week, we are going to relicense our open source projects React, Jest, Flow, and Immutable.js under the MIT license. We’re relicensing these projects because React is the foundation of a broad ecosystem of open source software for the web, and we don’t want to hold back forward progress for nontechnical reasons.

This decision comes after several weeks of disappointment and uncertainty for our community. Although we still believe our BSD + Patents license provides some benefits to users of our projects, we acknowledge that we failed to decisively convince this community.

In the wake of uncertainty about our license, we know that many teams went through the process of selecting an alternative library to React. We’re sorry for the churn. We don’t expect to win these teams back by making this change, but we do want to leave the door open. Friendly cooperation and competition in this space pushes us all forward, and we want to participate fully.

This shift naturally raises questions about the rest of Facebook’s open source projects. Many of our popular projects will keep the BSD + Patents license for now. We’re evaluating those projects’ licenses too, but each project is different and alternative licensing options will depend on a variety of factors.

We’ll include the license updates with React 16’s release next week. We’ve been working on React 16 for over a year, and we’ve completely rewritten its internals in order to unlock powerful features that will benefit everyone building user interfaces at scale. We’ll share more soon about how we rewrote React, and we hope that our work will inspire developers everywhere, whether they use React or not. We’re looking forward to putting this license discussion behind us and getting back to what we care about most: shipping great products.

Since I bang on about Facebook‘s 24×7 censorship and shaping of your worldview, it’s only fair to mention when they make a good choice.

It in no way excuses or justifies their ongoing offenses against the public but it’s some evidence that decent people remain employed at Facebook.

With any luck, the decent insiders will wrest control of Facebook away from its government toadies and collaborators.

Leaky Media Paywalls!

Filed under: Journalism,News,Reporting — Patrick Durusau @ 5:54 pm

In paywall age, free content remains king for newspaper sites by Ariel Stulberg.

From the post:

THE MAJORITY OF AMERICA’S largest newspapers continue to employ digital subscription strategies that prioritize traffic, ad revenues, and promotion—despite the ongoing collapse of display ad rates.

Even as they’ve added paying Web subscribers by the hundreds of thousands, daily newspapers have decisively rejected an all-in approach featuring “hard” website paywalls that mimic their print business models. Instead, most are employing either “leaky” paywalls with unlimited “side doors” for non-subscribers or no paywalls at all, according to a CJR analysis of the nation’s 25 most-visited daily newspaper sites.

There was little agreement on a paywall strategy and certainly no consensus solution to the problem of the “ideal” newspaper paywall. The paywalled news sites, 15 in total, diverged widely in the cost of their subscriptions, the number of free articles dispensed, the specific combination of “side door” exceptions employed, and whether they operated via one flagship website or two—one free and one for subscribers.

Despite what seems like widespread optimism about the prospect of digital subscriptions buttressing the industry, a full 10 sites, 40 percent of the outlets we looked at, focused on ad revenue exclusively, eschewing paywalls.

News executives who spoke with CJR expressed confidence in their company’s approach and cited their favorite figures to back it up. But without examining internal data, the best way to gauge whether they were right will be to check back in a few years and see whether each is sticking with their approach. No matter the format, the prospect of news organizations relying on paywalls as primary drivers of revenue still seems remote.
… (emphasis in original)

As you might imagine, Stulberg finds the evidence is mixed on the use of paywalls, non-use of paywalls and leaky paywalls in between. Each approach has some advocates but there’s not enough accessible and representative data to reach any hard conclusions.

Still, the post provides you with a handy list of “leaky paywalls” to enjoy as part of your media experience. Just in time for the weekend as well.

Enjoy!

PS: Drop by the Donate page for the Columbia Journalism Review to support quality writing on journalism.

MS Finds Some Bug In Chrome – What Bug? Don’t Know

Filed under: Cybersecurity,Microsoft,Security — Patrick Durusau @ 4:32 pm

[$7500][765433] High CVE-2017-5121: Out-of-bounds access in V8. Reported by Jordan Rabet, Microsoft Offensive Security Research and Microsoft ChakraCore team on 2017-09-14

From Stable Channel Update for Desktop Thursday, September 21, 2017

As of 22 September 2017, 17:14 ESDT, the URL 765433 displays only a lack of access notice, for me.

Unlike hackers, who have a tradition of sharing information, Microsoft and Google believe what they know is unknown to others. That works, sort of, if your’re an ostrich, not so well in cybersecurity.

I mention this posting mostly to list some of the tools Google uses for bug testing:

AddressSanitizer

AFL

Control Flow Integrity

libFuzzer

MemorySanitizer

UndefinedBehaviorSanitizer

Enjoy!

Warrantless Stingray Unconstitutional – Ho-Hum

Filed under: Government,Privacy — Patrick Durusau @ 2:33 pm

Tracking phones without a warrant ruled unconstitutional by Lisa Vaas.

From the post:

A Washington DC Court of Appeals said on Thursday that law enforcement’s warrantless use of stingrays—suitcase-sized cell site simulators that mimic a cell tower and that trick nearby phones into connecting and giving up their identifying information and location—violates the Constitution’s Fourth Amendment protection against unreasonable search.

The ruling (PDF) overturned the conviction of a robbery and sexual assault suspect. In its decision, the DC Court of Appeals determined the use of the cell-site simulator “to locate a person through his or her cellphone invades the person’s actual, legitimate and reasonable expectation of privacy in his or her location information and is a search.”

Civil libertarians will be celebrating this decision! But the requirements of Jones vs. US are:

  1. You MUST commit a crime.
  2. You MUST be arrested for the crime in #1.
  3. You MUST be prosecuted for the crime in #1.
  4. The prosecutor MUST rely evidence from use of a warrentless stingray.
  5. The evidence in #4 MUST be crucial to proving your guilt, otherwise you are convicted on other evidence.

If any of those five requirements are missing, you don’t profit from Jones vs. US.

The exclusionary rule, the rule that excludes unconstitutionally obtained evidence sounds great, but unless you meet all its requirements, you are SOL.

For example, what if your phone and the phones of other protesters are subject to warrantless surveillance at a pro-environment rally? Or at a classic political rally? Or at a music concert? The government is just gathering data on who attended.

The exclusionary rule doesn’t do anything for you in those cases. Your identity has been unlawfully obtained, unconstitutionally as constitutional lawyers are fond of saying, but there no relief for you in Jones vs. US.

Glad the DC Circuit took that position but it has little bearing on your privacy in the streets of the United States.

Torrent Sites: Preserving “terrorist propaganda” and “evil material”

Filed under: Censorship,Cybersecurity,Free Speech,Government,Security — Patrick Durusau @ 1:37 pm

I mentioned torrent sites in Responding to Theresa May on Free Speech as a way to help preserve and spread “terrorist propaganda” and “evil material.”

My bad, I forgot to post a list of torrent sites for you to use!

Top 15 Most Popular Torrent Sites 2017 reads in part:

The list of the worlds most popular torrent sites has seen a lot of changes in recent months. While several torrent sites have shut down, some newcomers joined the list. With the shutdown of Torrentz.eu and Kickass Torrents, two of the largest sites in the torrenting scene disappeared. Since then, Torrentz2 became a popular successor of Torrentz.eu and Katcr.co is the community driven version of the former Kickass Torrents.

Finding torrents can be stressful as most of the top torrent sites are blocked in various countries. A torrent proxy let you unblock your favorite site in a few seconds.

While browsing the movies, music or tv torrents sites list you can find some good alternatives to The Pirate Bay, Extratorrent, RARBG and other commonly known sites. This list features the most popular torrent download sites:

The list changes over time so check back at Torrents.me.

As a distributed hash storage system, torrent preserves content across all the computers that downloaded the content.

Working towards the mention of torrent sites making Theresa May‘s sphincter eat her underpants. (HT, Dilbert)

Older Posts »

Powered by WordPress