Who’s like Tatum? by Peter Cook.

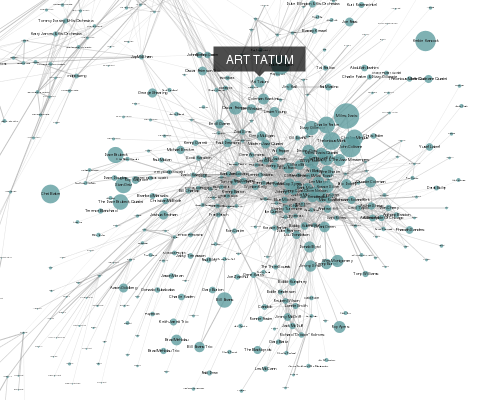
Only a small part of the jazz musical universe that awaits you at “Who’s Like Tatum?”
The description at the site reads:
Who’s like Tatum?
Art Tatum was one of the greatest jazz pianists ever. His extraordinary command of the piano was legendary and was rarely surpassed.
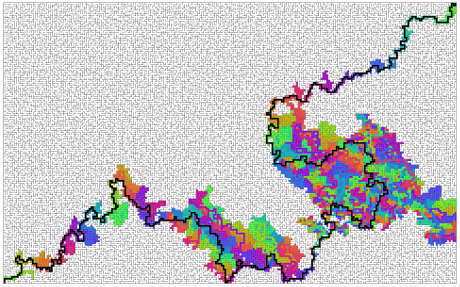
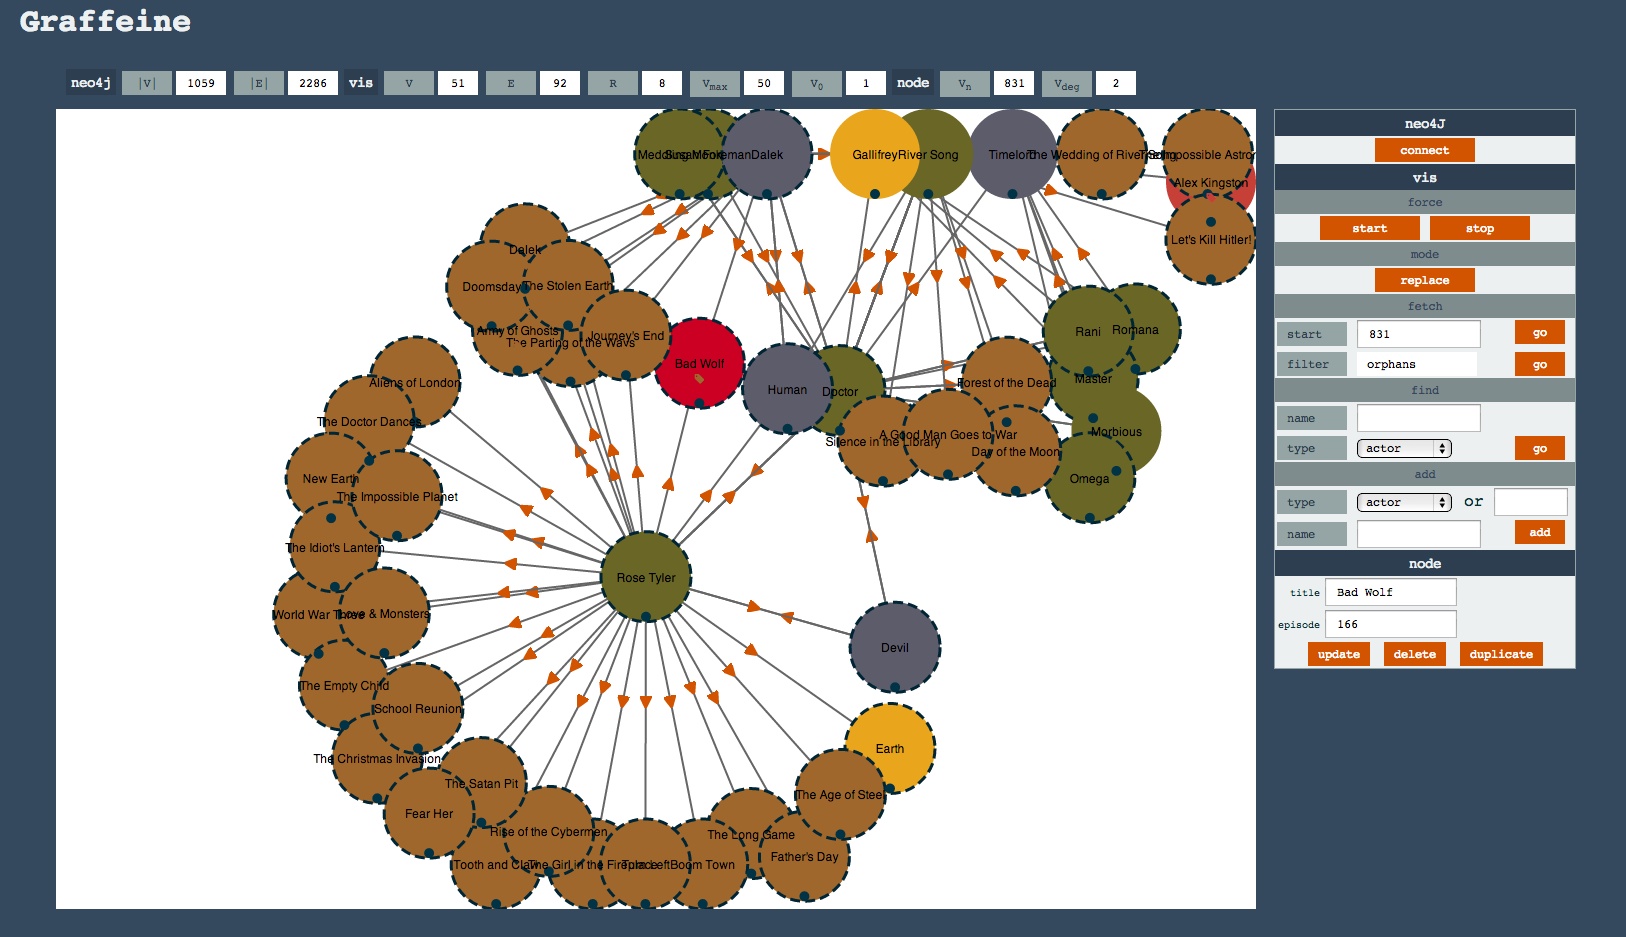
This is a network generated from Last.fm‘s similar artist data. Using Art Tatum as a starting point, I’ve recursively gathered similar artists.
The visualisation reveals some interesting clusters. To the bottom-right of Art Tatum is a cluster of be-bop musicians including Miles Davis, Charlie Parker and Thelonious Monk.
Meanwhile to the top-left of Tatum is a cluster of swing bands/musicians featuring the likes of Count Basie, Benny Goodman and a couple of Tatum’s contemporary pianists Fats Waller and Teddy Wilson. Not surprisingly we see Duke Ellington spanning the gap between these swing and be-bop musicians.
If we work counter-clockwise we can observe clusters of vocalists (e.g. Mel Tormé and Anita O’Day), country artists (e.g. Hank Williams and Loretta Lynn) and blues artists (e.g. Son House and T-Bone Walker).
It’s interesting to spot artists who span different genres such as Big Joe Turner who has links to both swing and blues artists. Might this help explain his early involvement in rock and roll?
Do explore the network yourself and see what insights you can unearth. (Can’t read the labels? Use your browser’s zoom controls!)
Designed and developed by Peter Cook. Data from the Last.fm API enquired with pylast. Network layout using D3.
At the site, mousing over the name of an artist in the description pops up their label in the graph.
As interesting as such graphs can be, what I always wonder about is the measure used for “similarity?” Or were multiple dimensions used to measure similarity?
I can enjoy and explore such a presentation but I can’t engage in a discussion with the author or anyone else about how similar or dissimilar any artist was or along what dimensions. It isn’t that those subjects are missing, but they are unrepresented so there is no place to record my input.
One of the advantages of topic maps being that you can choose which subjects you will represent and which ones you want. Which of course means anyone following you in the same topic map can add the subjects they want to discuss as well.
For a graph such as this one, represented as a topic map, I could add subjects to represent the base(s) for similarity and comments by others on the similarity or lack thereof of particular artists. Other subjects?
Or to put it more generally, how do you merge different graphs?