Another Word For It Patrick Durusau on Topic Maps and Semantic Diversity

June 30, 2016

Curse of Dimensionality Explained

Filed under: Dimension Reduction,Dimensions — Patrick Durusau @ 1:07 pm

Curse of Dimensionality Explained by Nikolay Manchev.

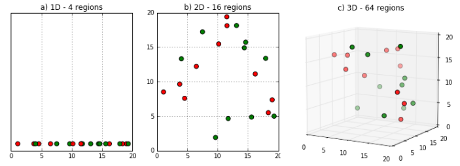
Nikolay uses the following illustration:

curse-dimensions-460

And follows with (in part):


The curse of dimensionality – as the number of dimensions increases, the number of regions grows exponentially.

This means we have to use 8’000 observations in three-dimensional space to get the same density as we would get from 20 observations in a one-dimensional space.

This illustrates one of the key effects of the curse of dimensionality – as dimensionality increases the data becomes sparse. We need to gather more observations in order to present the classification algorithm with a good space coverage. If we, however, keep increasing the number of dimensions, the number of required observations quickly goes beyond what we can hope to gather.

See Nikolay’s post for more details but I thought the illustration of sparsity induced by dimensions was worth repeating.

November 19, 2015

Infinite Dimensional Word Embeddings [Variable Representation, Death to Triples]

Infinite Dimensional Word Embeddings by Eric Nalisnick and Sachin Ravi.

Abstract:

We describe a method for learning word embeddings with stochastic dimensionality. Our Infinite Skip-Gram (iSG) model specifies an energy-based joint distribution over a word vector, a context vector, and their dimensionality, which can be defined over a countably infinite domain by employing the same techniques used to make the Infinite Restricted Boltzmann Machine (Cote & Larochelle, 2015) tractable. We find that the distribution over embedding dimensionality for a given word is highly interpretable and leads to an elegant probabilistic mechanism for word sense induction. We show qualitatively and quantitatively that the iSG produces parameter-efficient representations that are robust to language’s inherent ambiguity.

Even better from the introduction:

To better capture the semantic variability of words, we propose a novel embedding method that produces vectors with stochastic dimensionality. By employing the same mathematical tools that allow the definition of an Infinite Restricted Boltzmann Machine (Côté & Larochelle, 2015), we describe ´a log-bilinear energy-based model–called the Infinite Skip-Gram (iSG) model–that defines a joint distribution over a word vector, a context vector, and their dimensionality, which has a countably infinite domain. During training, the iSGM allows word representations to grow naturally based on how well they can predict their context. This behavior enables the vectors of specific words to use few dimensions and the vectors of vague words to elongate as needed. Manual and experimental analysis reveals this dynamic representation elegantly captures specificity, polysemy, and homonymy without explicit definition of such concepts within the model. As far as we are aware, this is the first word embedding method that allows representation dimensionality to be variable and exhibit data-dependent growth.

Imagine a topic map model that “allow[ed] representation dimensionality to be variable and exhibit data-dependent growth.

Simple subjects, say the sort you find at schema.org, can have simple representations.

More complex subjects, say the notion of “person” in U.S. statutory law (no, I won’t attempt to list them here), can extend its dimensional representation as far as is necessary.

Of course in this case, the dimensions are learned from a corpus but I don’t see any barrier to the intentional creation of dimensions for subjects and/or a combined automatic/directed creation of dimensions.

Or as I put it in the title, Death to All Triples.

More precisely, not just triples but any pre-determined limit on representation.

Looking forward to taking a slow read on this article and those it cites. Very promising.
October 25, 2014

An interactive visualization to teach about the curse of dimensionality

Filed under: Dimension Reduction,Dimensions,Visualization — Patrick Durusau @ 2:36 pm

An interactive visualization to teach about the curse of dimensionality by Jeff Leek.

From the post:

I recently was contacted for an interview about the curse of dimensionality. During the course of the conversation, I realized how hard it is to explain the curse to a general audience. One of the best descriptions I could come up with was trying to describe sampling from a unit line, square, cube, etc. and taking samples with side length fixed. You would capture fewer and fewer points. As I was saying this, I realized it is a pretty bad way to explain the curse of dimensionality in words. But there was potentially a cool data visualization that would illustrate the idea. I went to my student Prasad, our resident interactive viz design expert to see if he could build it for me. He came up with this cool Shiny app where you can simulate a number of points (n) and then fix a side length for 1-D, 2-D, 3-D, and 4-D and see how many points you capture in a cube of that length in that dimension. You can find the full app here or check it out on the blog here:

An excellent visualization of the “curse of dimensionality!”

The full app will take several seconds to redraw the screen when the length of the edge gets to .5 and above (or at least that was my experience).

July 28, 2014

Visualizing High-Dimensional Data…

Filed under: Dimension Reduction,Dimensions,High Dimensionality — Patrick Durusau @ 6:39 pm

Visualizing High-Dimensional Data in the Browser with SVD, t-SNE and Three.js by Nicolas Kruchten.

From the post:

Data visualization, by definition, involves making a two- or three-dimensional picture of data, so when the data being visualized inherently has many more dimensions than two or three, a big component of data visualization is dimensionality reduction. Dimensionality reduction is also often the first step in a big-data machine-learning pipeline, because most machine-learning algorithms suffer from the Curse of Dimensionality: more dimensions in the input means you need exponentially more training data to create a good model. Datacratic’s products operate on billions of data points (big data) in tens of thousands of dimensions (big problem), and in this post, we show off a proof of concept for interactively visualizing this kind of data in a browser, in 3D (of course, the images on the screen are two-dimensional but we use interactivity, motion and perspective to evoke a third dimension).

Both the post and the demo are very impressive!

For a compelling review, see Dimension Reduction: A Guided Tour by Christopher J.C. Burges.

Christopher captures my concern with dimensional reduction in the first sentence of the introduction:

Dimension reduction1 is the mapping of data to a lower dimensional space such that uninformative variance in the data is discarded, or such that a subspace in which the data lives is detected.

I understand the need for dimensional reduction and that it can produce useful results. But what is being missed in the “…uniformative variance in the data…” is unknown.

Not an argument against dimensional reduction but a caution to avoid quickly dismissing variation in data as “uninformative.”

August 28, 2012

‘The Algorithm That Runs the World’ [Optimization, Identity and Polytopes]

Filed under: Algorithms,Dimensions,Identification,Identity,Polytopes — Patrick Durusau @ 12:28 pm

“The Algorithm That Runs the World” by Erwin Gianchandani.

From the post:

New Scientist published a great story last week describing the history and evolution of the simplex algorithm — complete with a table capturing “2000 years of algorithms”:

The simplex algorithm directs wares to their destinations the world over [image courtesy PlainPicture/Gozooma via New Scientist].Its services are called upon thousands of times a second to ensure the world’s business runs smoothly — but are its mathematics as dependable as we thought?

YOU MIGHT not have heard of the algorithm that runs the world. Few people have, though it can determine much that goes on in our day-to-day lives: the food we have to eat, our schedule at work, when the train will come to take us there. Somewhere, in some server basement right now, it is probably working on some aspect of your life tomorrow, next week, in a year’s time.

Perhaps ignorance of the algorithm’s workings is bliss. The door to Plato’s Academy in ancient Athens is said to have borne the legend “let no one ignorant of geometry enter”. That was easy enough to say back then, when geometry was firmly grounded in the three dimensions of space our brains were built to cope with. But the algorithm operates in altogether higher planes. Four, five, thousands or even many millions of dimensions: these are the unimaginable spaces the algorithm’s series of mathematical instructions was devised to probe.

Perhaps, though, we should try a little harder to get our heads round it. Because powerful though it undoubtedly is, the algorithm is running into a spot of bother. Its mathematical underpinnings, though not yet structurally unsound, are beginning to crumble at the edges. With so much resting on it, the algorithm may not be quite as dependable as it once seemed [more following the link].

A fund manager might similarly want to arrange a portfolio optimally to balance risk and expected return over a range of stocks; a railway timetabler to decide how best to roster staff and trains; or a factory or hospital manager to work out how to juggle finite machine resources or ward space. Each such problem can be depicted as a geometrical shape whose number of dimensions is the number of variables in the problem, and whose boundaries are delineated by whatever constraints there are (see diagram). In each case, we need to box our way through this polytope towards its optimal point.

This is the job of the algorithm.

Its full name is the simplex algorithm, and it emerged in the late 1940s from the work of the US mathematician George Dantzig, who had spent the second world war investigating ways to increase the logistical efficiency of the U.S. air force. Dantzig was a pioneer in the field of what he called linear programming, which uses the mathematics of multidimensional polytopes to solve optimisation problems. One of the first insights he arrived at was that the optimum value of the “target function” — the thing we want to maximise or minimise, be that profit, travelling time or whatever — is guaranteed to lie at one of the corners of the polytope. This instantly makes things much more tractable: there are infinitely many points within any polytope, but only ever a finite number of corners.

If we have just a few dimensions and constraints to play with, this fact is all we need. We can feel our way along the edges of the polytope, testing the value of the target function at every corner until we find its sweet spot. But things rapidly escalate. Even just a 10-dimensional problem with 50 constraints — perhaps trying to assign a schedule of work to 10 people with different expertise and time constraints — may already land us with several billion corners to try out.

Apologies but I saw this article too late to post within the “free” days allowed by New Scientist.

But, I think from Erwin’s post and long quote from the original article, you can see how the simplex algorithm may be very useful where identity is defined in multidimensional space.

The literature in this area is vast and it may not offer an appropriate test for all questions of subject identity.

For example, the possessor of a credit card is presumed to be the owner of the card. Other assumptions are possible, but fraud costs are recouped from fees paid by customers. Creating a lack of interest in more stringent identity tests.

On the other hand, if your situation requires multidimensional identity measures, this may be a useful approach.


PS: Be aware that naming confusion, the sort that can be managed (not solved) by topic maps abounds even in mathematics:

The elements of a polytope are its vertices, edges, faces, cells and so on. The terminology for these is not entirely consistent across different authors. To give just a few examples: Some authors use face to refer to an (n−1)-dimensional element while others use face to denote a 2-face specifically, and others use j-face or k-face to indicate an element of j or k dimensions. Some sources use edge to refer to a ridge, while H. S. M. Coxeter uses cell to denote an (n−1)-dimensional element. (Polytope)

June 28, 2012

Clustering high dimensional data

Filed under: Clustering,Dimension Reduction,Dimensions,High Dimensionality — Patrick Durusau @ 6:32 pm

Clustering high dimensional data by Ira Assent. (Assent, I. (2012), Clustering high dimensional data. WIREs Data Mining Knowl Discov, 2: 340–350. doi: 10.1002/widm.1062)

Abstract:

High-dimensional data, i.e., data described by a large number of attributes, pose specific challenges to clustering. The so-called ‘curse of dimensionality’, coined originally to describe the general increase in complexity of various computational problems as dimensionality increases, is known to render traditional clustering algorithms ineffective. The curse of dimensionality, among other effects, means that with increasing number of dimensions, a loss of meaningful differentiation between similar and dissimilar objects is observed. As high-dimensional objects appear almost alike, new approaches for clustering are required. Consequently, recent research has focused on developing techniques and clustering algorithms specifically for high-dimensional data. Still, open research issues remain. Clustering is a data mining task devoted to the automatic grouping of data based on mutual similarity. Each cluster groups objects that are similar to one another, whereas dissimilar objects are assigned to different clusters, possibly separating out noise. In this manner, clusters describe the data structure in an unsupervised manner, i.e., without the need for class labels. A number of clustering paradigms exist that provide different cluster models and different algorithmic approaches for cluster detection. Common to all approaches is the fact that they require some underlying assessment of similarity between data objects. In this article, we provide an overview of the effects of high-dimensional spaces, and their implications for different clustering paradigms. We review models and algorithms that address clustering in high dimensions, with pointers to the literature, and sketch open research issues. We conclude with a summary of the state of the art.

The author has a clever example (figure 4) of why adding dimensions can decrease the discernment of distinct groups in data. A problem that worsens as the number of dimensions increases.

Or does it? Or is it the case that by weighting all dimensions equally we get the result we deserve?

My counter-example would be introducing you to twin sisters. As the number of dimensions increased, so would the similarity that would befoul any clustering algorithm.

But the important dimension, their names, is sufficient to cluster attributes around the appropriate data points.

Is the “curse of dimensionality” rather a “failure to choose dimensions wisely?”

December 28, 2011

Visualizing 4+ Dimensions

Filed under: Dimension Reduction,Dimensions,Mathematics — Patrick Durusau @ 9:36 pm

Visualizing 4+ Dimensions

From the post:

When people realize that I study pure math, they often ask about how to visualize four or more dimensions. I guess it’s a natural question to ask, since mathematicians often have to deal with very high (and sometimes infinite) dimensional objects. Yet people in pure math never really have this problem.

Pure mathematicians might like you to think that they’re just that much smarter. But frankly, I’ve never had to visualize anything high-dimensional in my pure math classes. Working things out algebraically is much nicer, and using a lower-dimensional object as an example or source of intuition usually works out — at least at the undergrad level.

But that’s not a really satisfying answer, for two reasons. One is that it is possible to visualize high-dimensional objects, and people have developed many ways of doing so. Dimension Math has on its website a neat series of videos for visualizing high-dimensional geometric objects using stereographic projection. The other reason is that while pure mathematicians do not have a need for visualizing high-dimensions, statisticians do. Methods of visualizing high dimensional data can give useful insights when analyzing data.

This is an important area for study, but not only because identifications can consist of values in multiple dimensions.

It is important because the recognition of an identifier can also consist of values spread across multiple dimensions.

More on that second statement before year’s end (so you don’t have to wait very long, just until holiday company leaves).

I first saw this in Christophe Lalanne’s A bag of tweets / Dec 2011.

December 14, 2011

The Shape of Things – SHAPES 1.0

Filed under: Conferences,Dimensions,Semantics,Shape — Patrick Durusau @ 7:44 pm

The Shape of Things – SHAPES 1.0

Proceedings of the First Interdisciplinary Workshop on SHAPES, Karlsruhe, Germany, September 27, 2011. Edited by: Janna Hastings, Oliver Kutz, Mehul Bhatt, Stefano Borgo

If you have ever thought of “shape” as being a simple issue, consider the abstract from “Shape is a Non-Quantifiable Physical Dimension” by Ingvar Johansson:

In the natural-scientific community it is often taken for granted that, sooner or later, all basic physical property dimensions can be quantified and turned into a kind-of-quantity; meaning that all their possible determinate properties can be put in a one-to-one correspondence with the real numbers. By using some transfinite mathematics, the paper shows this tacit assumption to be wrong. Shape is a very basic property dimension; but, since it can be proved that there are more possible kinds of determinate shapes than real numbers, shape cannot be quantified. There will never be a shape scale the way we have length and temperature scales. This is the most important conclusion, but more is implied by the proof. Since every n-dimensional manifold has the same cardinality as the real number line, all shapes cannot even be represented in a three-dimensional manifold the way perceivable colors are represented in so-called color solids.

If shape, which exists in metric space has these issues, that casts a great deal of doubt on mapping semantics, which exists in non-metric space, in a “…one-to-one correspondence with real numbers.”

Don’t you think?

We can make simplifying assumptions about semantics and make such mappings, but we need to be aware that is what is happening.

December 3, 2011

tutorial draft on curse of dimensionality

Filed under: Dimensions — Patrick Durusau @ 8:19 pm

tutorial draft on curse of dimensionality

From the post:

Curse of dimensionality is a widely heard of, largely misunderstood concept in machine learning. There is one single explanation of it circulating, but there is more to it. I will explain what is the curse, and how it complicates everything.

I don’t follow hockey but the example would be easy enough to adapt by subject domain.

The author illustrates one problem with dimensionality and promises to discuss others.

I say “the author” because this is one of those blogs where identification of the author isn’t clear. In academic discussions that is more than a little annoying.

Good illustration of the problem and points for that.

September 12, 2011

QUDT – Quantities, Units, Dimensions and Data Types in OWL and XML

Filed under: Data Types,Dimensions,Ontology,OWL,Quantities,Units — Patrick Durusau @ 8:29 pm

QUDT – Quantities, Units, Dimensions and Data Types in OWL and XML

From background:

The QUDT Ontologies, and derived XML Vocabularies, are being developed by TopQuadrant and NASA. Originally, they were developed for the NASA Exploration Initiatives Ontology Models (NExIOM) project, a Constellation Program initiative at the AMES Research Center (ARC). The goals of the QUDT ontology are twofold:

  • to provide a unified model of, measurable quantities, units for measuring different kinds of quantities, the numerical values of quantities in different units of measure and the data structures and data types used to store and manipulate these objects in software;
  • to populate the model with the instance data (quantities, units, quantity values, etc.) required to meet the life-cycle needs of the Constellation Program engineering community.

If you are looking for measurements, this would be one place to start.

Powered by WordPress