Another Word For It Patrick Durusau on Topic Maps and Semantic Diversity

August 2, 2017

It’s more than just overlap: Text As Graph

Filed under: Graphs,Humanities,Hyperedges,Hypergraphs,Texts,XML — Patrick Durusau @ 12:57 pm

It’s more than just overlap: Text As Graph – Refining our notion of what text really is—this time for sure! by Ronald Haentjens Dekker and David J. Birnbaum.

Abstract:

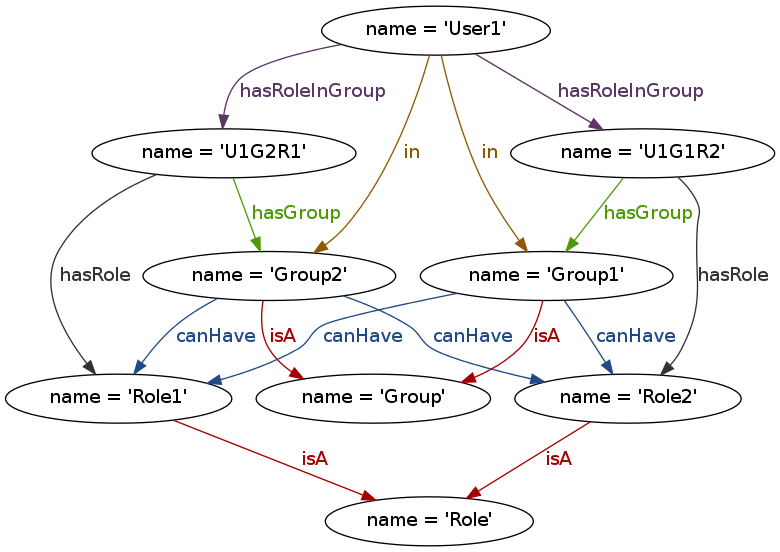
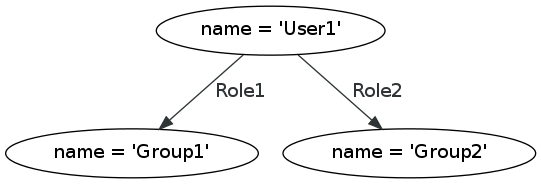
The XML tree paradigm has several well-known limitations for document modeling and processing. Some of these have received a lot of attention (especially overlap), and some have received less (e.g., discontinuity, simultaneity, transposition, white space as crypto-overlap). Many of these have work-arounds, also well known, but—as is implicit in the term “work-around”—these work-arounds have disadvantages. Because they get the job done, however, and because XML has a large user community with diverse levels of technological expertise, it is difficult to overcome inertia and move to a technology that might offer a more comprehensive fit with the full range of document structures with which researchers need to interact both intellectually and programmatically. A high-level analysis of why XML has the limitations it has can enable us to explore how an alternative model of Text as Graph (TAG) might address these types of structures and tasks in a more natural and idiomatic way than is available within an XML paradigm.

Hyperedges, texts and XML, what more could you need? 😉

This paper merits a deep read and testing by everyone interested in serious text modeling.

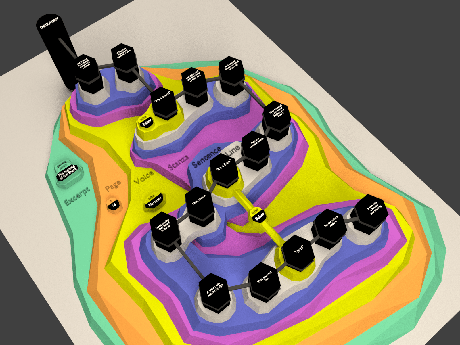
You can’t read the text but here is a hypergraph visualization of an excerpt from Lewis Carroll’s “The hunting of the Snark:”

The New Testament, the Hebrew Bible, to say nothing of the Rabbinic commentaries on the Hebrew Bible and centuries of commentary on other texts could profit from this approach.

Put your text to the test and share how to advance this technique!

December 23, 2013

Graph for Scala

Filed under: Graphs,Hyperedges,Hypergraphs,Scala — Patrick Durusau @ 3:14 pm

Graph for Scala

From the webpage:

Welcome to scalax.collection.Graph

Graph for Scala provides basic graph functionality that seamlessly fits into the Scala standard collections library. Like members of scala.collection, graph instances are in-memory containers that expose a rich, user-friendly interface.

Graph for Scala also has ready-to-go implementations of JSON-Import/Export and Dot-Export. Database emulation and distributed graph processing are due to be supported.

Backed by the Scala core team, Graph for Scala started in 2011 as an open source project in the EPFL Scala incubator space on Assembla. Meanwhile it is also hosted on Github.

Want to take it for a spin? Grab the latest release to get started, then visit the Core User Guide (Warning: Broken Link)to learn more!

If you follow the “Core” option under “Users Guides” on the top menu bar, you will find: Core User Guide: Introduction, which reads in part:

Why Use Graph for Scala?

The most important reasons why Graph for Scala speeds up your development are:

  • Simplicity: Creating, manipulating and querying Graph is intuitive.
  • Consistency: Graph for Scala seamlessly maintains a consistent state of nodes and edges including prevention of duplicates, intelligent addition and removal.
  • Conformity: As a regular collection class, Graph has the same “look and feel” as other members of the Scala collection framework. Whenever appropriate, result types are Scala collection types themselves.
  • Flexibility: All kinds of graphs including mixed graphs, multi-graphs and hypergraphs are supported.
  • Functional Style: Graph for Scala facilitates a concise, functional style of utilizing graph functionality, including traversals, not seen in Java-based libraries.
  • Extendibility: You can easily customize Graph for Scala to reflect the needs of you application retaining all benefits of Graph.
  • Documentation: Ideal progress curve through adequate documentation.

Look and see!

You will find support for hyperedges, directed hyperedges, edges and directed edges.

Further documentation covers exporting to Dot, moving data into and out of JSON, and constraining graphs.

February 14, 2013

HyperGraphDB: A Generalized Graph Database

Filed under: Hyperedges,Hypergraphs — Patrick Durusau @ 2:11 pm

HyperGraphDB: A Generalized Graph Database by Borislav Iordanov.

Abstract:

We present HyperGraphDB, a novel graph database based on generalized hypergraphs where hyperedges can contain other hyperedges. This generalization automatically reifies every entity expressed in the database thus removing many of the usual difficulties in dealing with higher-order relationships. An open two-layered architecture of the data organization yields a highly customizable system where specific domain representations can be optimized while remaining within a uniform conceptual framework. HyperGraphDB is an embedded, transactional database designed as a universal data model for highly complex, large scale knowledge representation applications such as found in artificial intelligence, bioinformatics and natural language processing.

A formal treatment of HyperGraphDB.

Merits being printed out and given a slow read.

Borisla comments on both RDF and Topic Maps:

…Two other prominent issues are contextuality (scoping) and reification.

Those and other considerations from semantic web research disappear or find natural solutions in the model implemented by HyperGraphDB.

But when I search the paper, scoping comes up in an NLP example as:

The tree-like structure of the document is also recorded in HyperGraphDB with scoping parent-child binary links between (a) the document and its paragraphs, (b) a paragraph and its sentences, (c) a sentence and each linguistic relationship inferred from it.

Scoping at least in one sense of the word, but not the in the sense of say a name being “scoped” by the language French.

Reification, other than the discussion of RDF and topic maps, doesn’t appear again in the paper.

As I said, it needs a slow read but if you see something about scoping and/or reification that I have missed, please give a shout!

Hypergraph-based multidimensional data modeling…

Filed under: Graphs,Hyperedges,Hypergraphs,Networks — Patrick Durusau @ 1:48 pm

Hypergraph-based multidimensional data modeling towards on-demand business analysis by Duong Thi Anh Hoang, Torsten Priebe and A. Min Tjoa. (Proceeding iiWAS ’11 Proceedings of the 13th International Conference on Information Integration and Web-based Applications and Services Pages 36-43 )

Abstract:

In the last few years, web-based environments have witnessed the emergence of new types of on-demand business analysis that facilitate complex and integrated analytical information from multidimensional databases. In these on-demand environments, users of business intelligence architectures can have very different reporting and analytical needs, requiring much greater flexibility and adaptability of today’s multidimensional data modeling. While structured data models for OLAP have been studied in detail, a majority of current approaches has not put its focus on the dynamic aspect of the multidimensional design and/or semantic enriched impact model. Within the scope of this paper, we present a flexible approach to model multidimensional databases in the context of dynamic web-based analysis and adaptive users’ requirements. The introduced formal approach is based on hypergraphs with the ability to provide formal constructs specifying the different types of multidimensional elements and relationships which enable the support of highly customized business analysis. The introduced hypergraphs are used to formally define the semantics of multidimensional models with unstructured ad-hoc analytic activities. The proposed model also supports a formal representation of advanced concepts like dynamic hierarchies, many-to-many associations, additivity constraints etc. Some scenario example are also provided to motivate and illustrate the proposed approach.

If you like illustrations of technologies with examples from the banking industry, this is the paper on hypergraphs for you.

Besides, banks are where they keep the money. 😉

Seriously, a very well illustrated introduction to the use of hypergraphs and multidimensional data modeling, plus why multidimensional data models matter to clients. (Another place where they keep money.)

July 23, 2012

Hypergraphs and Colored Maps

Filed under: Graphs,Hyperedges,Hypergraphs — Patrick Durusau @ 6:42 am

Hypergraphs and Colored Maps by James Mallos.

From the post:

A graph, in general terms, is a set of vertices connected by edges. Finding good colorings for the vertices (or edges) of a graph may seem like a hobby interest, but, in fact, graphs bearing certain rule-based colorings represent mathematical objects that are more general than graphs themselves. By bearing colors, graphs let us see objects that could not be quite so easily drawn.

I discovered James’ site, Weave Anything while searching for blogs on hypergraphs.

I recommend it as an entertaining way to learn more about graphs, hypergraphs, hypermaps and similar structures.

May 11, 2012

Clustering by hypergraphs and dimensionality of cluster systems

Filed under: Clustering,Graphs,Hyperedges,Hypergraphs — Patrick Durusau @ 6:39 pm

Clustering by hypergraphs and dimensionality of cluster systems by S. Albeverio and S.V. Kozyrev.

Abstract:

In the present paper we discuss the clustering procedure in the case where instead of a single metric we have a family of metrics. In this case we can obtain a partially ordered graph of clusters which is not necessarily a tree. We discuss a structure of a hypergraph above this graph. We propose two definitions of dimension for hyperedges of this hypergraph and show that for the multidimensional p-adic case both dimensions are reduced to the number of p-adic parameters.

We discuss the application of the hypergraph clustering procedure to the construction of phylogenetic graphs in biology. In this case the dimension of a hyperedge will describe the number of sources of genetic diversity.

A pleasant reminder that hypergraphs and hyperedges are simplifications of the complexity we find in nature.

If hypergraphs/hyperedges are simplifications, what would you call a graph/edges?

A simplification of a simplification?

Graphs are useful sometimes.

Useful sometimes doesn’t mean useful at all times.

March 30, 2012

Neo4j – Hyperedges and Cypher – Suggested Revisions

Filed under: Cypher,Graphs,Hyperedges,Hypergraphs,Neo4j — Patrick Durusau @ 4:40 pm

Recently “Hyperedges and Cypher” was cited to illustrate “improvements” to Neo4j documentation. It is deeply problematic.

The first paragraph and header read:

5.1 Hyperedges and Cypher

Imagine a user being part of different groups. A group can have different roles, and a user can be part of different groups. He also can have different roles in different groups apart from the membership. The association of a User, a Group and a Role can be referred to as a HyperEdge. However, it can be easily modeled in a property graph as a node that captures this n-ary relationship, as depicted below in the U1G2R1 node.

This is the first encounter of hyperedge (other than in the table of contents) for the reader. The manual offers no definition for or illustration of a “hyperedge.”

When terms are introduced, they need to be defined.

Here is the Neo4j illustration for the preceding description (from the latest milestone release):

Neo4j-Cypher-HyperEdge

I don’t get that graph from the description in the text.

This graph comes closer:

User-Roles-Group

You may object that role1 and role2 should be nodes rather than an edges, but that is a modeling decision, another area where the Neo4j manual is weak. The reader doesn’t share in that process, nodes and edges suddenly appear and the reader must work out why?

If the current prose were cleaned up, by providing a better prose description, modeling choices and alternatives could be illustrated, along with Cypher queries.

On hypergraphs/hyperedges:

A user having different roles in different groups could be modeled with a hyperedge, but not necessarily so. If Neo4j isn’t going to support hyperedges, why bring it up? Show the modeling that Neo4j does support.

If I were going to discuss hyperedges/hypergraphs at all, I would point out examples of where they are used, along with citations to the literature.

Powered by WordPress