Another Word For It Patrick Durusau on Topic Maps and Semantic Diversity

October 5, 2017

Visualizing Nonlinear Narratives with Story Curves [Nonlinear Investigations, Markup, Statements]

Filed under: Literature,Narrative,Nonlinear Models,Visualization — Patrick Durusau @ 3:44 pm

Visualizing Nonlinear Narratives with Story Curves by Nam Wook Kim, et al.

From the webpage:

A nonlinear narrative is a storytelling device that portrays events of a story out of chronological order, e.g., in reverse order or going back and forth between past and future events. Story curves visualize the nonlinear narrative of a movie by showing the order in which events are told in the movie and comparing them to their actual chronological order, resulting in possibly meandering visual patterns in the curve. We also developed Story Explorer, an interactive tool that visualizes a story curve together with complementary information such as characters and settings. Story Explorer further provides a script curation interface that allows users to specify the chronological order of events in movies. We used Story Explorer to analyze 10 popular nonlinear movies and describe the spectrum of narrative patterns that we discovered, including some novel patterns not previously described in the literature. (emphasis in original)

Applied here to movie scripts, an innovative visualization that has much broader application.

Investigations by journalists or police officers don’t develop in linear fashion. There are leaps forwards and backwards in time as a narrative is assembled. The resulting “linear” narrative bears little resemblance to its construction.

Imagine being able to visualize and compare the nonlinear narratives of multiple witnesses to a series of events. Use of the same nonlinear sequence isn’t proof they are lying but should suggest at least coordination of their testimony.

Linear markup systems struggle with nonlinear narratives and there may be value here for at least visualizing those pinch points.

Sadly the code for Story Curve and Story Explorer is temporarily unavailable as of 5 October 2017. Hoping that gets sorted out in the near future.
December 16, 2015

Avoiding the Trap of Shallow Narratives

Filed under: Journalism,Narrative,News,Reporting — Patrick Durusau @ 8:42 pm

Avoiding the Trap of Shallow Narratives by Tiff Fehr.

From the post:


When we elevate immediate reactions to the same level as more measured narratives, we spring a trap on ourselves and our readers. I believe by the end of 2016, we will know if a “trap” is the right description. 2016 is going to be turbulent for news and news-reading audiences, which will add to the temptation to chase traffic via social-focused follow-on stories, and perhaps more of clickbait’s “leftover rehash.” Maybe we’ll even tweak them so they’re not “a potential letdown,” too: “Nine Good Things in the SCOTUS Brawl at the State of the Union.”

A great read on a very serious problem, if your goal is to deliver measured narratives of current events to readers.

Shallow narratives are not a problem if your goals are:

  • First, even if wrong, is better than being second
  • Headlines are judged by “click-through” rates
  • SEO drives the vocabulary of stories

This isn’t a new issue. Before social media, broadcast news was too short to present any measured narrative. It could signal events that needed measured narrative but it wasn’t capable of delivering it.

No one watched the CBS Evening News with Walter Cronkite to see a measured narrative about the Vietnam War. For that you consulted Foreign Affairs or any number of other history/policy sources.

That’s not a dig at broadcast journalism in general or CBS/Cronkite in particular. Each medium has its limits and Cronkite knew those limits as well as anyone. He would have NOT warned anyone off who was seeking “measured narrative” to supplement his reports.

The article I mentioned earlier about affective computing, We Know How You Feel from the New Yorker, qualifies as a measured narrative.

As an alternative, consider the shallow narrative: Mistrial in Freddie Gray Death. Testimony started December 2nd and the entire story is compressed into 1,564 words? Really?

Would anyone consider that to be a “measured narrative?” Well, other than its authors and colleagues who might fear a similar evaluation of their work?

You can avoid the trap of shallow narratives but that will depend upon the forum you choose for your content. Pick something like CNN and there isn’t anything but shallow narrative. Or at least that is the experience to date.

Your choice of forum has a much to do with avoiding shallow narrative as any other factor.

Choose wisely.

December 12, 2015

DataGenetics (blog)

Filed under: Data Science,Mathematical Reasoning,Narrative,Reasoning — Patrick Durusau @ 5:09 pm

DataGenetics (blog) by Nick Berry.

I mentioned Nick’s post Estimating “known unknowns” but his blog merits more than a mention of that one post.

As of today, Nick has 217 posts that touch on topics relevant to data science and have illustrations that make them memorable. You will remember those illustrations for discussions among data scientists, customers and even data science interviewers.

Follow Berry’s posts long enough and you may acquire the skill of illustrating data science ideas and problems in straight-forward prose.

Good luck!

July 21, 2015

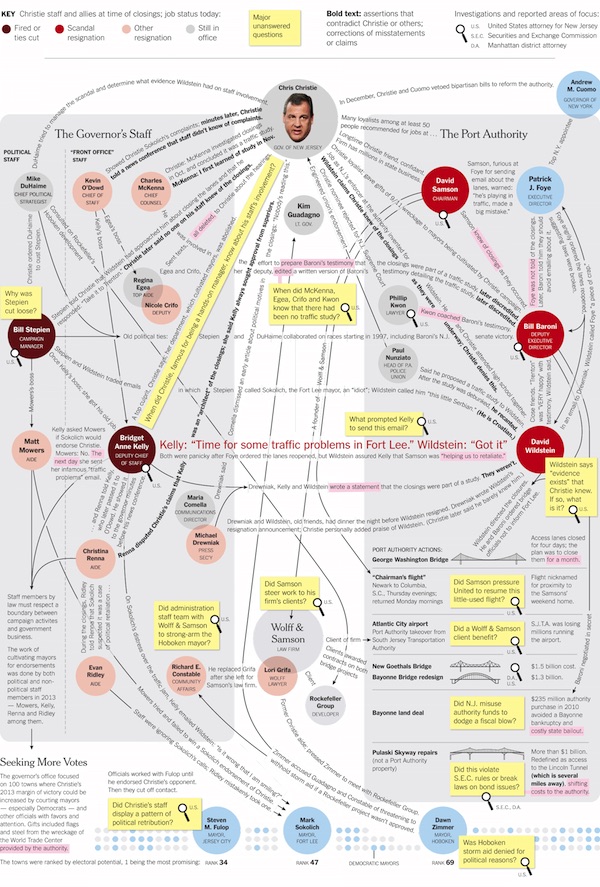
Fusing Narrative with Graphs

Filed under: Graphs,Narrative — Patrick Durusau @ 3:46 pm

Quest for a Narrative Representation of Power Relations by Lambert Strether.

Lamber is looking to meet these requirements:

  1. Be generated algorithmically from data I control….
  2. Have narrative labels on curved arcs. … The arcs must be curved, as the arcs in Figure1 are curved, to fit the graph within the smallest possible (screen) space.
  3. Be pretty. There is an entire literature devoted to making “pretty” graph, starting with making sure arcs don’t cross each other….

The following map was hand crafted and it meets all the visual requirements:

1_full_times_christie

Check out the original here.

Lambert goes on a search for tools that come close to this presentation and also meet the requirements set forth above.

The idea of combining graphs with narrative snippets as links is a deeply intriguing one. Rightly or wrongly I think of it as illustrated narrative but without the usual separation between those two elements.

Suggestions?

October 19, 2014

DeepView: Computational Tools for Chess Spectatorship [Knowledge Retention?]

Filed under: Games,Knowledge Retention,Narrative — Patrick Durusau @ 3:34 pm

DeepView: Computational Tools for Chess Spectatorship by Greg Borenstein, Prof. Kevin Slavin, Grandmaster Maurice Ashley.

From the post:

DeepView is a suite of computational and statistical tools meant to help novice viewers understand the drama of a high-level chess match through storytelling. Good drama includes characters and situations. We worked with GM Ashley to indentify the elements of individual player’s styles and the components of an ongoing match that computation could analyze to help bring chess to life. We gathered an archive of more than 750,000 games from chessgames.com including extensive collections of games played by each of the grandmasters in the tournament. We then used the Stockfish open source chess engine to analyze the details of each move within these games. We combined these results into a comprehensive statistical analysis that provided us with meaningful and compelling information to pass on to viewers and to provide to chess commentators to aid in their work.

The questions we answered include:

In addition to making chess more accessible to novice viewers, we believe that providing access to these kinds of statistics will change how expert players play chess, allowing them to prepare differently for specific opponents and to detect limitations or quirks in their own play.

Further, we believe that the techniques used here could be applied to other sports and games as well. Specifically we wonder why traditional sports broadcasting doesn’t use measures of significance to filter or interpret the statistics they show to their viewers. For example, is a batter’s RBI count actually informative without knowing whether it is typical or extraordinary compared to other players? And when it comes to eSports with their exploding viewer population, this approach points to rich possibilities improving the spectator experience and translating complex gameplay so it is more legible for novice fans.

A deeply intriguing notion of mining data to extract patterns that are fashioned into a narrative by an expert.

Participants in the games were not called upon to make explicit the tacit knowledge they unconsciously rely upon to make decisions. Instead, decisions (moves) were collated into patterns and an expert recognized those patterns to make the tacit knowledge explicit.

Outside of games would this be a viable tactic for knowledge retention? Not asking employees/experts but recording their decisions and mining those for later annotation?

May 31, 2014

North American Slave Narratives

Filed under: Biography,Data,Narrative — Patrick Durusau @ 3:33 pm

North American Slave Narratives

A listing of autobiographies in chronological order, starting from 1740 to 1999.

A total of two hundred and four (204) biographies and a large number of them are available online.

A class project to weave these together with court records, journals, newspapers and the like would be a good use case for topic maps.

May 16, 2014

Comparison of Corpora through Narrative Structure

Filed under: Computational Linguistics,Corpora,Narrative — Patrick Durusau @ 7:24 pm

Comparison of Corpora through Narrative Structure by Dan Simonson.

A very interesting slide deck from a presentation on how news coverage of police activity may have changed from before and after September 11th.

An early slide that caught my attention:

As a computational linguist, I can study 106 —instead of 100.6 —documents.

The sort of claim that clients might look upon with favor.

I first saw this in a tweet by Dominique Mariko.

February 18, 2014

Periodic Table of Storytelling

Filed under: Narrative,Storyboarding — Patrick Durusau @ 4:35 pm

Periodic Table of Storytelling by James Harris.

A periodic table that reads in part, from left to right:

Structure: Setting, Laws, plots: Story modifiers: Plot Devices:…

Some of the elements are amusing:

  • Sealed Evil in a Can
  • Moral Event Horizon
  • Amoral Attorney (redundant?)

There are many more where those came from!

January 28, 2014

Visualization of Narrative Structure

Filed under: Graphics,Narrative,Visualization — Patrick Durusau @ 3:49 pm

Visualization of Narrative Structure. Created by Natalia Bilenko and Asako Miyakawa.

From the webpage:

Can books be summarized through their emotional trajectory and character relationships? Can a graphic representation of a book provide an at-a-glance impression and an invitation to explore the details?

We visualized character interactions and relative emotional content for three very different books: a haunting memory play, a metaphysical mood piece, and a children’s fantasy classic. A dynamic graph of character relationships displays the evolution of connections between characters throughout the book. Emotional strength and valence of each sentence are shown in a color-coded sentiment plot. Hovering over the sentence bars reveals the text of the original sentences. The emotional path of each character through the book can be traced by clicking on the character names in the graph. This highlights the corresponding sentences in the sentiment plot where that character appears. Click on the links below to see each visualization.

Best viewed in Google Chrome at 1280×800 resolution.

Visualizations of:

The Hobbit by J.R.R. Tolkien.

Kafka on the shore by Haruki Murakami.

The Glass Menagerie by Tennessee Williams.

Reading of any complex narrative would be enhanced by the techniques used here.

I first saw this in a tweet by Christophe Viau.

December 3, 2011

Detecting Structure in Scholarly Discourse

Filed under: Computational Linguistics,Conferences,Discourse,Narrative — Patrick Durusau @ 8:20 pm

Detecting Structure in Scholarly Discourse (DSSD2012)

Important Dates:

March 11, 2012 Submission Deadline
April 15, 2012 Notification of acceptance
April 30, 2012 Camera-ready papers due
July 12 or 13, 2012 Workshop

From the Call for Papers:

The detection of discourse structure in scientific documents is important for a number of tasks, including biocuration efforts, text summarization, error correction, information extraction and the creation of enriched formats for scientific publishing. Currently, many parallel efforts exist to detect a range of discourse elements at different levels of granularity and for different purposes. Discourse elements detected include the statement of facts, claims and hypotheses, the identification of methods and protocols, and as the differentiation between new and existing work. In medical texts, efforts are underway to automatically identify prescription and treatment guidelines, patient characteristics, and to annotate research data. Ambitious long-term goals include the modeling of argumentation and rhetorical structure and more recently narrative structure, by recognizing ‘motifs’ inspired by folktale analysis.

A rich variety of feature classes is used to identify discourse elements, including verb tense/mood/voice, semantic verb class, speculative language or negation, various classes of stance markers, text-structural components, or the location of references. These features are motivated by linguistic inquiry into the detection of subjectivity, opinion, entailment, inference, but also author stance and author disagreement, motif and focus.

Several workshops have been focused on the detection of some of these features in scientific text, such as speculation and negation in the 2010 workshop on Negation and Speculation in Natural Language Processing and the BioNLP’09 Shared Task, and hedging in the CoNLL-2010 Shared Task Learning to detect hedges and their scope in natural language textM. Other efforts that have included a clear focus on scientific discourse annotation include STIL2011 and Force11, the Future of Research Communications and e-Science. There have been several efforts to produce large-scale corpora in this field, such as BioScope, where negation and speculation information were annotated, and the GENIA Event corpus.

The goal of the 2012 workshop Detecting Structure in Scholarly Discourse is to discuss and compare the techniques and principles applied in these various approaches, to consider ways in which they can complement each other, and to initiate collaborations to develop standards for annotating appropriate levels of discourse, with enhanced accuracy and usefulness.

This conference is being held in conjunction with ACL 2012.

Powered by WordPress