Elon Musk merits many kudos for the recent SpaceX success.
At the same time, Elon has been nominated for Luddite of the Year, along with Bill Gates and Stephen Hawking, for fanning fears of artificial intelligence.
One favorite target for such fears are autonomous weapons systems. Hannah Junkerman annotated a list of 18 posts, articles and books on such systems for Just Security.
While moralists are wringing their hands, military forces have not let grass grow under their feet with regard to autonomous weapon systems. As Michael Carl Haas reports in Autonomous Weapon Systems: The Military’s Smartest Toys?:
…
Military forces that rely on armed robots to select and destroy certain types of targets without human intervention are no longer the stuff of science fiction. In fact, swarming anti-ship missiles that acquire and attack targets based on pre-launch input, but without any direct human involvement—such as the Soviet Union’s P-700 Granit—have been in service for decades. Offensive weapons that have been described as acting autonomously—such as the UK’s Brimstone anti-tank missile and Norway’s Joint Strike Missile—are also being fielded by the armed forces of Western nations. And while governments deny that they are working on armed platforms that will apply force without direct human oversight, sophisticated strike systems that incorporate significant features of autonomy are, in fact, being developed in several countries.
In the United States, the X-47B unmanned combat air system (UCAS) has been a definite step in this direction, even though the Navy is dodging the issue of autonomous deep strike for the time being. The UK’s Taranis is now said to be “merely” semi-autonomous, while the nEUROn developed by France, Greece, Italy, Spain, Sweden and Switzerland is explicitly designed to demonstrate an autonomous air-to-ground capability, as appears to be case with Russia’s MiG Skat. While little is known about China’s Sharp Sword, it is unlikely to be far behind its competitors in conceptual terms.
…
The reasoning of military planners in favor of autonomous weapons systems isn’t hard to find, especially when one article describes air-to-air combat between tactically autonomous and machine-piloted aircraft versus piloted aircraft this way:
…
This article claims that a tactically autonomous, machine-piloted aircraft whose design capitalizes on John Boyd’s observe, orient, decide, act (OODA) loop and energy-maneuverability constructs will bring new and unmatched lethality to air-to-air combat. It submits that the machine’s combined advantages applied to the nature of the tasks would make the idea of human-inhabited platforms that challenge it resemble the mismatch depicted in The Charge of the Light Brigade.
…
Here’s the author’s mock-up of sixth-generation approach:
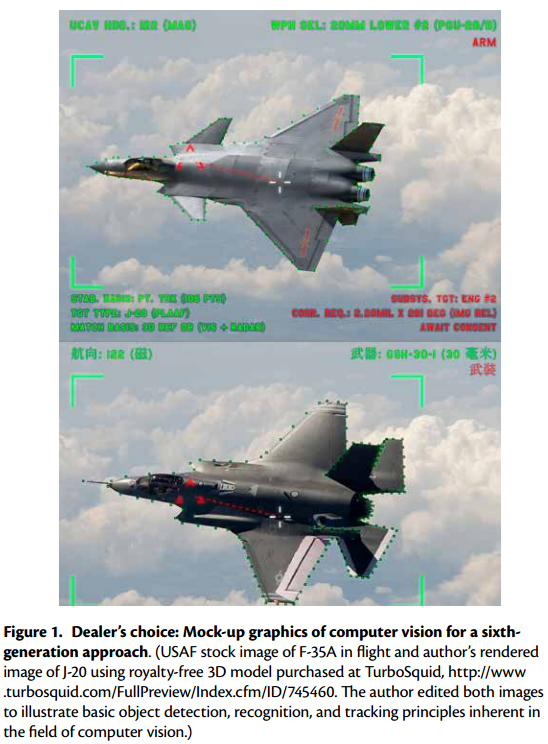
(Select the image to see an undistorted view of both aircraft.)
Given the strides being made on the use of neural networks, I would be surprised if they are not at the core of present and future autonomous weapons systems.
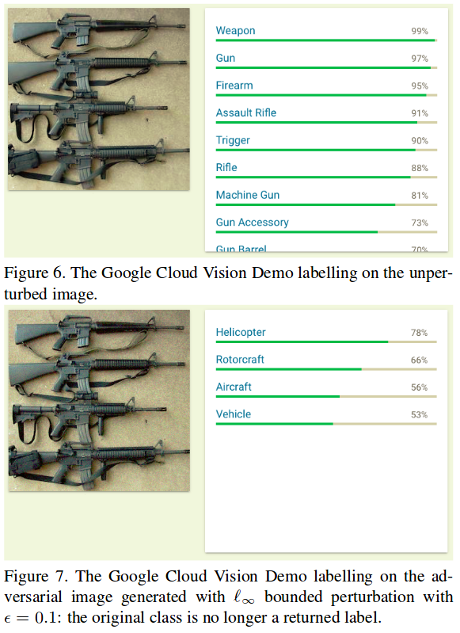
You can join the debate about the ethics of autonomous weapons but the more practical approach is to read How to trick a neural network into thinking a panda is a vulture by Julia Evans.
Autonomous weapon systems will be developed by a limited handful of major military powers, at least at first, which means the market for counter-measures, such as turning such weapons against their masters, will bring a premium price. Far more than the offensive development side. Not to mention there will be a far larger market for counter-measures.
Deception, one means of turning weapons against their users, has a long history, not the earliest of which is the tale of Esau and Jacob (Genesis, chapter 26):
11 And Jacob said to Rebekah his mother, Behold, Esau my brother is a hairy man, and I am a smooth man:
12 My father peradventure will feel me, and I shall seem to him as a deceiver; and I shall bring a curse upon me, and not a blessing.
13 And his mother said unto him, Upon me be thy curse, my son: only obey my voice, and go fetch me them.
14 And he went, and fetched, and brought them to his mother: and his mother made savoury meat, such as his father loved.
15 And Rebekah took goodly raiment of her eldest son Esau, which were with her in the house, and put them upon Jacob her younger son:
16 And she put the skins of the kids of the goats upon his hands, and upon the smooth of his neck:
17 And she gave the savoury meat and the bread, which she had prepared, into the hand of her son Jacob.
Julia’s post doesn’t cover the hard case of seeing Jacob as Esau up close but in a battle field environment, the equivalent of mistaking a panda for a vulture, may be good enough.
The primary distinction that any autonomous weapons system must make is the friendly/enemy distinction. The term “friendly fire” was coined to cover cases where human directed weapons systems fail to make that distinction correctly.
The historical rate of “friendly fire” or fratricide is 2% but Mark Thompson reports in The Curse of Friendly Fire, that the actual fratricide rate in the 1991 Gulf war was 24%.
#Juniper, just to name one recent federal government software failure, is evidence that robustness isn’t an enforced requirement for government software.
Apply that lack of requirements to neural networks in autonomous weapons platforms and you have the potential for both developing and defeating autonomous weapons systems.
Julia’s post leaves you a long way from defeating an autonomous weapons platform but it is a good starting place.
PS: Defeating military grade neural networks will be good training for defeating more sophisticated ones used by commercial entities.