Another Word For It Patrick Durusau on Topic Maps and Semantic Diversity

May 21, 2018

Contrived Russian Facebook Ad Data

Filed under: Data Preservation,Data Quality,Data Science,Facebook,Politics — Patrick Durusau @ 2:16 pm

When I first read about: Facebook Ads: Exposing Russia’s Effort to Sow Discord Online: The Internet Research Agency and Advertisements, a release of alleged Facebook ads, by Democrats of the House Permanent Select Committee on Intelligence, I should have just ignored it.

But any number of people whose opinions I respect, seem deadly certain that Facebook ads, purchased by Russians, had a tipping impact on the 2016 presidential election. At least I should look at the purported evidence offered by House Democrats. The reporting I have seen on the release indicates at best skimming of the data, if it is read at all.

It wasn’t until I started noticing oddities in a sample of the data that I cleaned that the full import of:

Redactions Completed at the Direction of Ranking Member of the US House Permanent Select Committee on Intelligence

That statement appears in every PDF file. Moreover, if you check the properties of any of the PDF files, you will find a creation date in May of 2018.

I had been wondering why Facebook would deliver ad data to Congress as PDF files. Just seemed odd, something nagging in the back of my mind. Terribly inefficient way to deliver ad data.

The “redaction” notice and creation dates make it clear that the so-called Facebook ad PDFs, are wholly creations of the House Permanent Select Committee on Intelligence, and not Facebook.

I bring that break in the data chain because without knowing the content of the original data from Facebook, there is no basis for evaluating the accuracy of the data being delivered by Congressional Democrats. It may or may not bear any resemblance to the data from Facebook.

Rather than a blow against whoever the Democrats think is responsible, this is a teaching moment about the provenance of data. If there is a gap, such as the one here, the only criteria for judging the data is do you like the results? If so, it’s good data, if not, then it’s bad data.

Why so-called media watch-dogs on “fake news” and mis-information missed such an elementary point isn’t clear. Perhaps you should ask them.

While cleaning the data for October of 2016, my suspicions were re-enforced by the following:

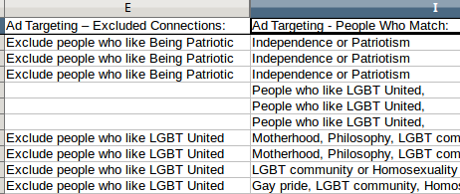
Doesn’t it strike you as odd that both the exclusion targets and ad targets are the same? Granting it’s only seven instances in this one data sample of 135 ads, but that’s enough for me to worry about the process of producing the files in question.

If you decide to invest any time in this artifice of congressional Democrats, study the distribution of the so-called ads. I find it less than credible that August of 2017 had one ad placed by (drum roll), the Russians! FYI, July 2017 had only seven.

Being convinced the Facebook ad files from Congress are contrived representations with some unknown relationship to Facebook data, I abandoned the idea of producing a clean data set.

Resources:

PDFs produced by Congress, relationship to Facebook data unknown.

Cleaned July, 2015 data set by Patrick Durusau.

Text of all the Facebook ads (uncleaned), September 2015 – August 2017 (missing June – 2017) by Patrick Durusau. (1.2 MB vs. their 8 GB.)

Seriously pursuit of any theory of ads influencing the 2016 presidential election, has the following minimal data requirements:

  1. All the Facebook content posted for the relevant time period.
  2. Identification of paid ads and by what group, organization, government they were placed.

Assuming that data is available, similarity measures of paid versus user content and measures of exposure should be undertaken.

Notice that none of the foregoing “prove” influence on an election. Those are all preparatory steps towards testing theories of influence and on who, to what extent?

August 30, 2017

Are You Investing in Data Prep or Technology Skills?

Filed under: Data Contamination,Data Conversion,Data Quality,Data Science — Patrick Durusau @ 4:35 pm

Kirk Borne posted for #wisdomwednesday:

New technologies are my weakness.

What about you?

What if we used data driven decision making?

Different result?

March 29, 2017

What’s Up With Data Padding? (Regulations.gov)

Filed under: Data Quality,Fair Use,Government Data,Intellectual Property (IP),Transparency — Patrick Durusau @ 10:41 am

I forgot to mention in Copyright Troll Hunting – 92,398 Possibles -> 146 Possibles that while using LibreOffice, I deleted a large number of either N/A only or columns not relevant for troll-mining.zip.

Except as otherwise noted, after removal of “no last name,” these fields had N/A for all records except as noted:

  1. L – Implementation Date
  2. M – Effective Date
  3. N – Related RINs
  4. O – Document SubType (Comment(s))
  5. P – Subject
  6. Q – Abstract
  7. R – Status – (Posted, except for 2)
  8. S – Source Citation
  9. T – OMB Approval Number
  10. U – FR Citation
  11. V – Federal Register Number (8 exceptions)
  12. W – Start End Page (8 exceptions)
  13. X – Special Instructions
  14. Y – Legacy ID
  15. Z – Post Mark Date
  16. AA – File Type (1 docx)
  17. AB – Number of Pages
  18. AC – Paper Width
  19. AD – Paper Length
  20. AE – Exhibit Type
  21. AF – Exhibit Location
  22. AG – Document Field_1
  23. AH – Document Field_2

Regulations.gov, not the Copyright Office, is responsible for the collection and management of comments, including the bulked up export of comments.

From the state of the records, one suspects the “bulking up” is NOT an artifact of the export but represents the storage of each record.

One way to test that theory would be a query on the noise fields via the API for Regulations.gov.

The documentation for the API is out-dated, the Field References documentation lacks the Document Detail (field AI), which contains the URL to access the comment.

The closest thing I could find was:

fileFormats Formats of the document, included as URLs to download from the API

How easy/hard it will be to download attachments isn’t clear.

BTW, the comment pages themselves are seriously puffed up. Take https://www.regulations.gov/document?D=COLC-2015-0013-52236.

Saved to disk: 148.6 KB.

Content of the comment: 2.5 KB.

The content of the comment is 1.6 % of the delivered webpage.

It must have taken serious effort to achieve a 98.4% noise to 1.6% signal ratio.

How transparent is data when you have to mine for the 1.6% that is actual content?

October 4, 2016

An introduction to data cleaning with R

Filed under: Data Quality,R — Patrick Durusau @ 7:33 pm

An introduction to data cleaning with R by Edwin de Jonge and Mark van der Loo.

Summary:

Data cleaning, or data preparation is an essential part of statistical analysis. In fact, in practice it is often more time-consuming than the statistical analysis itself. These lecture notes describe a range of techniques, implemented in the R statistical environment, that allow the reader to build data cleaning scripts for data suffering from a wide range of errors and inconsistencies, in textual format. These notes cover technical as well as subject-matter related aspects of data cleaning. Technical aspects include data reading, type conversion and string matching and manipulation. Subject-matter related aspects include topics like data checking, error localization and an introduction to imputation methods in R. References to relevant literature and R packages are provided throughout.

These lecture notes are based on a tutorial given by the authors at the useR!2013 conference in Albacete, Spain.

Pure gold!

Plus this tip (among others):

Tip. To become an R master, you must practice every day.

The more data you clean, the better you will become!

Enjoy!

June 11, 2016

My Data Is Dirty! Basic Spreadsheet Cleaning Functions

Filed under: Data Quality,Journalism,News,Reporting,Spreadsheets — Patrick Durusau @ 8:59 am

My Data Is Dirty! Basic Spreadsheet Cleaning Functions by Paul Bradshaw.

A sample from Paul Bradshaw’s new book, Finding Stories in Spreadsheets.

Data is always dirty but you don’t always need a hazmat suit and supporting army of technicians.

Paul demonstrates Excel functions (sniff, other spreadsheet programs have the same functions), TRIM, SUBSTITUTE, CHAR, as easy ways to clean data.

Certainly makes me interested in what other techniques are lurking in Finding Stories in Spreadsheets.

Enjoy!

January 17, 2016

Teletext Time Travel [Extra Dirty Data]

Filed under: Archives,Data Quality — Patrick Durusau @ 3:03 pm

Teletext Time Travel by Russ J. Graham.

From the post:

Transdiffusioner Jason Robertson has a complicated but fun project underway – recovering old teletext data from VHS cassettes.

Previously, it was possible – difficult but possible – to recover teletext from SVHS recordings, but they’re as rare as hen’s teeth as the format never really caught on. The data was captured by ordinary VHS but was never clear enough to get anything but a very few correct characters in amongst a massive amount of nonsense.

Technology is changing that. The continuing boom in processor power means it’s now possible to feed 15 minutes of smudged VHS teletext data into a computer and have it relentlessly compare the pages as they flick by at the top of the picture, choosing to hold characters that are the same on multiple viewing (as they’re likely to be right) and keep trying for clearer information for characters that frequently change (as they’re likely to be wrong).

I mention this so you the next time you complain about your “dirty data,” there is far dirtier data in the world!

April 7, 2015

33% of Poor Business Decisions Track Back to Data Quality Issues

Filed under: BigData,Data,Data Quality — Patrick Durusau @ 3:46 pm

Stupid errors in spreadsheets could lead to Britain’s next corporate disaster by Rebecca Burn-Callander.

From the post:

Errors in company spreadsheets could be putting billions of pounds at risk, research has found. This is despite high-profile spreadsheet catastrophes, such as the collapse of US energy giant Enron, ringing alarm bells more than a decade ago.

Almost one in five large businesses have suffered financial losses as a result of errors in spreadsheets, according to F1F9, which provides financial modelling and business forecasting to blue chips firms. It warns of looming financial disasters as 71pc of large British business always use spreadsheets for key financial decisions.

The company’s new whitepaper entitiled Capitalism’s Dirty Secret showed that the abuse of humble spreadsheet could have far-reaching consequences. Spreadsheets are used in the preparation of British company accounts worth up to £1.9 trillion and the UK manufacturing sector uses spreadsheets to make pricing decisions for up to £170bn worth of business.

Felienne Hermans, of Delft University of Technology, analysed 15,770 spreadsheets obtained from over 600,000 emails from 158 former employees. He found 755 files with more than a hundred errors, with the maximum number of errors in one file being 83,273.

Dr Hermans said: “The Enron case has given us a unique opportunity to look inside the workings of a major corporate organisation and see first hand how widespread poor spreadsheet practice really is.

First, a gender correction, Dr. Hermans is not a he. The post should read: “She found 755 files with more than….

Second, how bad is poor spreadsheet quality? The download page has this summary:

  • 33% of large businesses report poor decision making due to spreadsheet problems.
  • Nearly 1 in 5 large businesses have suffered direct financial loss due to poor spreadsheets.
  • Spreadsheets are used in the preparation of British company accounts worth up to £1.9 trillion.

You read that correctly, not that 33% of spreadsheet have quality issues but that 33% of poor business decisions can be traced to spreadsheet problems.

A comment to the blog post supplied a link for the report: A Research Report into the Uses and Abuses of Spreadsheets.

Spreadsheets are small to medium sized data.

Care to comment on the odds of big data and its processes pushing the percentage of poor business decisions past 33%?

How would you discover you are being misled by big data and/or its processing?

How do you validate the results of big data? Run another big data process?

When you hear sales pitches about big data, be sure to ask about the impact of dirty data. If assured that your domain doesn’t have a dirty data issue, grab your wallet and run!

PS: A Research Report into the Uses and Abuses of Spreadsheets is a must have publication.

The report itself is useful, but Appendix A 20 Principles For Good Spreadsheet Practice is a keeper. With a little imagination all of those principles could be applied to big data and its processing.

Just picking one at random:

3. Ensure that everyone involved in the creation or use of spreadsheet has an appropriate level of knowledge and understanding.

For big data, reword that to:

Ensure that everyone involved in the creation or use of big data has an appropriate level of knowledge and understanding.

Your IT staff are trained, but do the managers who will use the results understand the limitations of the data and/or it processing? Or do they follow the results because “the data says so?”

February 20, 2015

More Bad Data News – Psychology

Filed under: Data Quality,Psychology — Patrick Durusau @ 4:28 pm

Statistical Reporting Errors and Collaboration on Statistical Analyses in Psychological Science by Coosje L. S. Veldkamp, et al. (PLOS Published: December 10, 2014 DOI: 10.1371/journal.pone.0114876)

Abstract:

Statistical analysis is error prone. A best practice for researchers using statistics would therefore be to share data among co-authors, allowing double-checking of executed tasks just as co-pilots do in aviation. To document the extent to which this ‘co-piloting’ currently occurs in psychology, we surveyed the authors of 697 articles published in six top psychology journals and asked them whether they had collaborated on four aspects of analyzing data and reporting results, and whether the described data had been shared between the authors. We acquired responses for 49.6% of the articles and found that co-piloting on statistical analysis and reporting results is quite uncommon among psychologists, while data sharing among co-authors seems reasonably but not completely standard. We then used an automated procedure to study the prevalence of statistical reporting errors in the articles in our sample and examined the relationship between reporting errors and co-piloting. Overall, 63% of the articles contained at least one p-value that was inconsistent with the reported test statistic and the accompanying degrees of freedom, and 20% of the articles contained at least one p-value that was inconsistent to such a degree that it may have affected decisions about statistical significance. Overall, the probability that a given p-value was inconsistent was over 10%. Co-piloting was not found to be associated with reporting errors.

If you are relying on statistical reports from psychology publications, you need to keep the last part of that abstract firmly in mind:

Overall, 63% of the articles contained at least one p-value that was inconsistent with the reported test statistic and the accompanying degrees of freedom, and 20% of the articles contained at least one p-value that was inconsistent to such a degree that it may have affected decisions about statistical significance. Overall, the probability that a given p-value was inconsistent was over 10%. Co-piloting was not found to be associated with reporting errors.

That is an impressive error rate. Imagine incorrect GPS locations 63% of the time and your car starting only 80% of the time. I would take that as a sign that something was seriously wrong.

Not an amazing results considering reports of contamination in genome studies and bad HR data, not to mention that only 6% of landmark cancer research projects could be replicated.

At the root of the problem are people. People just like you and me.

People who did not follow (or in some cases record) a well defined process that included independent verification results they obtained.

Independent verification is never free but then neither are the consequences of errors. Choose carefully.

November 5, 2014

Good Open Data. . . by design

Filed under: Data Governance,Data Quality,Open Data — Patrick Durusau @ 8:07 pm

Good Open Data. . . by design by Victoria L. Lemieux, Oleg Petrov, and, Roger Burks.

From the post:

An unprecedented number of individuals and organizations are finding ways to explore, interpret and use Open Data. Public agencies are hosting Open Data events such as meetups, hackathons and data dives. The potential of these initiatives is great, including support for economic development (McKinsey, 2013), anti-corruption (European Public Sector Information Platform, 2014) and accountability (Open Government Partnership, 2012). But is Open Data’s full potential being realized?

A news item from Computer Weekly casts doubt. A recent report notes that, in the United Kingdom (UK), poor data quality is hindering the government’s Open Data program. The report goes on to explain that – in an effort to make the public sector more transparent and accountable – UK public bodies have been publishing spending records every month since November 2010. The authors of the report, who conducted an analysis of 50 spending-related data releases by the Cabinet Office since May 2010, found that that the data was of such poor quality that using it would require advanced computer skills.

Far from being a one-off problem, research suggests that this issue is ubiquitous and endemic. Some estimates indicate that as much as 80 percent of the time and cost of an analytics project is attributable to the need to clean up “dirty data” (Dasu and Johnson, 2003).

In addition to data quality issues, data provenance can be difficult to determine. Knowing where data originates and by what means it has been disclosed is key to being able to trust data. If end users do not trust data, they are unlikely to believe they can rely upon the information for accountability purposes. Establishing data provenance does not “spring full blown from the head of Zeus.” It entails a good deal of effort undertaking such activities as enriching data with metadata – data about data – such as the date of creation, the creator of the data, who has had access to the data over time and ensuring that both data and metadata remain unalterable.

What is it worth to you to use good open data rather than dirty open data?

Take the costs of your analytics projects for the past year and multiply that by eighty (80) percent. Just an estimate, the actual cost will vary from project to project, but did that result get your attention?

If so, contact your sources for open data and lobby for clean open data.

PS: You may find the World Bank’s Open Data Readiness Assessment Tool useful.

May 8, 2014

Fifteen ideas about data validation (and peer review)

Filed under: Data Quality,Data Science — Patrick Durusau @ 7:11 pm

Fifteen ideas about data validation (and peer review)

From the post:

Many open issues drift around data publication, but validation is both the biggest and the haziest. Some form of validation at some stage in a data publication process is essential; data users need to know that they can trust the data they want to use, data creators need a stamp of approval to get credit for their work, and the publication process must avoid getting clogged with unusable junk. However, the scientific literature’s validation mechanisms don’t translate as directly to data as its mechanism for, say, citation.

This post is in part a very late response to a data publication workshop I attended last February at the International Digital Curation Conference (IDCC). In a breakout discussion of models for data peer review, there were far more ideas about data review than time to discuss them. Here, for reference purposes, is a longish list of non-parallel, sometimes-overlapping ideas about how data review, validation, or quality assessment could or should work. I’ve tried to stay away from deeper consideration of what data quality means (which I’ll discuss in a future post) and from the broader issues of peer review associated with the literature, but they inevitably pop up anyway.

A good starting point for discussion of data validation concerns.

Perfect data would be preferred but let’s accept that perfect data is possible only for trivial or edge cases.

If you start off by talking about non-perfect data, it may be easier to see some of the consequences for when having non-perfect data makes a system fail. What are the consequences of that failure? For the data owner as well as others? Are those consequences acceptable?

Make those decisions up front and documented as part of planning data validation.

January 3, 2014

Data Without Meaning? [Dark Data]

Filed under: Data,Data Analysis,Data Mining,Data Quality,Data Silos — Patrick Durusau @ 5:47 pm

I was reading IDC: Tons of Customer Data Going to Waste by Beth Schultz when I saw:

As much as companies understand the need for data and analytics and are evolving their relationships with both, they’re really not moving quickly enough, Schaub suggested during an IDC webinar earlier this week about the firm’s top 10 predictions for CMOs in 2014. “The aspiration is know that customer, and know what the customer wants at every single touch point. This is going to be impossible in today’s siloed, channel orientation.”

Companies must use analytics to help take today’s multichannel reality and recreate “the intimacy of the corner store,” she added.

Yes, great idea. But as IDC pointed out in the prediction I found most disturbing — especially with how much we hear about customer analytics — gobs of data go unused. In 2014, IDC predicted, “80% of customer data will be wasted due to immature enterprise data ‘value chains.’ ” That has to set CMOs to shivering, and certainly IDC found it surprising, according to Schaub.

That’s not all that surprising, either the 80% and/or the cause being “immature enterprise data ‘value chains.'”

What did surprise me was:

IDC’s data group researchers say that some 80% of data collected has no meaning whatsoever, Schaub said.

I’m willing to bet the wasted 80% of consumer data and the “no meaning” 80% of consumer data, is the same 80%.

Think about it.

If your information chain isn’t associating meaning with the data you collect, the data may as well be streaming to /dev/null.

The data isn’t without meaning, you just failed to capture it. Not the same thing as having “no meaning.”

Failing to capture meaning along with data is one way to produce what I call “dark data.”

I first saw this in a tweet by Gregory Piatetsky.

December 3, 2013

Five Stages of Data Grief

Filed under: Data,Data Quality — Patrick Durusau @ 2:15 pm

Five Stages of Data Grief by Jeni Tennison.

From the post:

As organisations come to recognise how important and useful data could be, they start to think about using the data that they have been collecting in new ways. Often data has been collected over many years as a matter of routine, to drive specific processes or sometimes just for the sake of it. Suddenly that data is repurposed. It is probed, analysed and visualised in ways that haven’t been tried before.

Data analysts have a maxim:

If you don’t think you have a quality problem with your data, you haven’t looked at it yet.

Every dataset has its quirks, whether it’s data that has been wrongly entered in the first place, automated processing that has introduced errors, irregularities that come from combining datasets into a consistent structure or simply missing information. Anyone who works with data knows that far more time is needed to clean data into something that can be analysed, and to understand what to leave out, than in actually performing the analysis itself. They also know that analysis and visualisation of data will often reveal bugs that you simply can’t see by staring at a spreadsheet.

But for the people who have collected and maintained such data — or more frequently their managers, who don’t work with the data directly — this realisation can be a bit of a shock. In our last ODI Board meeting, Sir Tim Berners-Lee suggested that the data curators need to go through was something like the five stages of grief described by the Kübler-Ross model.

Jeni covers the five stages of grief from a data quality standpoint and offers a sixth stage. (No spoilers follow, read her post.)

Correcting input/transformation errors is one level of data cleaning.

But the near-collapse of HealthCare.gov shows how streams of “clean” data can combine into a large pool of “dirty” data.

Every contributor supplied ‘clean’ data but when combined with other “clean” data, confusion was the result.

“Clean” data is an ongoing process at two separate levels:

Level 1: Traditional correction of input/transformation errors (as per Jeni).

Level 2: Preparation of data for transformation into “clean” data for new purposes.

The first level is familiar.

The second we all know as ad-hoc ETL.

Enough knowledge is gained to make a transformation work, but that knowledge isn’t passed on with the data or more generally.

Or as we all learned from television: “Lather, rinse, repeat.”

A good slogan if you are trying to maximize sales of shampoo, but a wasteful one when describing ETL for data.

What if data curators captured the knowledge required for ETL, making every subsequent ETL less resource intensive and less error prone?

I think that would qualify as data cleaning.

You?

November 27, 2013

Data Quality, Feature Engineering, GraphBuilder

Filed under: Data Quality,Design,ETL,GraphBuilder,Pig — Patrick Durusau @ 3:06 pm

Avoiding Cluster-Scale Headaches with Better Tools for Data Quality and Feature Engineering by Ted Willke.

Ted’s second slide reads:

Machine Learning may nourish the soul…

…but Data Preparation will consume it.

Ted starts off talking about the problems of data preparation but fairly quickly focuses in on property graphs and using Pig ETL.

He also outlines outstanding problems with Pig ETL (slides 29-32).

Nothing surprising but good news that Graph Builder 2 Alpha is due out in Dec’ 13.

BTW, GraphBuilder 1.0 can be found at: https://01.org/graphbuilder/

October 27, 2013

Trouble at the lab [Data Skepticism]

Filed under: Data,Data Quality,Skepticism — Patrick Durusau @ 4:39 pm

Trouble at the lab, Oct. 19, 2013, The Economist.

From the web page:

“I SEE a train wreck looming,” warned Daniel Kahneman, an eminent psychologist, in an open letter last year. The premonition concerned research on a phenomenon known as “priming”. Priming studies suggest that decisions can be influenced by apparently irrelevant actions or events that took place just before the cusp of choice. They have been a boom area in psychology over the past decade, and some of their insights have already made it out of the lab and into the toolkits of policy wonks keen on “nudging” the populace.

Dr Kahneman and a growing number of his colleagues fear that a lot of this priming research is poorly founded. Over the past few years various researchers have made systematic attempts to replicate some of the more widely cited priming experiments. Many of these replications have failed. In April, for instance, a paper in PLoS ONE, a journal, reported that nine separate experiments had not managed to reproduce the results of a famous study from 1998 purporting to show that thinking about a professor before taking an intelligence test leads to a higher score than imagining a football hooligan.

The idea that the same experiments always get the same results, no matter who performs them, is one of the cornerstones of science’s claim to objective truth. If a systematic campaign of replication does not lead to the same results, then either the original research is flawed (as the replicators claim) or the replications are (as many of the original researchers on priming contend). Either way, something is awry.

The numbers will make you a militant data skeptic:

  • Original results could be duplicated for only 6 out of 53 landmark studies of cancer.
  • Drug company could reproduce only 1/4 of 67 “seminal studies.”
  • NIH official estimates at least three-quarters of publishing biomedical finding would be hard to reproduce.
  • Three-quarter of published paper in machine learning are bunk due to overfitting.

Those and more examples await you in this article from The Economist.

As the sub-heading for the article reads:

Scientists like to think of science as self-correcting. To an alarming degree, it is not

You may not mind misrepresenting facts to others, but do you want other people misrepresenting facts to you?

Do you have a professional data critic/skeptic on call?

October 16, 2013

Research Methodology [How Good Is Your Data?]

Filed under: Data Collection,Data Quality,Data Science — Patrick Durusau @ 3:42 pm

The presenters in a recent webinar took great pains to point out all the questions a user should be asking about data.

Questions like how representative a population was surveyed or how representative is the data, how were survey questions tested, selection biases, etc., it was like a flash back to empirical methodology in a political science course I took years ago.

It hadn’t occurred to me that some users of data (or “big data” if you prefer) might not have empirical methodology reflexes.

That would account for people who use Survey Monkey and think the results aren’t a reflection of themselves.

Doesn’t have to be. A professional survey person could use the same technology and possibly get valid results.

But the ability to hold a violin doesn’t mean you can play one.

Resources that you may find useful:

Political Science Scope and Methods

Description:

This course is designed to provide an introduction to a variety of empirical research methods used by political scientists. The primary aims of the course are to make you a more sophisticated consumer of diverse empirical research and to allow you to conduct advanced independent work in your junior and senior years. This is not a course in data analysis. Rather, it is a course on how to approach political science research.

Berinsky, Adam. 17.869 Political Science Scope and Methods, Fall 2010. (MIT OpenCourseWare: Massachusetts Institute of Technology), http://ocw.mit.edu/courses/political-science/17-869-political-science-scope-and-methods-fall-2010 (Accessed 16 Oct, 2013). License: Creative Commons BY-NC-SA

Qualitative Research: Design and Methods

Description:

This course is intended for graduate students planning to conduct qualitative research in a variety of different settings. Its topics include: Case studies, interviews, documentary evidence, participant observation, and survey research. The primary goal of this course is to assist students in preparing their (Masters and PhD) dissertation proposals.

Locke, Richard. 17.878 Qualitative Research: Design and Methods, Fall 2007. (MIT OpenCourseWare: Massachusetts Institute of Technology), http://ocw.mit.edu/courses/political-science/17-878-qualitative-research-design-and-methods-fall-2007 (Accessed 16 Oct, 2013). License: Creative Commons BY-NC-SA

Introduction to Statistical Method in Economics

Description:

This course is a self-contained introduction to statistics with economic applications. Elements of probability theory, sampling theory, statistical estimation, regression analysis, and hypothesis testing. It uses elementary econometrics and other applications of statistical tools to economic data. It also provides a solid foundation in probability and statistics for economists and other social scientists. We will emphasize topics needed in the further study of econometrics and provide basic preparation for 14.32. No prior preparation in probability and statistics is required, but familiarity with basic algebra and calculus is assumed.

Bennett, Herman. 14.30 Introduction to Statistical Method in Economics, Spring 2006. (MIT OpenCourseWare: Massachusetts Institute of Technology), http://ocw.mit.edu/courses/economics/14-30-introduction-to-statistical-method-in-economics-spring-2006 (Accessed 16 Oct, 2013). License: Creative Commons BY-NC-SA

Every science program, social or otherwise, will offer some type of research methods course. The ones I have listed are only the tip of a very large iceberg of courses and literature.

With a little effort you can acquire an awareness of what wasn’t said about data collection, processing or analysis.

September 1, 2013

Sane Data Updates Are Harder Than You Think

Filed under: Data,Data Collection,Data Quality,News — Patrick Durusau @ 6:35 pm

Sane Data Updates Are Harder Than You Think by Adrian Holovaty.

From the post:

This is the first in a series of three case studies about data-parsing problems from a journalist’s perspective. This will be meaty, this will be hairy, this will be firmly in the weeds.

We’re in the middle of an open-data renaissance. It’s easier than ever for somebody with basic tech skills to find a bunch of government data, explore it, combine it with other sources, and republish it. See, for instance, the City of Chicago Data Portal, which has hundreds of data sets available for immediate download.

But the simplicity can be deceptive. Sure, the mechanics of getting data are easy, but once you start working with it, you’ll likely face a variety of rather subtle problems revolving around data correctness, completeness, and freshness.

Here I’ll examine some of the most deceptively simple problems you may face, based on my eight years’ experience dealing with government data in a journalistic setting —most recently as founder of EveryBlock, and before that as creator of chicagocrime.org and web developer at washingtonpost.com. EveryBlock, which was shut down by its parent company NBC News in February 2013, was a site that gathered and sorted dozens of civic data sets geographically. It gave you a “news feed for your block”—a frequently updated feed of news and discussions relevant to your home address. In building this huge public-data-parsing machine, we dealt with many different data situations and problems, from a wide variety of sources.

My goal here is to raise your awareness of various problems that may not be immediately obvious and give you reasonable solutions. My first theme in this series is getting new or changed records.

A great introduction to deep problems that are lurking just below the surface of any available data set.

Not only do data sets change but reactions to and criticisms of data sets change.

What would you offer as an example of “stable” data?

I tried to think of one for this post and came up empty.

You could claim the text of the King Jame Bible is “stable” data.

But only from a very narrow point of view.

The printed text is stable but the opinions, criticisms, commentaries, all on the King James Bible have been anything but stable.

Imagine that you have a stock price ticker application and all it reports are the current prices for some stock X.

Is that sufficient or would it be more useful if it reported the price over the last four hours as a percentage of change?

Perhaps we need a modern data Heraclitus to proclaim:

“No one ever reads the same data twice”

August 20, 2013

Cleaning Data with OpenRefine

Filed under: Data Quality,OpenRefine — Patrick Durusau @ 2:54 pm

Cleaning Data with OpenRefine by Seth van Hooland, Ruben Verborgh, and, Max De Wilde.

From the post:

Don’t take your data at face value. That is the key message of this tutorial which focuses on how scholars can diagnose and act upon the accuracy of data. In this lesson, you will learn the principles and practice of data cleaning, as well as how OpenRefine can be used to perform four essential tasks that will help you to clean your data:

  1. Remove duplicate records
  2. Separate multiple values contained in the same field
  3. Analyse the distribution of values throughout a data set
  4. Group together different representations of the same reality

These steps are illustrated with the help of a series of exercises based on a collection of metadata from the Powerhouse museum, demonstrating how (semi-)automated methods can help you correct the errors in your data.

(…)

If you only remember on thing from this lesson, it should be this: all data is dirty, but you can do something about it. As we have shown here, there is already a lot you can do yourself to increase data quality significantly. First of all, you have learned how you can get a quick overview of how many empty values your dataset contains and how often a particular value (e.g. a keyword) is used throughout a collection. This lessons also demonstrated how to solve recurrent issues such as duplicates and spelling inconsistencies in an automated manner with the help of OpenRefine. Don’t hesitate to experiment with the cleaning features, as you’re performing these steps on a copy of your data set, and OpenRefine allows you to trace back all of your steps in the case you have made an error.

It is so rare that posts have strong introductions and conclusions that I had to quote both of them.

Great introduction to OpenRefine.

I fully agree that all data is dirty, and that you can do something about it.

However, data is dirty or clean only from a certain point of view.

You may “clean” data in a way that makes it incompatible with my input methods. For me, the data remains “dirty.”

Or to put it another way, data cleaning is like housekeeping. It comes around day after day. You may as well plan for it.

July 29, 2013

Big Data Garbage In, Even Bigger Garbage Out

Filed under: Data Quality — Patrick Durusau @ 3:56 pm

Big Data Garbage In, Even Bigger Garbage Out by Alex Woodie.

From the post:

People are doing some truly amazing things with big data sets and analytic tools. Tools like Hadoop have given us astounding capabilities to drive insights out of huge expanses of loosely structured data. And while the big data breakthroughs are expected to continue, don’t expect any progress to be made against that oldest of computer adages: “garbage in, garbage out.”

In fact, big data may even exacerbate the GIGO problem, according to Andrew Anderson, CEO of Celaton, a UK company that makes software designed to prevent bad data from being introduced into customer’s accounting systems.

“The ideal payoff for accumulating data is rapidly compounding returns,” Anderson writes in an essay on Economia, a publication of a UK accounting association. “By gaining more data on your own business, your clients, and your prospects, the idea is that you can make more informed decisions about your business and theirs based on clear insight. Too often however, these insights are based on invalid data, which can lead to a negative version of this payoff, to the power of ten.”

The problem may compound to the power of 100 if bad data is left to fester. Anderson calls this the “1-10-100 rule.” If a clerk makes a mistake entering data, it costs $1 to fix it immediately. After an hour–when the data has begun propagating across the system–the cost to fix it increases to $10.

Several months later, after the piece of data has become part of the company’s data reality and mailings have gone out to the wrong people and invoices have gone unpaid and new clients have not been contacted about new services, the cost of that single data error balloons to $100.

If you read the essay in Economia, you will find the 1-10-100 rule expressed in British pounds. With the current exchange rate, the cost would be higher here in the United States.

Still, the point is a valid one.

Decisions made on faulty data may be the correct decisions, but your odds worsen as the quality of the data goes down.

July 7, 2013

Nasty data corruption getting exponentially worse…

Filed under: BigData,Data Quality — Patrick Durusau @ 3:52 pm

Nasty data corruption getting exponentially worse with the size of your data by Vincent Granville.

From the post:

The issue with truly big data is that you will end up with field separators that are actually data values (text data). What are the chances to find a double tab in a one GB file? Not that high. In an 100 TB file, the chance is very high. Now the question is: is it a big issue, or maybe it’s fine as long as less than 0.01% of the data is impacted. In some cases, once the glitch occurs, ALL the data after the glitch is corrupted, because it is not read correctly – this is especially true when a data value contains text that is identical to a row or field separator, such as CR / LF (carriage return / line feed). The problem gets worse when data is exported from UNIX or MAC to WINDOWS, or even from ACCESS to EXCEL.

Vincent has a number of suggestions for checking data.

What would you add to his list?

June 28, 2013

Pricing Dirty Data

Filed under: Data,Data Quality — Patrick Durusau @ 3:00 pm

Putting a Price on the Value of Poor Quality Data by Dylan Jones.

From the post:

When you start out learning about data quality management, you invariably have to get your head around the cost impact of bad data.

One of the most common scenarios is the mail order catalogue business case. If you have a 5% conversion rate on your catalogue orders and the average order price is £20 – and if you have 100,000 customer contacts – then you know that with perfect-quality data you should be netting about £100,000 per mail campaign.

However, we all know that data is never perfect. So if 20% of your data is inaccurate or incomplete and the catalogue cannot be delivered, then you’ll only make £80,000.

I always see the mail order scenario as the entry-level data quality business case as it’s common throughout textbooks, but there is another case I prefer: that of customer churn, which I think is even more compelling.

(…)

The absence of the impact of dirty data as a line item in the budget makes it difficult to argue for better data.

Dylan finds a way to relate dirty data to something of concern to every commercial enterprise, customers.

How much customers spend and how long they are retained, can be translated into line items (negative ones) in the budget.

Suggestions on how to measure the impact of a topic maps-based solution for delivery of information to customers?

April 25, 2013

A different take on data skepticism

Filed under: Algorithms,Data,Data Models,Data Quality — Patrick Durusau @ 1:26 pm

A different take on data skepticism by Beau Cronin.

From the post:

Recently, the Mathbabe (aka Cathy O’Neil) vented some frustration about the pitfalls in applying even simple machine learning (ML) methods like k-nearest neighbors. As data science is democratized, she worries that naive practitioners will shoot themselves in the foot because these tools can offer very misleading results. Maybe data science is best left to the pros? Mike Loukides picked up this thread, calling for healthy skepticism in our approach to data and implicitly cautioning against a “cargo cult” approach in which data collection and analysis methods are blindly copied from previous efforts without sufficient attempts to understand their potential biases and shortcomings.

…Well, I would argue that all ML methods are not created equal with regard to their safety. In fact, it is exactly some of the simplest (and most widely used) methods that are the most dangerous.

Why? Because these methods have lots of hidden assumptions. Well, maybe the assumptions aren’t so much hidden as nodded-at-but-rarely-questioned. A good analogy might be jumping to the sentencing phase of a criminal trial without first assessing guilt: asking “What is the punishment that best fits this crime?” before asking “Did the defendant actually commit a crime? And if so, which one?” As another example of a simple-yet-dangerous method, k-means clustering assumes a value for k, the number of clusters, even though there may not be a “good” way to divide the data into this many buckets. Maybe seven buckets provides a much more natural explanation than four. Or maybe the data, as observed, is truly undifferentiated and any effort to split it up will result in arbitrary and misleading distinctions. Shouldn’t our methods ask these more fundamental questions as well?

Beau make several good points on questioning data methods.

I would extend those “…more fundamental questions…” to data as well.

Data, at least as far as I know, doesn’t drop from the sky. It is collected, generated, sometimes both, by design.

That design had some reason for collecting that data, in some particular way and in a given format.

Like methods, data stands mute with regard to those designs, what choices were made, by who and for what reason?

Giving voice what can be known about methods and data falls to human users.

April 16, 2013

The Costs and Profits of Poor Data Quality

Filed under: Data,Data Quality — Patrick Durusau @ 7:10 pm

The Costs and Profits of Poor Data Quality by Jim Harris.

From the post:

Continuing the theme of my two previous posts, which discussed when it’s okay to call data quality as good as it needs to get and when perfect data quality is necessary, in this post I want to briefly discuss the costs — and profits — of poor data quality.

Loraine Lawson interviewed Ted Friedman of Gartner Research about How to Measure the Cost of Data Quality Problems, such as the costs associated with reduced productivity, redundancies, business processes breaking down because of data quality issues, regulatory compliance risks, and lost business opportunities. David Loshin blogged about the challenge of estimating the cost of poor data quality, noting that many estimates, upon close examination, seem to rely exclusively on anecdotal evidence.

As usual, Jim does a very good job of illustrating costs and profits from poor data quality.

I have a slightly different question:

What could you know about data to spot that it is of poor quality?

It is one thing to find out after a space ship crashes that poor data quality was responsible, but it would be better to spot the error before hand. As in before the launch.

Probably data specific but are there any general types of information that would help you spot poor quality data?

Before you are 1,000 meters off the lunar surface. 😉

March 10, 2013

Why Data Lineage is Your Secret … Weapon [Auditing Topic Maps]

Filed under: Data Quality,Merging,Provenance — Patrick Durusau @ 8:42 pm

Why Data Lineage is Your Secret Data Quality Weapon by Dylan Jones.

From the post:

Data lineage means many things to many people but it essentially refers to provenance – how do you prove where your data comes from?

It’s really a simple exercise. Just pull an imaginary string of data from where the information presents itself, back through the labyrinth of data stores and processing chains, until you can go no further.

I’m constantly amazed by why so few organisations practice sound data lineage management despite having fairly mature data quality or even data governance programs. On a side note, if ever there was a justification for the importance of data lineage management then just take a look at the brand damage caused by the recent European horse meat scandal.

But I digress. Why is data lineage your secret data quality weapon?

The simple answer is that data lineage forces your organisation to address two big issues that become all too apparent:

  • Lack of ownership
  • Lack of formal information chain design

Or to put it into a topic map context, can you trace what topics merged to create the topic you are now viewing?

And if you can’t trace, how can you audit the merging of topics?

And if you can’t audit, how do you determine the reliability of your topic map?

That is reliability in terms of date (freshness), source (reliable or not), evaluation (by screeners), comparison (to other sources), etc.

Same questions apply to all data aggregation systems.

Or as Mrs. Weasley tells Ginny:

“Never trust anything that can think for itself if you can’t see where it keeps its brain.”


Correction: Wesley -> Weasley. We had a minister friend over Sunday and were discussing the former, not the latter. 😉

December 8, 2012

Applying “Lateral Thinking” to Data Quality

Filed under: Data,Data Quality — Patrick Durusau @ 7:08 pm

Applying “Lateral Thinking” to Data Quality by Ken O’Connor.

From the post:

I am a fan of Edward De Bono, the originator of the concept of Lateral Thinking. One of my favourite examples of De Bono’s brilliance, relates to dealing with the worldwide problem of river pollution.

River Discharge Pipe

De Bono suggested “each factory must be downstream of itself” – i.e. Require factories’ water inflow pipes to be just downstream of their outflow pipes.

Suddenly, the water quality in the outflow pipe becomes a lot more important to the factory. Apparently several countries have implemented this idea as law.

What has this got to do with data quality?

By applying the same principle to data entry, all downstream data users will benefit, and information quality will improve.

How could this be done?

So how do you move the data input pipe just downstream of the data outflow pipe?

Before you take a look at Ken’s solution, take a few minutes to brain storm about how you would do it.

Important for semantic technologies because there aren’t enough experts to go around. Meaning non-expert users will do a large portion of the work.

Comments/suggestions?

November 24, 2012

The Seventh Law of Data Quality

Filed under: Data,Data Quality — Patrick Durusau @ 12:02 pm

The Seventh Law of Data Quality by Jim Harris.

Jim’s series on the “laws” of data quality can be recommended without reservation. There are links to each one in his coverage of the seventh law.

The seventh of data quality law reads:

Determine the business impact of data quality issues BEFORE taking any corrective action in order to properly prioritize data quality improvement efforts.

I would modify that slightly to make it applicable to data issues more broadly as:

Determine the business impact of a data issue BEFORE addressing it at all.

Your data may be completely isolated in silos, but without a business purpose to be served by freeing them, why bother?

And that purpose should have a measurable ROI.

In the absence of a business purpose and a measurable ROI, keep both hands on your wallet.

October 28, 2012

Acknowledging Errors in Data Quality

Filed under: Data Quality,Users — Patrick Durusau @ 2:21 pm

Acknowledging Errors in Data Quality by Jim Harris.

From the post:

The availability heuristic is a mental shortcut that occurs when people make judgments based on the ease with which examples come to mind. Although this heuristic can be beneficial, such as when it helps us recall examples of a dangerous activity to avoid, sometimes it leads to availability bias, where we’re affected more strongly by the ease of retrieval than by the content retrieved.

In his thought-provoking book “Thinking, Fast and Slow,” Daniel Kahneman explained how availability bias works by recounting an experiment where different groups of college students were asked to rate a course they had taken the previous semester by listing ways to improve the course — while varying the number of improvements that different groups were required to list.

Jim applies the result of Kahneman’s experiment to data quality issues and concludes:

  • Isolated errors – Management chooses one-time data cleaning projects.
  • Ten errors – Management concludes overall data quality must not be too bad (availability heuristic).

I need to re-read Kahneman but have you seen suggestions for overcoming the availability heuristic?

October 25, 2012

Data Preparation: Know Your Records!

Filed under: Data,Data Quality,Semantics — Patrick Durusau @ 10:25 am

Data Preparation: Know Your Records! by Dean Abbott.

From the post:

Data preparation in data mining and predictive analytics (dare I also say Data Science?) rightfully focuses on how the fields in ones data should be represented so that modeling algorithms either will work properly or at least won’t be misled by the data. These data preprocessing steps may involve filling missing values, reigning in the effects of outliers, transforming fields so they better comply with algorithm assumptions, binning, and much more. In recent weeks I’ve been reminded how important it is to know your records. I’ve heard this described in many ways, four of which are:
the unit of analysis
the level of aggregation
what a record represents
unique description of a record

A bit further on Dean reminds us:

What isn’t always obvious is when our assumptions about the data result in unexpected results. What if we expect the unit of analysis to be customerID/Session but there are duplicates in the data? Or what if we had assumed customerID/Session data but it was in actuality customerID/Day data (where ones customers typically have one session per day, but could have a dozen)? (emphasis added)

Obvious once Dean says it, but how often do you question assumptions about data?

Do you know what impact incorrect assumptions about data will have on your operations?

If you investigate your assumptions about data, where do you record your observations?

Or will you repeat the investigation with every data dump from a particular source?

Describing data “in situ” could benefit you six months from now or your successor. (The data and or its fields would be treated as subjects in a topic map.)

September 23, 2012

Working More Effectively With Statisticians

Filed under: Bioinformatics,Biomedical,Data Quality,Statistics — Patrick Durusau @ 10:33 am

Working More Effectively With Statisticians by Deborah M. Anderson. (Fall 2012 Newsletter of Society for Clinical Data Management, pages 5-8)

Abstract:

The role of the clinical trial biostatistician is to lend scientific expertise to the goal of demonstrating safety and efficacy of investigative treatments. Their success, and the outcome of the clinical trial, is predicated on adequate data quality, among other factors. Consequently, the clinical data manager plays a critical role in the statistical analysis of clinical trial data. In order to better fulfill this role, data managers must work together with the biostatisticians and be aligned in their understanding of data quality. This article proposes ten specific recommendations for data managers in order to facilitate more effective collaboration with biostatisticians.

See the article for the details but the recommendations are generally applicable to all data collection projects:

Recommendation #1: Communicate early and often with the biostatistician and provide frequent data extracts for review.

Recommendation #2: Employ caution when advising sites or interactive voice/web recognition (IVR/IVW) vendors on handling of randomization errors.

Recommendation #3: Collect the actual investigational treatment and dose group for each subject.

Recommendation #4: Think carefully and consult the biostatistician about the best way to structure investigational treatment exposure and accountability data.

Recommendation #5: Clarify in electronic data capture (EDC) specifications whether a question is only a “prompt” screen or whether the answer to the question will be collected explicitly in the database.

Recommendation #6: Recognize the most critical data items from a statistical analysis perspective and apply the highest quality standards to them.

Recommendation #7: Be alert to protocol deviations/violations (PDVs).

Recommendation #8: Plan for a database freeze and final review before database lock.

Recommendation #9: Archive a snapshot of the clinical database at key analysis milestones and at the end of the study.

Recommendation #10: Educate yourself about fundamental statistical principles whenever the opportunity arises.

I first saw this at John Johnson’s Data cleaning is harder than statistical analysis.

July 4, 2012

Living with Imperfect Data

Filed under: Data,Data Governance,Data Quality,Topic Maps — Patrick Durusau @ 5:00 pm

Living with Imperfect Data by Jim Ericson.

From the post:

In a keynote at our MDM & Data Governance conference in Toronto a few days ago, an executive from a large analytical software company said something interesting that stuck with me. I am paraphrasing from memory, but it was very much to the effect of, “Sometimes it’s better to have everyone agreeing on numbers that aren’t entirely accurate than having everyone off doing their own numbers.”

Let that sink in for a moment.

After I did, the very idea of this comment struck me at a few levels. It might have the same effect on you.

In one sense, admitting there is an acceptable level of shared inaccuracy is anathema to the way we like to describe data governance. It was especially so at a MDM-centric conference where people are pretty single-minded about what constitutes “truth.”

As a decision support philosophy, it wouldn’t fly at a health care conference.

I rather like that: “Sometimes it’s better to have everyone agreeing on numbers that aren’t entirely accurate than having everyone off doing their own numbers.”

I suspect because it is the opposite of how I really like to see data. I don’t want rough results, say in a citation network but rather all the relevant citations. Even if it isn’t possible to review all the relevant citations. Still need to be complete.

But completeness is the enemy of results or at least published results. Sure, eventually, assuming a small enough data set, it is possible to map it in its entirety. But that means that whatever good would have come from it being available sooner, has been lost.

I don’t want to lose the sense of rough agreement posed here, because that is important as well. There are many cases where, despite Fed and economists protests to the contrary, the numbers are almost fictional anyway. Pick some, they will be different soon enough. What counts is that we have agreed on numbers for planning purposes. Can always pick new ones.

The same is true for topic maps and perhaps even more so for topic maps. They are a view into an infoverse, fixed at a moment in time by authoring decisions.

Don’t like the view? Create another one.

June 5, 2012

Are You a Bystander to Bad Data?

Filed under: Data,Data Quality — Patrick Durusau @ 7:58 pm

Are You a Bystander to Bad Data? by Jim Harris.

From the post:

In his recent Harvard Business Review blog post “Break the Bad Data Habit,” Tom Redman cautioned against correcting data quality issues without providing feedback to where the data originated.

“At a minimum,” Redman explained, “others using the erred data may not spot the error. There is no telling where it might turn up or who might be victimized.” And correcting bad data without providing feedback to its source also denies the organization an opportunity to get to the bottom of the problem.

“And failure to provide feedback,” Redman continued, “is but the proximate cause. The deeper root issue is misplaced accountability — or failure to recognize that accountability for data is needed at all. People and departments must continue to seek out and correct errors. They must also provide feedback and communicate requirements to their data sources.”

In his blog post, “The Secret to an Effective Data Quality Feedback Loop,” Dylan Jones responded to Redman’s blog post with some excellent insights regarding data quality feedback loops and how they can help improve your data quality initiatives.

[I removed two incorrect links in the quoted portion of Jim’s article. Were pointers to the rapper “Redman” and not Tom Redman. And I posted a comment on Jim’s blog about the error.]

Take the time to think about providing feedback on bad data.

Would bad data get corrected more often if correction was easier?

What if a data stream could be intercepted and corrected? Would that make correction easier?

Older Posts »

Powered by WordPress