Another Word For It Patrick Durusau on Topic Maps and Semantic Diversity

June 11, 2016

My Data Is Dirty! Basic Spreadsheet Cleaning Functions

Filed under: Data Quality,Journalism,News,Reporting,Spreadsheets — Patrick Durusau @ 8:59 am

My Data Is Dirty! Basic Spreadsheet Cleaning Functions by Paul Bradshaw.

A sample from Paul Bradshaw’s new book, Finding Stories in Spreadsheets.

Data is always dirty but you don’t always need a hazmat suit and supporting army of technicians.

Paul demonstrates Excel functions (sniff, other spreadsheet programs have the same functions), TRIM, SUBSTITUTE, CHAR, as easy ways to clean data.

Certainly makes me interested in what other techniques are lurking in Finding Stories in Spreadsheets.

Enjoy!

April 22, 2016

How to Use Excel

Filed under: Excel,Spreadsheets — Patrick Durusau @ 8:25 pm

At the other end of the software universe from Erlang is Excel. 😉

Sometimes you don’t need a hand rolled death ray but something more prosaic.

But you need skills even with simple tools. This tutorial will get you past a number of “obvious” to experienced Excel user gotchas.

How to Use Excel

From the post:

Ever find yourself elbows deep in an Excel worksheet with seemingly no end in sight? You’re manually replicating columns and scribbling down long-form math on a scrap of paper, all while thinking to yourself, “There has to be a better way to do this.”

Truth be told, there probably is … you just don’t know it yet. In a world where being proficient in Excel is often regarded as no more impressive than being proficient at breathing, there are still plenty of tips and tricks that remain unknown to the majority of office workers.

Mastering Excel specifically for marketing is another beast in its own right. More than likely, you’ve already been tasked with analyzing data from an NPS survey, performing a content topic analysis, or pulling in sales data to calculate return on marketing investment — all of which require a bit more Excel knowledge than a simple SUM formula.

Here’s where this guide comes in. Whether you’d like to speed up your chart formatting, finally understand pivot tables, or complete a VLOOKUP (I promise it’s not as scary as it sounds), we’ll teach you everything you need to know to call yourself a master of Excel — and truly mean it.

Since we all know that reading about Excel may not be the most captivating topic, we’ve tried to cater the training to your unique learning style. At the start of each advanced topic, you’ll find a short video to dip your toe in the water — a perfect solution for those pressed for time and in search of a quick answer. Next, the deep dive. Read along for a few extra functions and reporting insight. Finally, for those who learn best by doing, we’ve included Test Your Skills questions at the close of each chapter for you to complete with our Excel practice document.

Enjoy!

April 11, 2016

SEMS 2016 (Auditable Spreadsheets – Quick Grab Your Heart Pills)

Filed under: Programming,Spreadsheets,Transparency — Patrick Durusau @ 3:12 pm

3rd International Workshop on Software Engineering Methods in Spreadsheets

July 4, 2016 Vienna, Austria

Abstracts due: April 11th (that’s today!)

Papers due: April 22nd

From the webpage:

SEMS is the #1 venue for academic spreadsheet research since 2014 (SEMS’14, SEMS’15). This year, SEMS’16 is going to be co-located with STAF 2016 in Vienna.

Spreadsheets are heavily used in industry as they are easy to create and evolve through their intuitive visual interface. They are often initially developed as simple tools, but, over time, spreadsheets can become increasingly complex, up to the point they become too complicated to maintain. Indeed, in many ways, spreadsheets are similar to “professional” software: both concern the storage and manipulation of data, and the presentation of results to the user. But unlike in “professional” software, activities like design, implementation, and maintenance in spreadsheets have to be undertaken by end-users, not trained professionals. This makes applying methods and techniques from other software technologies a challenging task.

The role of SEMS is to explore the possibilities of adopting successful methods from other software contexts to spreadsheets. Some, like testing and modeling, have been tried before and can be built upon. For methods that have not yet been tried on spreadsheets, SEMS will serve as a platform for early feedback.

The SEMS program will include an industrial keynote, followed by a brainstorming session about the topic, a discussion panel of industrial spreadsheet usage, presentation of short and long research papers and plenty of lively discussions. The intended audience is a mixture of spreadsheet researchers and professionals.

Felienne Hermans pioneered viewing spreadsheets as programming artifacts, a view that can result in easier maintenance and even, gasp, auditing of spreadsheets.

Inspectors General, GAO and other birds of that feather should sign up for this conference.

Remember topic maps for cumulative and customized auditing data. For example, who, by name, was explaining entries that several years later appear questionable? Topic maps can capture as much or as little data as you require.

Attend, submit an abstract today and a paper in two weeks!

November 2, 2015

Interactive visual machine learning in spreadsheets

Filed under: Interface Research/Design,Machine Learning,Spreadsheets,Visualization — Patrick Durusau @ 7:59 am

Interactive visual machine learning in spreadsheets by Advait Sarkar, Mateja Jamnik, Alan F. Blackwell, Martin Spott.

Abstract:

BrainCel is an interactive visual system for performing general-purpose machine learning in spreadsheets, building on end-user programming and interactive machine learning. BrainCel features multiple coordinated views of the model being built, explaining its current confidence in predictions as well as its coverage of the input domain, thus helping the user to evolve the model and select training examples. Through a study investigating users’ learning barriers while building models using BrainCel, we found that our approach successfully complements the Teach and Try system [1] to facilitate more complex modelling activities.

To assist users in building machine learning models in spreadsheets:

The user should be able to critically evaluate the quality, capabilities, and outputs of the model. We present “BrainCel,” an interface designed to facilitate this. BrainCel enables the end-user to understand:

  1. How their actions modify the model, through visualisations of the model’s evolution.
  2. How to identify good training examples, through a colour-based interface which “nudges” the user to attend to data where the model has low confidence.
  3. Why and how the model makes certain predictions, through a network visualisation of the k-nearest neighbours algorithm; a simple, consistent way of displaying decisions in an arbitrarily high-dimensional space.

A great example of going where users are spending their time, spreadsheets, as opposed to originating new approaches to data they already possess.

To get a deeper understanding of the Sarkar’s approach to users via spreadsheets as an interface, see also:

Spreadsheet interfaces for usable machine learning by Advait Sarkar.

Abstract:

In the 21st century, it is common for people of many professions to have interesting datasets to which machine learning models may be usefully applied. However, they are often unable to do so due to the lack of usable tools for statistical non-experts. We present a line of research into using the spreadsheet — already familiar to end-users as a paradigm for data manipulation — as a usable interface which lowers the statistical and computing knowledge barriers to building and using these models.

Teach and Try: A simple interaction technique for exploratory data modelling by end users by Advait Sarkar, Alan F Blackwell, Mateja Jamnik, Martin Spott.

Abstract:

The modern economy increasingly relies on exploratory data analysis. Much of this is dependent on data scientists – expert statisticians who process data using statistical tools and programming languages. Our goal is to offer some of this analytical power to end-users who have no statistical training through simple interaction techniques and metaphors. We describe a spreadsheet-based interaction technique that can be used to build and apply sophisticated statistical models such as neural networks, decision trees, support vector machines and linear regression. We present the results of an experiment demonstrating that our prototype can be understood and successfully applied by users having no professional training in statistics or computing, and that the experience of interacting with the system leads them to acquire some understanding of the concepts underlying exploratory statistical modelling.

Sarkar doesn’t mention it but while non-expert users lack skills with machine learning tools, they do have expertise with their own data and domain. Data/domain expertise that is more difficult to communicate to an expert user than machine learning techniques to the non-expert.

Comparison of machine learning expert vs. domain data expert analysis lies in the not too distant and interesting future.

I first saw this in a tweet by Felienne Hermans.

August 26, 2015

Spreadsheets are graphs too!

Filed under: Cypher,Neo4j,Spreadsheets,SQL — Patrick Durusau @ 8:25 pm

Spreadsheets are graphs too! by Felienne Hermans.

Presentation with transcript.

Felienne starts with a great spreadsheet story:

When I was in grad school, I worked with an investment bank doing spreadsheet research. On my first day, I went to the head of the Excel team.

I said, ‘Hello, can I have a list of all your spreadsheets?’

There was no such thing.

‘We don’t have a list of all the spreadsheets,’ he said. ‘You could ask Frank in Accounting or maybe Harry over at Finance. He’s always talking about spreadsheets. I don’t really know, but I think we might have 10,000 spreadsheets.’

10,000 spreadsheets was a gold mine of research, so I went to the IT department and conducted my first spreadsheet scan with root access in Windows Explorer.

Within one second, it had already found 10,000 spreadsheets. Within an hour, it was still finding more, with over one million Excel files located. Eventually, we found 2.5 million spreadsheets.

In short, spreadsheets run the world.

She continues to outline spreadsheet horror stories and then demonstrates how complex relationships between cells can be captured by Neo4j.

Which are much easier to query with Cypher than SQL!

While I applaud:


I realized that spreadsheet information is actually very graphy. All the cells are connected to references to each other and they happen to be in a worksheet or on the spreadsheet, but that’s not really what matters. What matters is the connections.

I would be more concerned with the identity of the subjects between which connections have been made.

Think of it as documenting the column headers from a five year old spreadsheet, that you are now using by rote.

Knowing the connections between cells is a big step forward. Knowing what the cells are supposed to represent is an even bigger one.

August 13, 2015

Spreadsheets – 90+ million End User Programmers…

Filed under: Spreadsheets,TMRM,Topic Maps — Patrick Durusau @ 6:56 pm

Spreadsheets – 90+ million End User Programmers With No Comment Tracking or Version Control by Patrick Durusau and Sam Hunting.

From all available reports, Sam Hunting did a killer job presenting our paper at the Balisage conference on Wednesday of this week! Way to go Sam!

I will be posting the slides and the files shown in the presentation tomorrow.

BTW, development of the topic map for one or more Enron spreadsheets will continue.

Watch this blog for future developments!

July 23, 2015

Exploring the Enron Spreadsheet/Email Archive

Filed under: Enron,Spreadsheets,Topic Maps — Patrick Durusau @ 2:55 pm

I forgot to say yesterday that if you cite the work of Felienne Hermans and Emerson Murphy-Hill Enron archive, use this citation:

@inproceedings{hermans2015,
  author    = {Felienne Hermans and
               Emerson Murphy-Hill},
  title     = {Enron's Spreadsheets and Related Emails: A Dataset and Analysis},
  booktitle = {37th International Conference on Software Engineering, {ICSE} '15},
  note     =  {to appear}
}

A couple of interesting tidbits from this morning.

Non-Matching Spreadsheet Names

If you look at:

(local)/84_JUDY_TOWNSEND_000_1_1.PST/townsend-j/JTOWNSE (Non-Privileged)/Inbox/_1687004514.eml

You will find that David.Jones@ENRON.com (sender), sent an email with Tport Max Rates Calculations 10-27-01.xls attached, to fletcjv@NU.COM and cc:ed “Concannon” and “Townsend” . (Potential subjects in bold.)

I selected this completely at random, save for finding an email that using the word “spreadsheet.”

If you look in the spreadsheet archive, you will not find “Tport Max Rates Calculations 10-27-01.xls,” at least not by that name. You will find: “judy_townsend__17745__Tport Max Rates Calculations 10-27-01.xlsx.”

I don’t know when that conversion took place but thought it was worth noting. BTW, the spreadsheet archive has 15,871 .xlsx files and 58 .xls files. Michelle Lokay has thirty-two of the fifty-eight (58) .xls files but they all appear to be duplicated by files with the .xlsx extension.

Given the small number, I suspect an anomaly in a bulk conversion process. When I do group operations on the spreadsheets I will be using the .xlsx extension only to avoid duplicates.

Dirty, Very Dirty Data

I was just randomly opening spreadsheets when I encountered this jewel:

andrea_ring_ENRONGAS(1200)

Using rows to format column headers. There are worse examples, try:

albert_meyers_1_1-25act

No columns headers at all! (On this tab.)

I am beginning to suspect that the conversion to .xslx format was to enable the use of better tooling to explore the originally .xls files.

Be sure to register for Balisage 2015 if you want to see the outcome of all this running around!

Tomorrow I think we are going to have a conversation about indexing email with Solr. Having all 15K spreadsheets doesn’t tell me which ones were spoken of the most often in email.

July 22, 2015

Enron, Spreadsheets and 7z

Filed under: Enron,Spreadsheets,Topic Maps — Patrick Durusau @ 9:00 pm

Sam Hunting and I are working on a presentation for Balisage that involves a subset of the Enron dataset focused on spreadsheets.

You will have to attend Balisage to see the floor show but I will be posting notes about our preparations for the demo under the category Enron and/or Spreadsheets.

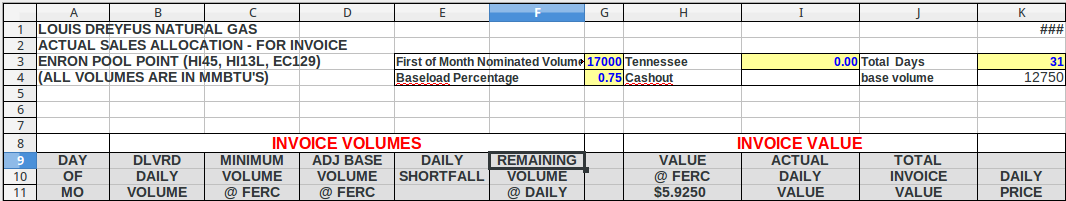
Origin of the Enron dataset on Spreadsheets

First things first, the subset of the Enron dataset focused on spreadsheets was announced by Felienne Hermans in A modern day Pompeii: Spreadsheets at Enron.

The data set: Hermans, Felienne (2014): Enron Spreadsheets and Emails. figshare. http://dx.doi.org/10.6084/m9.figshare.1221767

Feilienne has numerous presentations and publications on spreadsheets and issues with spreadsheets.

I have always thought of spreadsheets as duller versions of tables.

Felienne, on the other hand, has found intrigue, fraud, error, misunderstanding, opacity, and the usual chicanery of modern business practice.

Whether you want to “understand” a spreadsheet depends on whether you need plausible deniability or if you are trying to detect efforts at plausible deniability. Auditors for example.

Felienne’s Enron spreadsheet data set is a great starting point for investigating spreadsheets and their issues.

Unpacking the Archives with 7z

The email archive comes in thirteen separate files, eml.7z.001 – eml.7z.013.

At first I tried to use 7z to assemble the archive, decompress it and grep the results without writing it out. No go.

On a subsequent attempt, just unpacking the multi-part file, a message appeared announcing a name conflict and asking what to do with the conflict.

IMPORTANT POINT: Thinking I don’t want to lose any data, I foolishly said to rename files to avoid naming conflicts.

You are probably laughing at this point because you can see where this is going.

The command I used to first extract the files reads: 7z e eml.7z.001 (remembering that in the case of name conflicts I said to rename the conflicting file).

But if you use 7z e, all the files are written to a single directory. Which of course means for every single file write, it has to check for conflicting file names. Opps!

After more than twenty-four (24) hours of ever slowing output (# of files was at 528,000, approximately), I killed the process and took another path.

I used 7z x eml.7z001 (correct command), which restores all of the original directories and therefore there are no file name conflicts. File writing I/O jumped up to 20MB/sec+, etc.

Still took seventy-eight (78) minutes to extract but there were other heavy processes going on at the same time.

Like deleting the 528K+ files in the original unpacked directory. Did you know that rm has an argument limit? I’m sure you won’t encounter it often but it can be a real pain when you do. I was deleting all the now unwanted files from the first run when I encountered it.

A shell limitation according to: Argument List Too Long. A 128K limit to give you an idea of the number of files you need to encounter before hitting this issue.

The Lesson

Unpack the Enron email archive with: 7z x eml.7z.001.

Tomorrow I will be posting about using Unix shell tools to explore the email data.

PS: Register for Balisage today!

March 8, 2015

Data Journalism (Excel)

Filed under: Excel,Journalism,Spreadsheets — Patrick Durusau @ 2:01 pm

Data Journalism by Ken Blake.

From the webpage:

Learning to use a spreadsheet will transform how you do what you do as a media professional. The YouTube-hosted videos below demonstrate some of the possibilities. If you like, download the datasets and follow along.

I use the PC version of Excel 2010, Microsoft’s cheap, ubiquitous spreadsheet program. It can do some things that the Mac version can’t. But if you’re a Mac user, you’ll still find plenty worth watching.

Everything is free to watch and download. If you’d like to use these materials elsewhere, please just e-mail me first and ask permission. Questions, suggestions and requests are welcome, too. See my contact information.

And check back now and then. I’ll be adding more stuff soon.

Disclaimer: These tutorials will not help you perform NLP on Klingon nor are they a guide to GPU-based deep learning in order to improve your play in Mortal Kombat X.

Having gotten those major disappointments out of the way, these tutorials will help you master Excel and to use it effectively in uncovering the misdeeds of small lives in local and state government.

To use “big data” tools with small data is akin to hunting rats with an elephant gun. Doable, but expensive and difficult to master.

As an added bonus, processing small data will give you experience with the traps and pitfalls of data, which remain important whether your data sets are big or small.

Enjoy!

February 4, 2015

Creating Excel files with Python and XlsxWriter

Filed under: Excel,Microsoft,Python,Spreadsheets — Patrick Durusau @ 4:53 pm

Creating Excel files with Python and XlsxWriter

From the post:

XlsxWriter is a Python module for creating Excel XLSX files.

demo-xlsxwriter

(Sample code to create the above spreadsheet.)

XlsxWriter

XlsxWriter is a Python module that can be used to write text, numbers, formulas and hyperlinks to multiple worksheets in an Excel 2007+ XLSX file. It supports features such as formatting and many more, including:

  • 100% compatible Excel XLSX files.
  • Full formatting.
  • Merged cells.
  • Defined names.
  • Charts.
  • Autofilters.
  • Data validation and drop down lists.
  • Conditional formatting.
  • Worksheet PNG/JPEG images.
  • Rich multi-format strings.
  • Cell comments.
  • Memory optimisation mode for writing large files.

I know what you are thinking. If you are processing the data with Python, why the hell would you want to write data to XSL or XLSX?

Good question! But it also has an equally good answer.

Attend a workshop for mid-level managers and introduce one of the speakers saying:

We are going to give away copies of the data used in this presentation. By show of hands, how many people want it in R format? Now, how many people want it in Excel format?

Or you can reverse the questions so the glazed look from the audience on the R question doesn’t blind you. 😉

If your data need to transition to management, at least most management, spreadsheet formats are your friend.

If you don’t believe me, see any number of remarkable presentation by Felienne Hermans on the use of spreadsheets or check out my spreadsheets category.

Don’t get me wrong, I prefer being closer to the metal but on the other hand, delivering data that users can use is more profitable than the alternatives.

I first saw this in a tweet by Scientific Python.

January 15, 2015

Data analysis to the MAX()

Filed under: Excel,Spreadsheets — Patrick Durusau @ 7:45 pm

Data analysis to the MAX() by Felienne Hermans

School: DelftX

Course Code: EX101x

Classes Start: 6 Apr 2015

Course Length: 8 weeks

Estimated effort: 4-6 hours per week

From the webpage:

EX101x is for all of those struggling with data analysis. That crazy spreadsheet from your boss? Megabytes of sensor data to analyze? Looking for a smart way visualize your data in order to make sense out of it? We’ve got you covered!

Using video lectures and hands-on exercises, we will teach you techniques and best practices that will boost your data analysis skills.

We will take a deep dive into data analysis with spreadsheets: PivotTables, VLOOKUPS, Named ranges, what-if analyses, making great graphs – all those will be covered in the first weeks of the course. After, we will investigate the quality of the spreadsheet model, and especially how to make sure your spreadsheet remains error-free and robust.

Finally, once we have mastered spreadsheets, we will demonstrate other ways to store and analyze data. We will also look into how Python, a programming language, can help us with analyzing and manipulating data in spreadsheets.

EX101x will be created using Excel 2013, but the course can be followed using another spreadsheet program as well.

The goal of this course is it to help you to overcome data analysis challenges in your work, research or studies. Therefore we encourage you to participate actively and to raise real data analysis problems that you face in our discussion forums.

Want to stay up to date with the latest news on EX101x and behind the scenes footage? We have a Twitter account -> @EX101x

If your boss is a spreadsheet user (most of them are), imagine being able to say that not only does Mahout say this is the answer, so does their spreadsheet. 😉

I have never seen Felienne speak in person but I have seen enough videos to know she is a dynamic speaker. Enjoy!

June 3, 2014

Google Spreadsheets -> R

Filed under: R,Spreadsheets — Patrick Durusau @ 2:01 pm

Reading data from the new version of Google Spreadsheets by Andrie de Vries.

From the post:

Spreadsheets remain an important way for people to share and work with data. Among other providers, Google has provided the ability to create online spreadsheets and other documents.

Back in 2009, David Smith posted a blog entry on how to use R, and specifically the XML package to import data from a Google Spreadsheet. Once you marked your Google sheet as exported, it took about two lines of code to import your data into a data frame.

But things have changed

More recently, it seems that Google changed and improved the Spreadsheet product. Google's own overview of changes lists some changes, but one change isn't on this list. In the previous version, it was possible to publish a sheet as a csv file. In the new version it is still possible to publish a sheet, but the ability to do this as csv is no longer there.

On April 5, 2014 somebody asked a question on StackOverflow on how to deal with this.

Because I had the same need to import data from a spreadsheet shared in our team, I set out to find and answer.

Deep problems require a lot of time to solve but you feel productive after having solved them.

Solving shallow problems that eat up nearly as much time as deep ones, not so much.

Posts like this one can save you from re-inventing a solution or scouring the web for one, if not both.

File this under Google spreadsheets, extraction.

May 31, 2014

Stop blaming spreadsheets…

Filed under: Spreadsheets,Usability — Patrick Durusau @ 5:09 pm

Stop blaming spreadsheets (and take a good look in the mirror) by Felienne Hermans.

From the post:

This week, spreadsheets hit the news again, when data for a book written by economist Pikkety turned out to contain spreadsheet errors. On this, Daniele Lemire wrote a blog post warning people not to use spreadsheets for serious work. This is useless advice, let me explain why.

See Felienne’s post for the three reasons. She writes very well and I might mangle it trying to summarize.

I see Lemire’s complaint as similar to exhortations that users should be using Oxygen to create structured XML documents.

As opposed to using Open Office and styles to author complex documents in XML (unseen by the user).

You can guess which one authors more XML every day.

Users want technologies that help them accomplish day to day tasks. Successful software, like spreadsheets, takes that into account.

April 9, 2014

BumbleBee, a tool for spreadsheet formula transformations

Filed under: Excel,Functional Programming,Programming,Spreadsheets — Patrick Durusau @ 4:13 pm

BumbleBee, a tool for spreadsheet formula transformations by Felienne Hermans.

From the webpage:

Some spreadsheets can be improved

While looking at spreadsheet and how they are used, over the past years I have noticed that many users don’t make their spreadsheets as easy as they could be. For instance, they use A1+A2+A3+A4+A5 instead of the simpler SUM(A1:A5) Sometimes because they are unaware of a simpler construct, or because the spreadsheet evolved over time. For instance, in used to be A1+A2, then A3 was added and so forth. Such complex formulas were exactly the aim of our previous work on smell detection.

If you say smell, you say… refactorings!

So in order to improve spreadsheets, we and other researchers have developed a number of refactorings to improve spreadsheet formulas. Over the last few months, I have been working on BumbleBee, a tool to perform not only refactorings, but more general transformations on spreadsheet formulas.

Update on her work on refactoring spreadsheets, along with a BumbleBee paper preprint, along with an installer for Excel 2010.

Imagine, going where users are using data.

This could prove to be explosively popular.

March 22, 2014

Building a Language for Spreadsheet Refactoring

Filed under: Excel,F#,Programming,Spreadsheets — Patrick Durusau @ 2:48 pm

Building a Language for Spreadsheet Refactoring by Felienne Hermans.

Summary:

Felienne Hermans introduces BumbleBee, a refactoring and metaprogramming spreadsheets tool based on a DSL that can perform transformations against spreadsheet formulas.

Argues that spreadsheets are code, rather convincingly. (Answer to the everybody must code argument?)

Uses code smell based analysis.

Has authored a refactoring tool for Excel.

Covers functional programming in F# to create the refactoring for Excel.

Analyzing and Visualizing Spreadsheets Felienne’s dissertation.

Abstract:

Spreadsheets are used extensively in industry: they are the number one tool for financial analysis and are also prevalent in other domains, such as logistics and planning. Their flexibility and immediate feedback make them easy to use for non-programmers.

But as easy as spreadsheets are to build, so difficult can they be to analyze and adapt. This dissertation aims at developing methods to support spreadsheet users to understand, update and improve spreadsheets. We took our inspiration for such methods from software engineering, as this field is specialized in the analysis of data and calculations. In this dissertation, we have looked at four different aspects of spreadsheets: metadata, structure, formulas and data. We found that methods from software engineering can be applied to spreadsheets very well, and that these methods support end-users in working with spreadsheets.

If you agree that spreadsheets are programming, how often do you think user/programmers are capturing the semantics of their spreadsheets?

That’s what I thought as well.

PS: Felienne’s website: http://felienne.com, Twitter: @felienne

January 29, 2014

Change Tracking, Excel, and Subjects

Filed under: Spreadsheets,Subject Identity — Patrick Durusau @ 2:21 pm

Change tracking is an active topic of discussion in the OpenDocument TC at OASIS. So much so that a sub-committee was formed to create a change tracking proposal for ODF 1.3. OpenDocument – Advanced Document Collaboration SC

In a recent discussion, the sub-committee was reminded that MS Excel, that change tracking is only engaged when working on a “shared workbook.”

If I am working on a non-shared workbook, any changes I make, of whatever nature, formatting, data in cells, formulas, etc., are not being tracked.

Without change tracking, what are several subjects we can’t talk about in an Excel spreadsheet?

  1. We can’t talk about the author of a particular change.
  2. We can’t talk about the author of a change relative to other people or events (such as emails).
  3. We can’t talk about a prior value or formula “as it was.”
  4. We can’t talk about the origin of a prior value or formula.
  5. We can’t talk about a prior value or formula as compared to a later value or formula.

Transparency is the watchword of government and industry.

Opacity is the watchword of spreadsheet change tracking.

Do you see a conflict there?

Supporting the development change tracking in Open Document (ODF) at the OpenDocument TC could shine a bright light in a very dark place.

January 6, 2014

TU Delft Spreadsheet Lab

Filed under: Business Intelligence,Data Mining,Spreadsheets — Patrick Durusau @ 5:07 pm

TU Delft Spreadsheet Lab

From the about page:

The Delft Spreadsheet Lab is part of the Software Engineering Research Group of the Delft University of Technology. The lab is headed by Arie van Deursen and Felienne Hermans. We work on diverse topics concerning spreadsheets, such as spreadsheet quality, design patterns testing and refactoring. Our current members are:

This project started last June so there isn’t a lot of content here, yet.

Still, I mention it as a hedge against the day that some CEO “discovers” all the BI locked up in spreadsheets that are scattered from one end of their enterprise to another.

Perhaps they will name it: Big Relevant Data, or some such.

Oh, did I mention that spreadsheets have no change tracking? Or means to document as part of the spreadsheet the semantics of it data or operations?

At some point those and other issues are going to become serious concerns, not to mention demands upon IT to do something, anything.

For IT to have a reasoned response to demands of “do something, anything,” a better understanding of spreadsheets is essential.

PS: Before all the Excel folks object that Excel does track changes, you might want to read: Track Changes in a Shared Workbook. As Obi-Wan Kenobi would say, “it’s true, Excel does track changes, from a certain point of view.” 😉

November 11, 2013

Spreadsheets:… [95% Usage]

Filed under: Documentation,Spreadsheets,Topic Maps — Patrick Durusau @ 7:57 pm

Spreadsheets: The Ununderstood Dark Matter of IT by Felienne Hermans.

Description:

Spreadsheets are used extensively in industry: they are the number one tool for financial analysis and are also prevalent in other domains, such as logistics and planning. Their flexibility and immediate feedback make them easy to use for non-programmers. But they are as easy to build, as they are difficult to analyze, maintain and check. Felienne’s research aims at developing methods to support spreadsheet users to understand, update and improve spreadsheets. Inspiration was taken from classic software engineering, as this field is specialized in the analysis of data and calculations. In this talk Felienne will summarize her recently completed PhD research on the topic of spreadsheet structure visualization, spreadsheet smells and clone detection, as well as presenting a sneak peek into the future of spreadsheet research as Delft University.

Some tidbits to interest you in the video:

“95% of all U.S. corporations still use spreadsheets.”

“Spreadsheet can have a long life, 5 years on average.”

“No docs, errors, long life. It looks like software!”

Designing a tool for software users are using, as opposed to designing tools users ought to be using.

What a marketing concept!

Not a lot of details at the PerfectXL website.

PerfectXL analyzes spreadsheets but doesn’t address the inability of spreadsheets to capture robust metadata about data or its processing in a spreadsheet.

Pay particular attention to how Felienne distinguishes a BI dashboard from a spreadsheet. You have seen that before in this blog. (Hint: Search for “F-16” or “VW.”)

No doubt you will also like Felienne’s blog.

I first saw this in a tweet by Lars Marius Garshol.

October 26, 2013

Excel the Ultimate

Filed under: Excel,Spreadsheets — Patrick Durusau @ 1:04 pm

Excel the Ultimate by Christophe Grand.

I know. That was my reaction when I saw the tweet from Christophe.

On my Clojure feed no less!

Still, I was recovering from working out in the yard. If I was confused when I read something about Excel, no harm, no foul. 😉

Went back to it first after I rested up. You don’t want to be confused for this one.

It’s only twenty-four clicks to get through the slides. View them first.

Then take this link, https://github.com/cgrand/spreadmap, where you will find “spreadmap.”

What is spreadmap?

Evil Clojure library to turn Excel spreadsheets in persistent reactive associative structures.

I concede that Excel spreadsheets do not give voice to the powerless, access to the disenfranchised, or work as a force for democracy around the world.

Neither does the NSA. What was your question again?

October 10, 2013

Raw, a tool to turn spreadsheets to vector graphics

Filed under: Graphics,Spreadsheets,Visualization — Patrick Durusau @ 4:35 pm

Raw, a tool to turn spreadsheets to vector graphics by Nathan Yau.

From the post:

Sometimes it can be a challenge to produce data graphics in vector format, which is useful for high-resolution prints. Raw, an alpha-version tool by Density Design, helps make the process smoother.

As the description Nathan quotes says:

…it is a sketch tool, useful for quick and preliminary data explorations as well as for generating editable visualizations.

I’m comfortable with the idea of data explorations.

Makes it clear that no visualization is inherent in data but is a matter of choice.

April 11, 2013

Spreadsheet is Still the King of all Business Intelligence Tools

Filed under: Business Intelligence,Marketing,Spreadsheets,Topic Maps — Patrick Durusau @ 4:01 pm

Spreadsheet is Still the King of all Business Intelligence Tools by Jim King.

From the post:

The technology consulting firm Gartner Group Inc. once precisely predicated that BI would be the hottest technology in 2012. The year of 2012 witnesses the sharp and substantial increase of BI. Unexpectedly, spreadsheet turns up to be the one developed and welcomed most, instead of the SAP BusinessObjects, IBM Cognos, QlikTech Qlikview, MicroStrateg, or TIBCO Spotfire. In facts, no matter it is in the aspect of total sales, customer base, or the increment, the spreadsheet is straight the top one.

Why the spreadsheet is still ruling the BI world?

See Jim’s post for the details but the bottom line was:

It is the low technical requirement, intuitive and flexible calculation capability, and business-expert-oriented easy solution to the 80% BI problems that makes the spreadsheet still rule the BI world.

Question:

How do you translate:

  • low technical requirement
  • intuitive and flexible calculation capacity (or its semantic equivalent)
  • business-expert-oriented solution to the 80% of BI problems

into a topic map application?

January 31, 2012

Accelerating SQL Database Operations on a GPU with CUDA (merging spreadsheet data?)

Filed under: CUDA,GPU,Spreadsheets,SQL,SQLite — Patrick Durusau @ 4:33 pm

Accelerating SQL Database Operations on a GPU with CUDA by Peter Bakkum and Kevin Skadron.

Abstract:

Prior work has shown dramatic acceleration for various database operations on GPUs, but only using primitives that are not part of conventional database languages such as SQL. This paper implements a subset of the SQLite command processor directly on the GPU. This dramatically reduces the eff ort required to achieve GPU acceleration by avoiding the need for database programmers to use new programming languages such as CUDA or modify their programs to use non-SQL libraries.

This paper focuses on accelerating SELECT queries and describes the considerations in an efficient GPU implementation of the SQLite command processor. Results on an NVIDIA Tesla C1060 achieve speedups of 20-70X depending on the size of the result set.

Important lessons to be learned from this paper:

  • Don’t invent new languages for the average user to learn.
  • Avoid the need to modify existing programs
  • Write against common software

Remember that 75% of the BI market is still using spreadsheets. For all sorts of data but numeric data in particular.

I don’t have any experience with importing files into Excel but I assume there is a macro language that can used to create import processes.

Curious if there has been any work on creating import macros for Excel that incorporate merging as part of those imports?

That would:

  • Not be a new language for users to learn.
  • Avoid modification of existing programs (or data)
  • Be written against common software

I am not sure about the requirements for merging numeric data but that should make the exploration process all the more enjoyable.

January 18, 2012

Spreadsheet -> Topic Maps: Wrong Direction?

Filed under: Marketing,Spreadsheets,Topic Maps — Patrick Durusau @ 8:01 pm

After reading BI’s Dirty Secrets – Why Business People are Addicted to Spreadsheets and the post it points to, I started to wonder if the spreadsheet -> topic maps path was in the wrong direction?

For example, Spreadsheet Data Connector Released bills itself:

This project contains an abstract layer on top of the Apache POI library. This abstraction layer provides the Spreadsheet Query Language – eXql and additional method to access spreadsheets. The current version is designed to support the XLS and XLSX format of Microsoft© Excel® files.

The Spreadsheet Data Connector is well suited for all use cases where you have to access data in Excel sheets and you need a sophisticated language to address and query the data.

Do you remember “Capt. Wrongway Peachfuzz” from Bullwinkel? That is what this sounds like to me.

You are much more likely to be in Excel and need the subject identity/merging capabilities of topic maps. I won’t say the ratio of going to Excel versus going to topic maps, it’s too embarrassing.

If the right direction is topic maps -> spreadsheet, where should we locate the subject identity/merging capabilities?

What about configurable connectors that accept specification of data sources and subject identity/merging tests?

The BI user sees the spreadsheet just as they always have, as a UI.

Sounds plausible to me. How does it sound to you?

BI’s Dirty Secrets – Why Business People are Addicted to Spreadsheets

Filed under: Business Intelligence,Marketing,Spreadsheets — Patrick Durusau @ 7:51 pm

BI’s Dirty Secrets – Why Business People are Addicted to Spreadsheets by Rick Sherman.

SecretMicrosoft Excel spreadsheets are the top BI tool of choice. That choking sound you hear is vendors and IT people reacting viscerally when they confront this fact. Their responses include:

  • Business people are averse to change; they don’t want to invest time in learning a new tool
  • Business people don’t understand that BI tools such as dashboards are more powerful than spreadsheets; they’re foolish not to use them
  • Spreadsheets are filled with errors
  • Spreadsheets are from hell

IDC estimated that the worldwide spend on business analytics in 2011 was $90 billion. Studies have found that many firms have more than one BI tool in use, and often more than six BI tools. Yet a recent study found that enterprises have been “stuck” at about a 25% adoption rate of BI tools by business people for a few years.

So why have adoption rates flatlined in enterprises that have had these tools for a while? Are the pundits correct in saying that business people are averse to change, lazy or just ignorant of how wonderful BI tools are?

The answers are very different if you put yourself in the business person’s position.

Read Rick’s blog to see what business people think about changing from spreadsheets.

Have you ever heard the saying: If you can’t lick ’em, join ’em?

There have been a number of presentations/papers on going from spreadsheets to XTM topic maps.

I don’t recall any papers that address adding topic map capabilities to spreadsheets. Do you?

Seems to me the question is:

Should topic maps try for a percentage of the 25% slice of the BI pie (against other competing tools) or, try for a percentage of the 75% of the BI pie owed by spreadsheets?

To avoid the dreaded pie chart, I make images of the respective market shares, one three times the size of the other:

BI Market Shares

Question: If you could only have 3% of a market, which market would you pick?*

See, you are on your way to being a topic map maven and a successful entrepreneur.


* Any resemblance to a question on any MBA exam is purely coincidental.

Powered by WordPress