Another Word For It Patrick Durusau on Topic Maps and Semantic Diversity

January 17, 2017

#DisruptJ20 – 3 inch resolution aerial imagery Washington, DC @J20protests

Filed under: Geographic Data,Image Understanding,MapBox,Mapping,Maps — Patrick Durusau @ 4:22 pm

3 inch imagery resolution for Washington, DC by Jacques Tardie.

From the post:

We updated our basemap in Washington, DC with aerial imagery at 3 inch (7.5 cm) resolution. The source data is openly licensed by DC.gov, thanks to the District’s open data initiative.

If you aren’t familiar with Mapbox, there is no time like the present!

If you are interested in the just the 3 inch resolution aerial imagery, see: http://opendata.dc.gov/datasets?keyword=imagery.

Enjoy!

December 27, 2016

Your first steps with JOSM… [Mapping/Planning Disruption]

Filed under: MapBox,Maps,Open Street Map — Patrick Durusau @ 9:31 pm

Your first steps with JOSM – the Java OpenStreetMap editor by Ramya Ragupathy.

From the post:

OpenStreetMap’s web-based iD editor is the easiest and most convenient way to get started mapping. But there may come a time when you need more power – our mapping team uses the Java OpenStreetMap (JOSM) editor every day. JOSM allows you to map fast with keyboard shortcuts, a series of editing tools for common tasks and specialized plugins. Here is your guide to take your mapping skills to the next level.

I had to grin when I saw the advice:

Connect a two-button mouse to your computer to make working with JOSM easier.

At present I have an IBM trackpad keyboard, a Kensington Expert Mouse (roller ball) and a two-button scrolling mouse, all connected to the same box.

JOSM is probably too much for me to master for a mapping/planning disruption project I have underway but it is high on my next to master list.

Of course, you should avoid updating a public map with your planned disruption points, unless even with notice your disruption cannot be prevented.

Enjoy!

August 29, 2016

Mapping U.S. wildfire data from public feeds

Filed under: MapBox,Mapping,Maps,Open Data,Weather Data — Patrick Durusau @ 7:45 pm

Mapping U.S. wildfire data from public feeds by David Clark.

From the post:

With the Mapbox Datasets API, you can create data-based maps that continuously update. As new data arrives, you can push incremental changes to your datasets, then update connected tilesets or use the data directly in a map.

U.S. wildfires have been in the news this summer, as they are every summer, so I set out to create an automatically updating wildfire map.

An excellent example of using public data feeds to create a resource not otherwise available.

Historical fire data can be found at: Federal Wildland Fire Occurrence Data, spanning 1980 through 2015.

The Outlooks page of the National Interagency Coordination Center provides four month (from current month) outlook and weekly outlook fire potential reports and maps.

January 7, 2016

Search points of interest by radius with Mapbox GL JS

Filed under: MapBox,Mapping,Maps — Patrick Durusau @ 4:47 pm

Search points of interest by radius with Mapbox GL JS by Zach Beattie.

From the post:

Mapbox GL JS provides new and interesting ways to query data found on a map. We built an example that filters points of interest by genre, which uses the featuresAt method to only select data based on the position and radius of the circle. Drag the blue circle around the map to populate points of interest on the left. Zoom in and out on the circle to adjust the radius.

Visually, places of interest appear as colored dots on the map and you can select what type of places appear at all. You use the blue circle to move about the map and as it encompasses dots on the map, additional information appears to the left of the map.

That’s a poor description when compared to the experience. Visit the live map to really appreciate it.

Assuming a map of surveillance cameras and the movement of authorities (in near real time), this would make a handy planning tool.

August 31, 2015

Rendering big geodata on the fly with GeoJSON-VT

Filed under: Geospatial Data,MapBox,Topic Maps,Visualization — Patrick Durusau @ 8:33 pm

Rendering big geodata on the fly with GeoJSON-VT by Vladimir Agafonkin.

From the post:

Despite the amazing advancements of computing technologies in recent years, processing and displaying large amounts of data dynamically is still a daunting, complex task. However, a smart approach with a good algorithmic foundation can enable things that were considered impossible before.

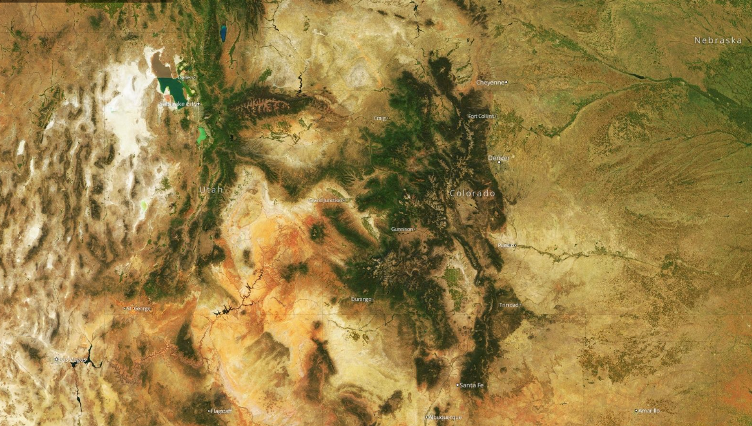
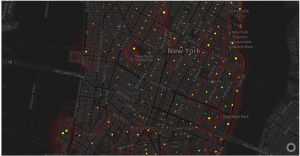
Let’s see if Mapbox GL JS can handle loading a 106 MB GeoJSON dataset of US ZIP code areas with 33,000+ features shaped by 5.4+ million points directly in the browser (without server support):

An observation from the post:


It isn’t possible to render such a crazy amount of data in its entirety at 60 frames per second, but luckily, we don’t have to:

  • at lower zoom levels, shapes don’t need to be as detailed
  • at higher zoom levels, a lot of data is off-screen

The best way to optimize the data for all zoom levels and screens is to cut it into vector tiles. Traditionally, this is done on the server, using tools like Mapnik and PostGIS.

Could we create vector tiles on the fly, in the browser? Specifically for this purpose, I wrote a new JavaScript library — geojson-vt.

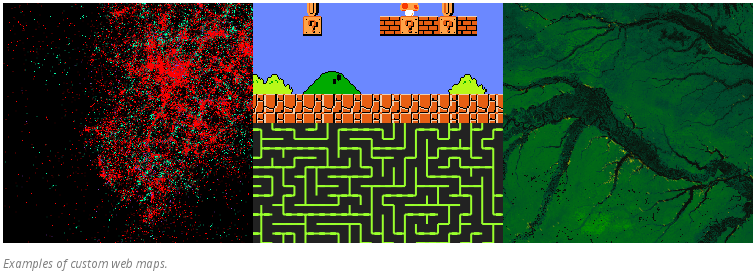
It turned out to be crazy fast, with its usefulness going way beyond the browser:

In addition to being a great demonstration of the visualization of geodata, I mention this post because it offers insights into the visualization of topic maps.

When you read:

  • at lower zoom levels, shapes don’t need to be as detailed
  • at higher zoom levels, a lot of data is off-screen

What do you think the equivalents would be for topic map navigation?

If we think of “shapes don’t need to be as detailed” for a crime topic map, could it be that all offenders, men, women, various ages, races and religions are lumped into an “offender” topic?

And if we think of “a lot of data is off-screen,” is that when we have narrowed a suspect pool down by gender, age, race, etc.?

Those dimensions would vary by the subject of the topic map and would require considering “merging” as a function of the “zoom” into a set of subjects.

Suggestions?

PS: BTW, do work through the post. For geodata this looks very good.

April 17, 2015

Join the Letter Hunt from Space with Aerial Bold

Filed under: MapBox,Mapping,Maps — Patrick Durusau @ 2:17 pm

Join the Letter Hunt from Space with Aerial Bold by Alex Barth.

From the post:

Imagine you could write text entirely made up of satellite imagery. Each letter would be a real world feature from a bird’s eye view. A house in the shape of an “A”, a lake in the shape of a “B”, a parking lot in the shape of a “C” and so on. This is the idea behind the nascent kickstarter funded project Aerial Bold. Its inventors Benedikt Groß and Joey Lee are right now collecting font shapes in satellite imagery for Aerial Bold and you can join the letter hunt from space.

mapbox-earth-letters

Letters are recognized from space, based on letter forms. But, more letter forms are needed!

Read the post, join the hunt:

Letter Finder App.

Enjoy!

March 20, 2015

Landsat-live goes live

Filed under: MapBox,Mapping,Maps — Patrick Durusau @ 7:10 pm

Landsat-live goes live by Camilla Mahon.

From the post:

Today we’re releasing the first edition of Landsat-live, a map that is constantly refreshed with the latest satellite imagery from NASA’s Landsat 8 satellite. Landsat 8 data is now publicly available on Amazon S3 via the new Landsat on AWS Public Data Set, making our live pipeline possible. We’re ingesting the data directly from Amazon S3, which is how we’re able to go from satellite to Mapbox map faster than ever. With every pixel captured within the past 32 days, Landsat-live features the freshest imagery possible around the entire planet.

With a 30 meter resolution, a 16 day revisit rate, and 10 multispectral bands, this imagery can be used to check the health of agricultural fields, the latest update on a natural disaster, or the progression of deforestation. Interact with the map above to see the freshest imagery anywhere in the world. Be sure to check back often and observe the constantly changing nature of our planet as same day imagery hits this constantly updating map. Scroll down the page to see some of our favorite stills of the earth from Landsat’s latest collection.

See Camilla’s post, you will really like the images.

Even with 30 meter resolution you will be able to document the impact of mapping projects that are making remote areas more accessible to exploitation.

January 2, 2015

Mapbox: Innovating with Landsat

Filed under: Government,MapBox,Mapping,Maps — Patrick Durusau @ 2:52 pm

Mapbox: Innovating with Landsat by Larisa Serbina and Holly Miller.

From the post:

Mapbox* is a cloud-based map platform startup that creates custom maps with open source tools. The team at Mapbox consists of over fifty cartographers, data analysts and software engineers, located in Washington, D.C. and San Francisco, California. One of the open-source tools used by Mapbox is Landsat imagery. The company has a satellite team consisting of five employees dedicated to projects that use Landsat imagery to develop new products and enhance existing imagery.

Charlie Loyd, a member of the satellite team at Mapbox, points out that Landsat imagery is an integral part of the satellite base layer which is a vital part of the business. “There are more than 800 billion Landsat-derived pixels of land in our imagery. If we printed out just our Landsat-based world map at poster resolution, it would cover two acres,” says Loyd.

Internal estimates at Mapbox show that licensing commercial imagery equivalent to Landsat would cost $4 million per year for the base layer alone. The company would face costs beyond $4 million to produce the current cloudless basemap product, which requires more input pixels than output pixels. These costs would prohibit further development of medium-resolution products. “In other words,” Loyd notes, “we make goods with Landsat that otherwise would not get made.” An example of a cloudless map derived from Landsat is shown in Figure 1.

MapBox Figure 1.65 percent

Figure 1. Example of a cloudless image of the western states in the U.S., composed using Landsat. Courtesy of Mapbox.

A great example of government undertaking a task that is beyond the reach of any individual and most enterprises. A task that results in data that can be re-used by others for a multitude of purposes.

Kudos to Mapbox and the USGS (US Geological Survey)!

If you are not familiar with the resources available from the USGS (US Geological Survey), you are in for a real treat.

December 25, 2014

Turf: GIS for web maps

Filed under: GIS,MapBox,Mapping,Maps — Patrick Durusau @ 8:51 pm

Turf: GIS for web maps by Morgan Herlocker.

From the post:

Turf is GIS for web maps. It’s a fast, compact, and open-source JavaScript library that implements the most common geospatial operations: buffering, contouring, triangular irregular networks (TINs), and more. Turf speaks GeoJSON natively, easily connects to Leaflet, and is now available as a Mapbox.js plugin on our cloud platform. We’re also working to integrate Turf into our offline products and next-generation map rendering tools.

newyork-pop-lines

(Population data from the US Census transformed in read-time into population isolines with turf-isoline.)

The image in the original post is interactive. Plus there are several other remarkable examples.

Turf is part of a new geospatial infrastructure. Unlike the ArcGIS API for JavaScript, Turf can run completely client-side for all operations, so web apps can work offline and sensitive information can be kept local. We’re constantly refining Turf’s performance. Recent research algorithms can make operations like clipping and buffering faster than ever, and as JavaScript engines like V8 continue to optimize, Turf will compete with native code.

Can you imagine how “Steal This Book” would have been different if Abbie Hoffman had access to technology such as this?

Would you like to try? 😉

November 8, 2014

An Open Platform (MapBox)

Filed under: MapBox,Mapping,Maps — Patrick Durusau @ 2:04 pm

An Open Platform (Mapbox)

From the post:

When you hear the term web map, what comes to mind first? You might have thought of a road map – maps created to help you get from one place to another. However, there are many other types of maps that use the same mapping conventions.

maps

Mapbox is built from open specifications to serve all types of maps, not just road maps. Open specifications solve specific problems so the solution is simple and direct.

This guide runs through all the open specifications Mapbox uses.

If you aren’t familiar with Mapbox, you need to correct that oversight.

There are Starter (free to start) and Basic ($5/month) plans, so it isn’t a burden to learn the basics.

Maps offer a familiar way to present information to users.

October 11, 2014

Making Your First Map

Filed under: MapBox,Mapping,Maps — Patrick Durusau @ 1:09 pm

Making Your First Map from Mapbox.

From the webpage:

Regardless of your skill level, we have the tools that allow you to quickly build maps and share them online in minutes.

In this guide, we’ll cover the basics of our online tool, the Mapbox Editor, by creating a store location map for a bike shop.

A great example of the sort of authoring interface that is needed by topic maps.

Hmmm, by the way, did you notice that “…creating a store location map for a bike shop” is creating an association between the “bike shop” and a “street location?” True, Mapbox doesn’t include roles or the association type but the role players are present.

For a topic map authoring interface, you could default the role of location for any geographic point on the map and the association type to be “street-location.”

The user would only have to pick, possibly from a pick list, the role of the role player, bike shop, bar, etc.

Mapbox could have started their guide with a review of map projections, used and theoretical.

Or covered the basics of surveying and a brief overview of surveying instruments. They didn’t.

I think there is a lesson there.

September 13, 2014

Why Use Google Maps When You Can Get GPS Directions On The Death Star Instead?

Filed under: Graphics,MapBox,Mapping,Maps — Patrick Durusau @ 5:05 pm

Why Use Google Maps When You Can Get GPS Directions On The Death Star Instead? by John Brownlee.

From the post:

Mapbox Studio is a toolkit that allows apps and websites to serve up their own custom-designed maps to users. Companies like Square, Pinterest, Foursquare, and Evernote con provide custom-skinned Mapboxes instead, changing map elements to better fit in with their brand.

But Mapbox can do far cooler stuff. It can blast you to Space Station Earth, a Mapbox that makes the entire planet look like the blinking, slate gray skin of the Star Wars Death Star.

Great if your target audience are Star Wars or similar science fiction fans or you can convince management that it will hold the attention of users longer.

Even routine tasks, like logging service calls answered, would be more enjoyable using an X-Wing fighter to destroy the location of the call after service has been completed. 😉

August 7, 2014

Mapbox GL For The Web

Filed under: Graphics,Javascript,MapBox,Visualization — Patrick Durusau @ 4:37 pm

Mapbox GL For The Web: An open source JavaScript framework for client-side vector maps by Eric Gundersen.

From the post:

Announcing Mapbox GL JS — a fast and powerful new system for web maps. Mapbox GL JS is a client-side renderer, so it uses JavaScript and WebGL to dynamically draw data with the speed and smoothness of a video game. Instead of fixing styles and zoom levels at the server level, Mapbox GL puts power in JavaScript, allowing for dynamic styling and freeform interactivity. Vector maps are the next evolution, and we’re excited to see what developers build with this framework. Get started now.

This rocks!

I not going to try to reproduce the examples here so see the original post!

What high performance maps are you going to create?

June 23, 2014

How Mapbox Works

Filed under: MapBox,Mapping,Maps — Patrick Durusau @ 6:59 pm

How Mapbox Works

From the post:

Mapbox is a platform for creating and using maps. That means that it’s a collection of tools and services that connect together in different ways: you can draw a map on the website, use it on an iPhone, and get raw data from an API.

Let’s look at the parts and how they connect.

Great post!

Just in time if you have been considering Iraq in 27 Maps and how some of the maps are just “wrong” from your point of view.

Using modern mapping technology, users are no longer relegated to passive acceptance of the maps of others.

May 20, 2014

Interactive Maps with D3.js, Three.js, and Mapbox

Filed under: D3,MapBox,Mapping,Maps — Patrick Durusau @ 7:05 pm

Interactive Maps with D3.js, Three.js, and Mapbox by Steven Hall.

From the post:

Over the past couple of weeks I have been experimenting with creating 2D maps that can be explored in three dimensional space using D3.js and Three.js.  The goal was to produce some highly polished prototypes with multiple choropleth maps that could be easily navigated on a single page.  Additionally, I wanted to make sure to address some of the common tasks that arise when presenting map data such as applying well-formatted titles, legends and elegantly handling mouse-over events. The two examples presented below use D3.js for for generating nested HTML elements that contain the maps, titles and labeling information and use Three.js to position the elements in 3D space using CSS 3D transforms.  Importantly, there is no WebGL used in these examples.  Everything is rendered in the DOM using CSS 3D transforms which, at the time of writing, has much wider browser support than WebGL.

This article is an extension of two of my previous articles on D3.js and Three.js that can be found here and here.   Below, I’ll go into more depth about how the examples are produced and some of the roadblocks I encountered in putting these demos together, but for more background on the general process it may be good to look at the first article in this series: D3.js, Three.js and CSS 3D Transforms.

The maps here are geographical maps but what Steve covers could be easily applied to other types of maps.

Powered by WordPress