Another Word For It Patrick Durusau on Topic Maps and Semantic Diversity

November 10, 2018

Relational inductive biases, deep learning, and graph networks

Filed under: Deep Learning,Graphs,Networks — Patrick Durusau @ 9:15 pm

Relational inductive biases, deep learning, and graph networks by Peter W. Battaglia, et al.

Abstract:

Artificial intelligence (AI) has undergone a renaissance recently, making major progress in key domains such as vision, language, control, and decision-making. This has been due, in part, to cheap data and cheap compute resources, which have fit the natural strengths of deep learning. However, many defining characteristics of human intelligence, which developed under much different pressures, remain out of reach for current approaches. In particular, generalizing beyond one’s experiences–a hallmark of human intelligence from infancy–remains a formidable challenge for modern AI.

The following is part position paper, part review, and part unification. We argue that combinatorial generalization must be a top priority for AI to achieve human-like abilities, and that structured representations and computations are key to realizing this objective. Just as biology uses nature and nurture cooperatively, we reject the false choice between “hand-engineering” and “end-to-end” learning, and instead advocate for an approach which benefits from their complementary strengths. We explore how using relational inductive biases within deep learning architectures can facilitate learning about entities, relations, and rules for composing them. We present a new building block for the AI toolkit with a strong relational inductive bias–the graph network–which generalizes and extends various approaches for neural networks that operate on graphs, and provides a straightforward interface for manipulating structured knowledge and producing structured behaviors. We discuss how graph networks can support relational reasoning and combinatorial generalization, laying the foundation for more sophisticated, interpretable, and flexible patterns of reasoning. As a companion to this paper, we have released an open-source software library for building graph networks, with demonstrations of how to use them in practice.

Forty pages of very deep sledding.

Just on a quick scan, I do take encouragement from:

An entity is an element with attributes, such as a physical object with a size and mass. (page 4)

Could it be that entities have identities defined by their attributes? Are the attributes and their values recursive subjects?

Only a close read of the paper will tell but I wanted to share it today.

Oh, the authors have released a library for building graph networks: https://github.com/deepmind/graph_nets.
February 10, 2018

JanusGraph + YugaByte (Does Cloud-Native Mean I Call Langley For Backup Support?)

Filed under: Graphs,JanusGraph — Patrick Durusau @ 8:59 pm

JanusGraph + YugaByte

Short tutorial on setting up JanusGraph to work with YugaByte DB.

I know JanusGraph so looked for more on YugaByte DB and found (overview):


Purpose-built for mission-critical applications

Mission-critical applications have a strong need for data correctness and high availability. They are typically composed of microservices with diverse workloads such as key/value, flexible schema, graph or relational. The access patterns vary as well. SaaS services or mobile/web applications keeping customer records, order history or messages need zero-data loss, geo-replication, low-latency reads/writes and a consistent customer experience. Fast data infrastructure use cases (such as IoT, finance, timeseries data) need near real-time & high-volume ingest, low-latency reads, and native integration with analytics frameworks like Apache Spark.

YugaByte DB offers polyglot persistence to power these diverse workloads and access patterns in a unified database, while providing strong correctness guarantees and high availability. You are no longer forced to create infrastructure silos for each workload or choose between different flavors SQL and NoSQL databases. YugaByte breaks down the barrier between SQL and NoSQL by offering both.

Cloud-native agility

Another theme common across these microservices is the move to a cloud-native architecture, be it on the public cloud, on-premises or hybrid environment. The primary driver is to make infrastructure agile. Agile infrastructure is linearly scalable, fault-tolerant, geo-distributed, re-configurabile with zero downtime and portable across clouds. While the container ecosystem led by Docker & Kubernetes has enabled enterprises to realize this vision for the stateless tier, the data tier has remained a big challenge. YugaByte DB is purpose-built to address these challenges, but for the data tier, and serves as the stateful complement to containers.

Only partially joking about “cloud-native” meaning you call Langley (CIA) for backup support.

Anything that isn’t air-gapped in a secure facility has been compromised. Note the use of past tense.

Disclosures about government spying, to say nothing of your competitors and lastly hackers, makes any other assumption untenable.

January 31, 2018

GraphDBLP [“dblp computer science bibliography” as a graph]

Filed under: Computer Science,Graphs,Neo4j,Networks — Patrick Durusau @ 3:30 pm

GraphDBLP: a system for analysing networks of computer scientists through graph databases by Mario Mezzanzanica, et al.

Abstract:

This paper presents GraphDBLP, a system that models the DBLP bibliography as a graph database for performing graph-based queries and social network analyses. GraphDBLP also enriches the DBLP data through semantic keyword similarities computed via word-embedding. In this paper, we discuss how the system was formalized as a multi-graph, and how similarity relations were identified through word2vec. We also provide three meaningful queries for exploring the DBLP community to (i) investigate author profiles by analysing their publication records; (ii) identify the most prolific authors on a given topic, and (iii) perform social network analyses over the whole community. To date, GraphDBLP contains 5+ million nodes and 24+ million relationships, enabling users to explore the DBLP data by referencing more than 3.3 million publications, 1.7 million authors, and more than 5 thousand publication venues. Through the use of word-embedding, more than 7.5 thousand keywords and related similarity values were collected. GraphDBLP was implemented on top of the Neo4j graph database. The whole dataset and the source code are publicly available to foster the improvement of GraphDBLP in the whole computer science community.

Although the article is behind a paywall, GraphDBLP as a tool is not! https://github.com/fabiomercorio/GraphDBLP.

From the webpage:

GraphDBLP is a tool that models the DBLP bibliography as a graph database for performing graph-based queries and social network analyses.

GraphDBLP also enriches the DBLP data through semantic keyword similarities computed via word-embedding.

GraphDBLP provides to users three meaningful queries for exploring the DBLP community:

  1. investigate author profiles by analysing their publication records;
  2. identify the most prolific authors on a given topic;
  3. perform social network analyses over the whole community;
  4. perform shortest-paths over DBLP (e.g., the shortest-path between authors, the analysis of co-author networks, etc.)

… (emphasis in original)

Sorry to see author, title, venue, publication, keyword all as flat strings but that’s not uncommon. Disappointing but not uncommon.

Viewing these flat strings as parts of structured representatives will be in addition to this default.

Not to minimize the importance of improving the usefulness of the dblp, but imagine integrating the GraphDBLP into your local library system. Without a massive data mapping project. That’s what lies just beyond the reach of this data project.

December 6, 2017

Paradise Papers – The Hand Job Edition – Some Small Joy

Filed under: Graphs,Neo4j,Paradise Papers — Patrick Durusau @ 11:18 am

I need to revise my assessment in Neo4j Desktop Download of Paradise Papers [It’s Not What You Hope For, Disappointment Ahead] to say it is disappointing, but does deliver a hand job version of Paradise Papers data for use in other programs.

Assuming you have made the AppImage file executable, here are the steps on Linux:

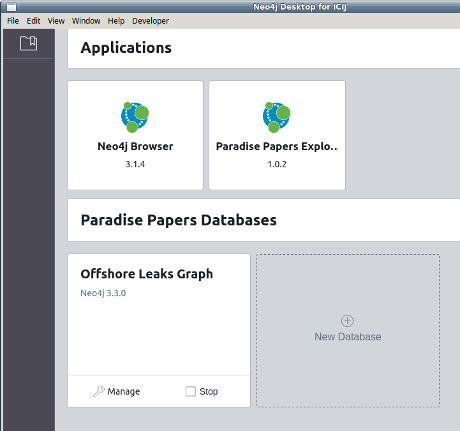
1. At the Linux command line type: ./neo4j-desktop-for-icij-1.0.0-x86_64.AppImage

2. Your initial start screen:

3. Notice the Manage Offshore Leaks Graph button:

4. The results of selecting “manage:”

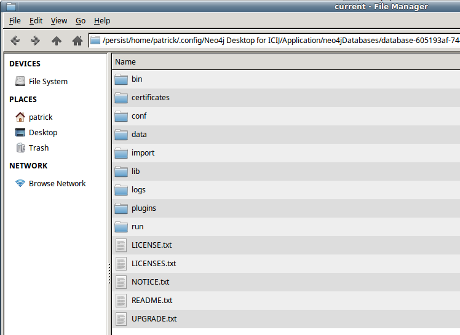
5. Follow the natural progression to data/databases/graph.db and you will find, among other files:

  • neostore.labelscanstore.db (729.1 KB)
  • neostore.nodestore.db (18.1 MB)
  • neostore.propertystore.db (347.9 MB)
  • neostore.propertystore.db.strings (414.9 MB)
  • neostore.relationshipstore.db (64.6 MB TGA image)

The files are, of course, in some binary format, but that’s solved easily enough.

6. Export the data following Michael Hunger’s Export a (sub)graph to Cypher script and import it again post.

7. Load into your favorite graph tool for data exploration.

People who profit from stolen data are very sensitive to licensing issues. Neo4j released this AppImage and its contents under GNU and some parts under an Apache license.

Looking forward to the day when you and the general public can explore all of the Paradise papers, not just selected facts others have chosen for you.

December 5, 2017

Neo4j Desktop Download of Paradise Papers [It’s Not What You Hope For, Disappointment Ahead]

Filed under: Graphs,Journalism,Neo4j,News,Reporting — Patrick Durusau @ 8:52 pm

Neo4j Desktop Download of Paradise Papers

Not for the first time, Neo4j marketing raises false hopes among potential users.

When you or I read “Paradise Papers,” we quite naturally think of the reputed cache of:

…13.4 million leaked files from a combination of offshore service providers and the company registries of some of the world’s most secretive countries.

Well, you aren’t going to find those “Paradise Papers” in the Neo4j Desktop download.

What you will find is highly processed data summarized as:


Data contained in the Paradise Papers:

  • Officer: a person or company who plays a role in an offshore entity.
  • Intermediary: go-between for someone seeking an offshore corporation and an offshore service provider — usually a law-firm or a middleman that asks an offshore service provider to create an offshore firm for a client.
  • Entity: a company, trust or fund created in a low-tax, offshore jurisdiction by an agent.
  • Address: postal address as it appears in the original databases obtained by ICIJ.
  • Other: additional information items.

Make no mistake, International Consortium of Investigative Journalists (ICIJ) does vital work that isn’t being done by anyone else. For that they merit full marks. Not to mention the quality of their data mining and reporting on the data they collect.

However, their hoarding of primary source materials deprives other journalists and indeed the general public of the ability to judge the accuracy and fairness of their reporting.

Using data derived from those hoarded materials to create a teaser database such as the “Paradise Papers” distributed by Neo4j only adds insult to injury. A journalist or member of the public can learn who is mentioned but is denied access to the primary materials that would make that mention meaningful.

You can learn a lot of about Neo4j from the “Paradise Papers,” but about the people and transactions mentioned in the actual Paradise Papers, not so much.

Imagine this as a public resource for citizens and law enforcement around the world, with links back to the primary documents.

That could make a difference for the citizens of entire countries, instead of for the insiders journalists managing the access to and use of the Paradise Papers.

PS: Have you thought about how you would extract the graph data from the .AppImage file?

November 30, 2017

Over Thinking Secret Santa ;-)

Filed under: Graphs,R — Patrick Durusau @ 10:27 am

Secret Santa is a graph traversal problem by Tristan Mahr.

From the post:

Last week at Thanksgiving, my family drew names from a hat for our annual game of Secret Santa. Actually, it wasn’t a hat but you know what I mean. (Now that I think about it, I don’t think I’ve ever seen names drawn from a literal hat before!) In our family, the rules of Secret Santa are pretty simple:

  • The players’ names are put in “a hat”.
  • Players randomly draw a name from a hat, become that person’s Secret Santa, and get them a gift.
  • If a player draws their own name, they draw again.

Once again this year, somebody asked if we could just use an app or a website to handle the drawing for Secret Santa. Or I could write a script to do it I thought to myself. The problem nagged at the back of my mind for the past few days. You could just shuffle the names… no, no, no. It’s trickier than that.

In this post, I describe a couple of algorithms for Secret Santa sampling using R and directed graphs. I use the DiagrammeR package which creates graphs from dataframes of nodes and edges, and I liberally use dplyr verbs to manipulate tables of edges.

If you would like a more practical way to use R for Secret Santa, including automating the process of drawing names and emailing players, see this blog post.

If you haven’t done your family Secret Santa yet, you are almost late! (November 30, 2017)

Enjoy!

November 29, 2017

Amazon Neptune (graph database, preview)

Filed under: Graph Analytics,Graphs,Gremlin,TinkerPop — Patrick Durusau @ 5:54 pm

Amazon Neptune

From the webpage:

Amazon Neptune is a fast, reliable, fully-managed graph database service that makes it easy to build and run applications that work with highly connected datasets. The core of Amazon Neptune is a purpose-built, high-performance graph database engine optimized for storing billions of relationships and querying the graph with milliseconds latency. Amazon Neptune supports popular graph models Property Graph and W3C’s RDF, and their respective query languages Apache TinkerPop Gremlin and SPARQL, allowing you to easily build queries that efficiently navigate highly connected datasets. Neptune powers graph use cases such as recommendation engines, fraud detection, knowledge graphs, drug discovery, and network security.

Amazon Neptune is highly available, with read replicas, point-in-time recovery, continuous backup to Amazon S3, and replication across Availability Zones. Neptune is secure, with support for encryption at rest and in transit. Neptune is fully-managed, so you no longer need to worry about database management tasks such as hardware provisioning, software patching, setup, configuration, or backups.

Sign up for the Amazon Neptune preview here.

I’m skipping the rest of the graph/Amazon promotional material because if you are interested, you know enough about graphs to be bored by the repetition.

Interested in know your comments on:


Amazon Neptune provides multiple levels of security for your database, including network isolation using Amazon VPC, encryption at rest using keys you create and control through AWS Key Management Service (KMS), and encryption of data in transit using TLS. On an encrypted Neptune instance, data in the underlying storage is encrypted, as are the automated backups, snapshots, and replicas in the same cluster.

Experiences?

You are placing a great deal of trust in Amazon. Yes?

September 26, 2017

GraphQL News

Filed under: Facebook,GraphQL,Graphs — Patrick Durusau @ 6:45 pm

Relicensing the GraphQL specification

From the post:

Today we’re relicensing the GraphQL specification under the Open Web Foundation Agreement (OWFa) v1.0. We think the OWFa is a great fit for GraphQL because it’s designed for collaborative open standards and supported by other well-known companies. The OWFa allows GraphQL to be implemented under a royalty-free basis, and allows other organizations to contribute to the project on reasonable terms.

Additionally, our reference implementation GraphQL.js and client-side framework Relay will be relicensed under the MIT license, following the React open source ecosystem’s recent change. The GraphQL specification and our open source software around GraphQL have different licenses because the open source projects’ license only covers the specific open source projects while the OWFa is meant to cover implementations of the GraphQL specification.

I want to thank everyone for their patience as we worked to arrive at this change. We hope that GraphQL adopting the Open Web Foundation Agreement, and GraphQL.js and Relay adopting the MIT license, will lead to more companies using and improving GraphQL, and pave the way for GraphQL to become a true standard across the web.

The flurry of relicensing at Facebook is an important lesson for anyone aiming for a web scale standard:

Restrictive licenses don’t scale. (full stop)

Got that?

The recent and sad experience with enabling DRM by the W3C, aka EME, doesn’t prove the contrary. An open API to DRM will come to an unhappy end when content providers realize DRM is a tax on all their income, not just a way to stop pirates.

Think of it this way, would you pay a DRM tax of 1% on your income to prevent theft of 0.01% of your income? If you would, you are going to enjoy EME! Those numbers are, of course, fictional, just like the ones on content piracy. Use them with caution.

September 18, 2017

Game of Thrones, Murder Network Analysis

Filed under: Games,Graphs,Networks,Social Graphs,Social Networks,Visualization — Patrick Durusau @ 1:03 pm

Game of Thrones, Murder Network Analysis by George McIntire.

From the post:

Everybody’s favorite show about bloody power struggles and dragons, Game of Thrones, is back for its seventh season. And since we’re such big GoT fans here, we just had to do a project on analyzing data from the hit HBO show. You might not expect it, but the show is rife with data and has been the subject of various data projects from data scientists, who we all know love to combine their data powers with the hobbies and interests.

Milan Janosov of the Central European University devised a machine learning algorithm to predict the death of certain characters. A handy tool, for any fan tired of being surprised by the shock murders of the show. Dr. Allen Downey, author of the popular ThinkStats textbooks conducted a Bayesian analysis of the characters’ survival rate in the show. Data Scientist and biologist Shirin Glander applied social network analysis tools to analyze and visualize the family and house relationships of the characters.

The project we did is quite similar to that of Glander’s, we’ll be playing around with network analysis, but with data on the murderers and their victims. We constructed a giant network that maps out every murder of character’s with minor, recurring, and major roles.

The data comes courtesy of Ændrew Rininsland of The Financial Times, who’s done a great of collecting, cleaning, and formatting the data. For the purposes of this project, I had to do a whole lot of wrangling and cleaning of my own and in addition to my subjective decisions about which characters to include as well and what constitutes a murder. My finalized dataset produced a total of of 240 murders from 79 killers. For my network graph, the data produced a total of 225 nodes and 173 edges.

I prefer the Game of Thrones (GoT) books over the TV series. The text exercises a reader’s imagination in ways that aren’t matched by visual media.

That said, the TV series murder data set (Ændrew Rininsland of The Financial Times) is a great resource to demonstrate the power of network analysis.

After some searching, it appears that sometime in 2018 is the earliest date for the next volume in the GoT series. Sorry.

August 8, 2017

GraphSON and TinkerPop systems

Filed under: Graphs,TinkerPop — Patrick Durusau @ 4:54 pm

Tips for working with GraphSON and TinkerPop systems by Noah Burrell.

From the post:

If you are working with the Apache TinkerPop™ framework for graph computing, you might want to produce, edit, and save graphs, or parts of graphs, outside the graph database. To accomplish this, you might want a standardized format for a graph representation that is both machine- and human-readable. You might want features for easily moving between that format and the graph database itself. You might want to consider using GraphSON.

GraphSON is a JSON-based representation for graphs. It is especially useful to store graphs that are going to be used with TinkerPop™ systems, because Gremlin (the query language for TinkerPopTM graphs) has a GraphSON Reader/Writer that can be used for bulk upload and download in the Gremlin console. Gremlin also has a Reader/Writer for GraphML (XML-based) and Gryo (Kryo-based).

Unfortunately, I could not find any sort of standardized documentation for GraphSON, so I decided to compile a summary of my research into a single document that would help answer all the questions I had when I started working with it.

Bookmark or better yet, copy-n-paste “Vertex Rules and Conventions” to print on one page and then print “Edge Rules and Conventions” on the other.

Could possibly get both on one page but I like larger font sizes. 😉

Type in the “Example GraphSON Structure” to develop finger knowledge of the format.

Watch for future posts from Noah Burrell. This is useful.

August 2, 2017

It’s more than just overlap: Text As Graph

Filed under: Graphs,Humanities,Hyperedges,Hypergraphs,Texts,XML — Patrick Durusau @ 12:57 pm

It’s more than just overlap: Text As Graph – Refining our notion of what text really is—this time for sure! by Ronald Haentjens Dekker and David J. Birnbaum.

Abstract:

The XML tree paradigm has several well-known limitations for document modeling and processing. Some of these have received a lot of attention (especially overlap), and some have received less (e.g., discontinuity, simultaneity, transposition, white space as crypto-overlap). Many of these have work-arounds, also well known, but—as is implicit in the term “work-around”—these work-arounds have disadvantages. Because they get the job done, however, and because XML has a large user community with diverse levels of technological expertise, it is difficult to overcome inertia and move to a technology that might offer a more comprehensive fit with the full range of document structures with which researchers need to interact both intellectually and programmatically. A high-level analysis of why XML has the limitations it has can enable us to explore how an alternative model of Text as Graph (TAG) might address these types of structures and tasks in a more natural and idiomatic way than is available within an XML paradigm.

Hyperedges, texts and XML, what more could you need? 😉

This paper merits a deep read and testing by everyone interested in serious text modeling.

You can’t read the text but here is a hypergraph visualization of an excerpt from Lewis Carroll’s “The hunting of the Snark:”

The New Testament, the Hebrew Bible, to say nothing of the Rabbinic commentaries on the Hebrew Bible and centuries of commentary on other texts could profit from this approach.

Put your text to the test and share how to advance this technique!

June 30, 2017

Neo4j 3.3.0-alpha02 (Graphs For Schemas?)

Filed under: Cypher,Graphs,Neo4j,Visualization,XML Schema — Patrick Durusau @ 10:19 am

Neo4j 3.3.0-alpha02

A bit late (release was 06/15/2017) but give Neo4j 3.3.0-alpha02 a spin over the weekend.

From the post:


Detailed Changes and Docs

For the complete list of all changes, please see the changelog. Look for 3.3 Developer manual here, and 3.3 Operations manual here.

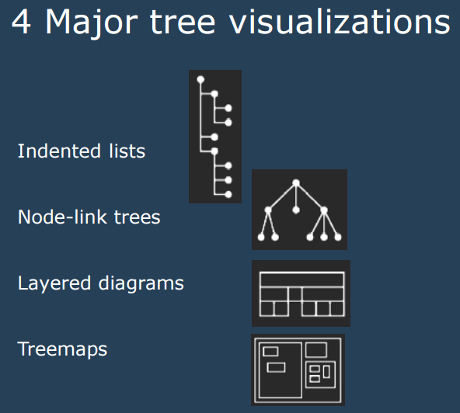
Neo4j is one of the graph engines a friend wants to use for analysis/modeling of the ODF 1.2 schema. The traditional indented list is only one tree visualization out of the four major ones.

(From: Trees & Graphs by Nathalie Henry Riche, Microsoft Research)

Riche’s presentation covers a number of other ways to visualize trees and if you relax the “tree” requirement for display, interesting graph visualizations that may give insight into a schema design.

The slides are part of the materials for CSE512 Data Visualization (Winter 2014), so references for visualizing trees and graphs need to be updated. Check the course resources link for more visualization resources.

May 30, 2017

Trillion-Edge Graphs – Dodging Cost and the NSA

Filed under: Graph Database Benchmark,Graphs — Patrick Durusau @ 7:48 pm

Mosaic: processing a trillion-edge graph on a single machine by Adrian Colyer.

From the post:

Mosaic: Processing a trillion-edge graph on a single machine Maass et al., EuroSys’17

Unless your graph is bigger than Facebook’s, you can process it on a single machine.

With the inception of the internet, large-scale graphs comprising web graphs or social networks have become common. For example, Facebook recently reported their largest social graph comprises 1.4 billion vertices and 1 trillion edges. To process such graphs, they ran a distributed graph processing engine, Giraph, on 200 machines. But, with Mosaic, we are able to process large graphs, even proportional to Facebook’s graph, on a single machine.

In this case it’s quite a special machine – with Intel Xeon Phi coprocessors and NVMe storage. But it’s really not that expensive – the Xeon Phi used in the paper costs around $549, and a 1.2TB Intel SSD 750 costs around $750. How much do large distributed clusters cost in comparison? Especially when using expensive interconnects and large amounts of RAM.

So Mosaic costs less, but it also consistently outperforms other state-of-the-art out of core (secondary storage) engines by 3.2x-58.6x, and shows comparable performance to distributed graph engines. At one trillion edge scale, Mosaic can run an iteration of PageRank in 21 minutes (after paying a fairly hefty one-off set-up cost).

(And remember, if you have a less-than-a-trillion edges scale problem, say just a few billion edges, you can do an awful lot with just a single thread too!).

Another advantage of the single machine design, is a much simpler approach to fault tolerance:

… handling fault tolerance is as simple as checkpointing the intermediate stale data (i.e., vertex array). Further, the read-only vertex array for the current iteration can be written to disk parallel to the graph processing; it only requires a barrier on each superstep. Recovery is also trivial; processing can resume with the last checkpoint of the vertex array.

There’s a lot to this paper. Perhaps the two most central aspects are design sympathy for modern hardware, and the Hilbert-ordered tiling scheme used to divide up the work. So I’m going to concentrate mostly on those in the space available.

A publicly accessible version of the paper: Mosaic: Processing a trillion-edge graph on a single machine. Presentation slides.

Definitely a paper for near the top of my reading list!

Shallow but broad graphs (think telephone surveillance data) are all the rage but how would relatively narrow but deep graphs fare when being processed by Mosaic?

Using top-end but not uncommon hardware may enable your processing requirements to escape the notice of the NSA. Another benefit to commodity hardware.

Enjoy!

May 15, 2017

Network analysis of Game of Thrones family ties [A Timeless Network?]

Filed under: Graphs,Networks,R — Patrick Durusau @ 4:37 pm

Network analysis of Game of Thrones family ties by Shirin Glander.

From the post:

In this post, I am exploring network analysis techniques in a family network of major characters from Game of Thrones.

Not surprisingly, we learn that House Stark (specifically Ned and Sansa) and House Lannister (especially Tyrion) are the most important family connections in Game of Thrones; they also connect many of the storylines and are central parts of the narrative.

The basis for this network is Kaggle’s Game of Throne dataset (character-deaths.csv). Because most family relationships were missing in that dataset, I added the missing information in part by hand (based on A Wiki of Ice and Fire) and by scraping information from the Game of Thrones wiki. You can find the full code for how I generated the network on my Github page.

Glander improves network data for the Game of Thrones and walks you through the use of R to analyze that network.

It’s useful work and will repay close study.

Network analysis can used with all social groups, activists, bankers, hackers, members of Congress (U.S.), terrorists, etc.

But just as Ned Stark has no relationship with dire wolves when the story begins, networks of social groups develop, change, evolve if you will, over time.

Moreover, events, interactions, involving one or more members of the network, occur in time sequence. A social network that fails to capture those events and their sequencing, from one or more points of view, is a highly constrained network.

A useful network as Glander demonstrates but one cannot answer simple questions about the order in which characters gained knowledge that a particular character hurled another character from a very high window.

If I were investigating say a leak of NSA cybertools, time sequencing like that would be one of my top priorities.

Thoughts?

May 9, 2017

Network datasets (@Ognyanova)

Filed under: Graphs,Networks — Patrick Durusau @ 3:24 pm

Network datasets by Katherine Ognyanova.

From the post:

Since I started posting network tutorials on this site, people will occasionally write to ask me about the included example datasets. I also get e-mails from people asking where they might find network data to use for a project or in teaching. Seems like a good idea to post a quick reply here.

The datasets included in my tutorials are mostly synthetic (or trimmed and heavily manipulated) in order to illustrate various visualization aspects in a manageable way. Feel free to use those datasets (citing or linking to the source is appreciated), but keep in mind that they are artificially generated and not the result of actual data collection. When I do use empirical data, the download files include documentation (if the data is collected by me) or clearly point to the source (if the data was collected by someone else).

If you are looking for network data, large or small, there are a number of excellent open online repositories that you can take a look at. Below is a short list (feel free to e-mail me if you have other good links, and I will add them here).

Links to ten (10) collections of network datasets, plus suggestions on software for collecting and analyzing social network data.

Considering following her: @Ognyanova. See her website, http://kateto.net/ for additional resources.

March 13, 2017

AI Brain Scans

Filed under: Artificial Intelligence,Graphs,Neural Networks,Visualization — Patrick Durusau @ 3:19 pm

‘AI brain scans’ reveal what happens inside machine learning


The ResNet architecture is used for building deep neural networks for computer vision and image recognition. The image shown here is the forward (inference) pass of the ResNet 50 layer network used to classify images after being trained using the Graphcore neural network graph library

Credit Graphcore / Matt Fyles

The image is great eye candy, but if you want to see images annotated with information, check out: Inside an AI ‘brain’ – What does machine learning look like? (Graphcore)

From the product overview:

Poplar™ is a scalable graph programming framework targeting Intelligent Processing Unit (IPU) accelerated servers and IPU accelerated server clusters, designed to meet the growing needs of both advanced research teams and commercial deployment in the enterprise. It’s not a new language, it’s a C++ framework which abstracts the graph-based machine learning development process from the underlying graph processing IPU hardware.

Poplar includes a comprehensive, open source set of Poplar graph libraries for machine learning. In essence, this means existing user applications written in standard machine learning frameworks, like Tensorflow and MXNet, will work out of the box on an IPU. It will also be a natural basis for future machine intelligence programming paradigms which extend beyond tensor-centric deep learning. Poplar has a full set of debugging and analysis tools to help tune performance and a C++ and Python interface for application development if required.

The IPU-Appliance for the Cloud is due out in 2017. I have looked at Graphcore but came up dry on the Poplar graph libraries and/or an emulator for the IPU.

Perhaps those will both appear later in 2017.

Optimized hardware for graph calculations sounds promising but rapidly processing nodes that may or may not represent the same subject seems like a defect waiting to make itself known.

Many approaches rapidly process uncertain big data but being no more ignorant than your competition is hardly a selling point.

February 22, 2017

JanusGraph (Linux Foundation Graph Player Rides Into Town)

Filed under: Graph Databases,Graphs,JanusGraph,TinkerPop,Titan — Patrick Durusau @ 5:35 pm

JanusGraph

From the homepage:

JanusGraph is a scalable graph database optimized for storing and querying graphs containing hundreds of billions of vertices and edges distributed across a multi-machine cluster.
JanusGraph is a transactional database that can support thousands of concurrent users executing complex graph traversals in real time.

In addition, JanusGraph provides the following features:

You can clone JanusGraph from GitHub.
Read the JanusGraph documentation and join the users or developers mailing lists.

Follow the Getting Started with JanusGraph guide for a step-by-step introduction.

Supported by Google, IBM and Hortonworks, among others.

Three good reasons to pay attention to JanusGraph early and often.

Enjoy!

October 30, 2016

Clinton/Podesta Emails – Towards A More Complete Graph (Part 3) New Dump!

Filed under: Data Mining,Graphs,Hillary Clinton,Politics — Patrick Durusau @ 8:07 pm

As you may recall from Clinton/Podesta Emails – Towards A More Complete Graph (Part 2), I didn’t check to see if “|” was in use as a separator in the extracted emails subject lines so when I tried to create node lists based on “|” as a separator, it failed.

That happens. More than many people are willing to admit.

In the meantime, a new dump of emails has arrived so I created the new DKIM-incomplete-podesta-1-22.txt.gz file. Which mean picking a new separator to use for the resulting file.

Advice: Check your proposed separator against the data file before using it. I forgot, you shouldn’t.

My new separator? |/|

Which I checked against the file to make sure there would be no conflicts.

The sed commands to remove < and > are the same as in Part 2.

Sigh, back to failure land, again.

Just as one sample:

awk 'FS="|/|" { print $7}' test.me

where test.me is:

9991 00013434.eml|/|False|/|2015-11-21 17:15:25-05:00|/|Eryn Sepp eryn.sepp@gmail.com|/|John Podesta john.podesta@gmail.com|/|Re: Nov 30 / Future Plans / Etc.!|/|8A6B3E93-DB21-4C0A-A548-DB343BD13A8C@gmail.com

returns:

Future Plans

I also checked that with gawk and nawk, with the same result.

For some unknown (to me) reason, all three are treating the first “/” in field 6 (by my count) as a separator, along with the second “/” in that field.

To test that theory, what do you think { print $8 } will return?

You’re right!

Etc.!|

So with the “|/|” separator, I’m going to have up to at least 9 fields, perhaps more, varying depending on whether “/” characters occur in the subject line.

🙁

That’s not going to work.

OK, so I toss the 10+ MB DKIM-complete-podesta-1-22.txt.gz into Emacs, whose regex treatment I trust, and change “|/|” to “@@@@@” and save that file as DKIM-complete-podesta-1-22-03.txt.

Another sanity check, which got us into all this trouble last time:

awk 'FS="@@@@@" { print $7}' podesta-1-22-03.txt | grep @ | wc -l

returns 36504, which plus the 16 files I culled as failures, equals 36520, the number of files in the Podesta 1-22 release.

Recall that all message-ids contain an @ sign to the correct answer on the number of files gives us confidence the file is ready for further processing.

Apologies for it taking this much prose to go so little a distance.

Our fields (numbered for reference) are:

ID – 1| Verified – 2| Date – 3| From – 4| To – 5| Subject -6| Message-Id – 7

Our first node for the node list (Clinton/Podesta Emails – Towards A More Complete Graph (Part 1)) was to capture the emails themselves.

Using Message-Id (field 7) as the identifier and Subject (field 6) as its label.

We are about to encounter another problem but let’s walk through it.

An example of what we are expecting:

CAC9z1zL9vdT+9FN7ea96r+Jjf2=gy1+821u_g6VsVjr8U2eLEg
@mail.gmail.com;”Knox Knotes”;
CAKM1B-9+LQBXr7dgE0pKke7YhQC2dZ2akkgmSbRFGHUx-0NNPg
@mail.gmail.com;”Re: Tomorrow”;

We have the Message-Id with a closing “;”, followed by the Subject, surrounded in double quote marks and also terminated by a “;”.

FYI: Mixing single and double quotes in awk is a real pain. I struggled with it but then was reminded I can declare variables:

-v dq='"'

which allows me to do this:

awk -v dq='"' 'FS="@@@@@" { print $7 ";" dq $6 dq ";"}' podesta-1-22-03.txt

The awk variable trick will save you considerable puzzling over escape sequences and the like.

Ah, now we are to the problem I mentioned above.

In the part 1 post I mentioned that while:

CAC9z1zL9vdT+9FN7ea96r+Jjf2=gy1+821u_g6VsVjr8U2eLEg
@mail.gmail.com;”Knox Knotes”;
CAKM1B-9+LQBXr7dgE0pKke7YhQC2dZ2akkgmSbRFGHUx-0NNPg@mail.gmail.com;”Re: Tomorrow”;

works,

but having:

CAC9z1zL9vdT+9FN7ea96r+Jjf2=gy1+821u_g6VsVjr8U2eLEg
@mail.gmail.com;”Knox Knotes”;https://wikileaks.org/podesta-emails/emailid/9998;
CAKM1B-9+LQBXr7dgE0pKke7YhQC2dZ2akkgmSbRFGHUx-0NNPg@mail.gmail.com;”Re: Tomorrow”;https://wikileaks.org/podesta-emails/emailid/9999;

with Wikileaks links is more convenient for readers.

As you may recall, the last two lines read:

9998 00022160.eml@@@@@False@@@@@2015-06-23 23:01:55-05:00@@@@@Jerome Tatar jerry@TatarLawFirm.com@@@@@Jerome Tatar Jerome jerry@tatarlawfirm.com@@@@@Knox Knotes@@@@@CAC9z1zL9vdT+9FN7ea96r
+Jjf2=gy1+821u_g6VsVjr8U2eLEg@mail.gmail.com
9999 00013746.eml@@@@@False@@@@@2015-04-03 01:14:56-04:00@@@@@Eryn Sepp eryn.sepp@gmail.com@@@@@John Podesta john.podesta@gmail.com@@@@@Re: Tomorrow@@@@@CAKM1B-9+LQBXr7dgE0pKke7YhQC2dZ2akkgmSbRFGHUx-0NNPg@mail.gmail.com

Which means in addition to printing Message-Id and Subject as fields one and two, we need to split ID on the space and use the result to create the URL back to Wikileaks.

It’s late so I am going to leave you with DKIM-incomplete-podesta-1-22.txt.gz. This is complete save for 16 files that failed to parse. Will repost tomorrow with those included.

I have the first node file script working and that will form the basis for the creation of the edge lists.

PS: Look forward to running awk files tomorrow. It makes a number of things easier.

October 28, 2016

Clinton/Podesta Emails – Towards A More Complete Graph (Part 2)

Filed under: Data Mining,Gephi,Graphs,Hillary Clinton — Patrick Durusau @ 7:46 pm

I assume you are starting with DKIM-complete-podesta-1-18.txt.gz.

If you are starting with another source, you will need different instructions. 😉

First, remember from Clinton/Podesta Emails – Towards A More Complete Graph (Part 1) that I wanted to delete all the < and > signs from the text.

That’s easy enough (uncompress the text first):

sed 's/<//g' DKIM-complete-podesta-1-18.txt > DKIM-complete-podesta-1-18-01.txt

followed by:

sed 's/>//g' DKIM-complete-podesta-1-18-01.txt > DKIM-complete-podesta-1-18-02.txt

Here’s where we started:

001 00032251.eml|False|2010-10-06 18:29:52-04:00|Joshua Dorner <jdorner@americanprogress.org>|”‘bigcampaign@googlegroups.com'” <bigcampaign@googlegroups.com>|[big campaign] Follow-up Materials from Background Briefing on the Chamber’s Foreign Funding, fyi|<A28459BA2B4D5D49BED0238513058A7F012ADC1EF58F @CAPMAILBOX.americanprogresscenter.org>
002 00032146.eml|True|2015-04-14 18:19:46-04:00|Josh Schwerin <jschwerin@hillaryclinton.com>|hrcrapid <HRCrapid@googlegroups.com>|=?UTF-8?Q?NYT=3A_Hillary_Clinton=E2=80=99s_Chipotle_Order=3A_Above_Avera?= =?UTF-8?Q?ge?=|<CAPrY+5KJ=NG+Vs-khDVpe-L=bP5=qvPcZTS5FDam5LixueQsKA@mail.gmail.com>

Here’s the result after the first two sed scripts:

001 00032251.eml|False|2010-10-06 18:29:52-04:00|Joshua Dorner jdorner@americanprogress.org|”‘bigcampaign@googlegroups.com'” bigcampaign@googlegroups.com|[big campaign] Follow-up Materials from Background Briefing on the Chamber’s Foreign Funding, fyi|
A28459BA2B4D5D49BED0238513058A7F012ADC1EF58F
@CAPMAILBOX.americanprogresscenter.org
002 00032146.eml|True|2015-04-14 18:19:46-04:00|Josh Schwerin jschwerin@hillaryclinton.com|hrcrapid HRCrapid@googlegroups.com|=?UTF-8?Q?NYT=3A_Hillary_Clinton=E2=80=99s_Chipotle_Order=3A_Above_Avera?= =?UTF-8?Q?ge?=|CAPrY+5KJ=NG+Vs-khDVpe-L=bP5=qvPcZTS5FDam5LixueQsKA@mail.gmail.com

BTW, I increment the numbers of my result files, DKIM-complete-podesta-1-18-01.txt, DKIM-complete-podesta-1-18-02.txt, because when I don’t, I run different sed commands on the same original file, expecting a cumulative result.

That’s spelled – disappointment and wasted effort looking for problems that aren’t problems. Number your result files.

The nodes and edges mentioned in Clinton/Podesta Emails – Towards A More Complete Graph (Part 1):

Nodes

  • Emails, message-id is ID and subject is label, make Wikileaks id into link
  • From/To, email addresses are ID and name is label
  • True/False, true/false as ID, True/False as labels
  • Date, truncated to 2015-07-24 (example), date as id and label

Edges

  • To/From – Edges with message-id (source) email-address (target) to/from (label)
  • Verify – Edges with message-id (source) true/false (target) verify (label)
  • Date – Edges with message-id (source) – date (target) date (label)

Am I missing anything? The longer I look at problems like this the more likely my thinking/modeling will change.

What follows is very crude, command line creation of the node and edge files. Something more elaborate could be scripted/written in any number of languages.

Our fields (numbered for reference) are:

ID – 1| Verified – 2| Date – 3| From – 4| To – 5| Subject -6| Message-Id – 7

You don’t have to take my word for it, try this:

awk 'FS="|" { print $7}' DKIM-complete-podesta-1-18-02.txt

The output prints to the console. Those all look like message-ids to me, well, with the exception of the one that reads ” 24 September.”

How much dirty data do you think is in the message-id field?

A crude starting assumption is that any message-id field without the “@” character is dirty.

Let’s try:

awk ‘FS = “|” { print $7} DKIM-complete-podesta-1-18-02.txt | grep -v @ | wc -l

Which means we are going to extract the 7th field, search (grep) over those results for the “@” sign, where the -v switch means only print lines that DO NOT match, and we will count those lines with wc -l.

Ready? Press return.

I get 594 “dirty” message-ids.

Here is a sampling:


Rolling Stone
TheHill
MSNBC, Jeff Weaver interview on Sanders health care plan and his Wall St. ad
Texas Tribune
20160120 Burlington, IA Organizing Event
start spreadin’ the news…..
Building Trades Union (Keystone XL)
Rubio Hits HRC On Cuba, Russia
2.19.2016
Sourcing Story
Drivers Licenses
Day 1
H1N1 Flu Shot Available

Those look an awful lot like subject lines to me. You?

I suspect those subject lines had the separator character “|” in those lines, before we extracted the data from the .eml files.

I’ve tried to repair the existing files but the cleaner solution is to return to the extraction script and the original email files.

More on that tomorrow!

Clinton/Podesta Emails – Towards A More Complete Graph (Part 1)

Filed under: Data Mining,Gephi,Graphs,Hillary Clinton — Patrick Durusau @ 11:48 am

Gephi is a great tool, but it’s only as good as its input.

The Gephi 8.2 email importer (missing in Gephi 9.*) is lossy, informationally speaking, as I have mentioned before.

Here’s a sample from the verification results on podesta-release-1-18:

9981 00045326.eml|False|2015-07-24 12:58:16-04:00|Oren Shur |John Podesta , Robby Mook , Joel Benenson , “Margolis, Jim” , Mandy Grunwald , David Binder , Teddy Goff , Jennifer Palmieri , Kristina Schake , Christina Reynolds , Katie Connolly , “Kaye, Anson” , Peter Brodnitz , “Rimel, John” , David Dixon , Rich Davis , Marlon Marshall , Michael Halle , Matt Paul , Elan Kriegel , Jake Sullivan |FW: July IA Poll Results|<168005c7ccb3cbcc0beb3ffaa08a8767@mail.gmail.com>

The Gephi 8.2 mail importer fails to create a node representing an email message.

I propose we cure that failure by taking the last field, here:

168005c7ccb3cbcc0beb3ffaa08a8767@mail.gmail.com

and the next to last field:

FW: July IA Poll Results

and putting them as id and label, respectively in a node list:

168005c7ccb3cbcc0beb3ffaa08a8767@mail.gmail.com; “FW: July IA Poll Results”;

As part of the transformation, we need to remove the < and > signs around the message ID, then add a ; to mark the end of the ID field and put double quote ” “ around the subject to use it as a label. Then close the second field with another ;.

While we are talking about nodes, all the email addresses change from:

Oren Shur

to:

oshur@hillaryclinton.com; “Oren Shur”;

which are ID and label of the node list, respectively.

I could remove the < and > characters as part of the extraction script but will use sed at the command line instead.

Reminder: Always work on a copy of your data, never the original.

Then we need to create an edge list, one that represents the relationships between the email (as node) to the sender and receivers of the email (also nodes). For this first iteration, I’m going to use labels on the edges to distinguish between senders and receivers.

Assuming my first row of the edges file reads:

Source; Target; Role (I did not use “Type” because I suspect that is a controlled term for Gephi.)

Then the first few edges would read:

168005c7ccb3cbcc0beb3ffaa08a8767@mail.gmail.com; oshur@hillaryclinton.com>; from;
168005c7ccb3cbcc0beb3ffaa08a8767@mail.gmail.com; john.podesta@gmail.com>; to;
168005c7ccb3cbcc0beb3ffaa08a8767@mail.gmail.com; re47@hillaryclinton.com; to;
168005c7ccb3cbcc0beb3ffaa08a8767@mail.gmail.com; jbenenson@bsgco.com; to;
168005c7ccb3cbcc0beb3ffaa08a8767@mail.gmail.com; Jim.Margolis@gmmb.com; to;
….

As you can see, this is going to be a “busy” graph! 😉

Filtering is going to play an important role in exploring this graph, so let’s add nodes that will help with that process.

I propose we add to the node list:

true; True
false; False

as id and labels.

Which means for the edge list we can have:

168005c7ccb3cbcc0beb3ffaa08a8767@mail.gmail.com; true; verify;

Do you have an opinion on the order, source/target for true/false?

Thinking this will enable us to filter nodes that have not been verified or to include only those that have failed verification.

For experimental purposes, I think we need to rework the date field:

2015-07-24 12:58:16-04:00

I would truncate that to:

2015-07-24

and add such truncated dates to the node list:

2015-07-24; 2015-07-24;

as ID and label, respectively.

Then for the edge list:

168005c7ccb3cbcc0beb3ffaa08a8767@mail.gmail.com; 2015-07-24; date;

Reasoning that we can filter to include/exclude nodes based on dates, which if you add enough email boxes, could help visualize the reaction to and propagation of emails.

Even assuming named participants in these emails have “deleted” their inboxes, there are always automatic backups. It’s just a question of persistence before the rest of this network can be fleshed out.

Oh, one last thing. You have probably notice the Wikileaks “ID” that forms part of the filename?

9981 00045326.eml

The first part forms the end of a URL to link to the original post at Wikileaks.

Thus, in this example, 9981 becomes:

https://wikileaks.org/podesta-emails/emailid/9981

The general form being:

https://wikileaks.org/podesta-emails/emailid/(Wikileaks-ID)

For the convenience of readers/users, I want to modify my earlier proposal for the email node list entry from:

168005c7ccb3cbcc0beb3ffaa08a8767@mail.gmail.com; “FW: July IA Poll Results”;

to:

168005c7ccb3cbcc0beb3ffaa08a8767@mail.gmail.com; “FW: July IA Poll Results”; https://wikileaks.org/podesta-emails/emailid/9981;

Where the third field is “link.”

I am eliding over lots of relationships and subjects but I’m not reluctant to throw it all away and start over.

Your investment in a model isn’t lost by tossing the model, you learn something with every model you build.

Scripting underway, a post on that experience and the node/edge lists to follow later today.

October 27, 2016

Podesta/Clinton Emails: Filtering by Email Address (Pimping Bill Clinton)

Filed under: Data Mining,Gephi,Graphs,Hillary Clinton — Patrick Durusau @ 8:54 pm

The Bill Clinton, Inc. story reminds me of:

Although I steadfastly resist imaging either Bill or Hillary in that video. Just won’t go there!

Where a graph display can make a difference is that instead of just the one email/memo from Bill’s pimp, we can rapidly survey all of the emails in which he appears, in any role.

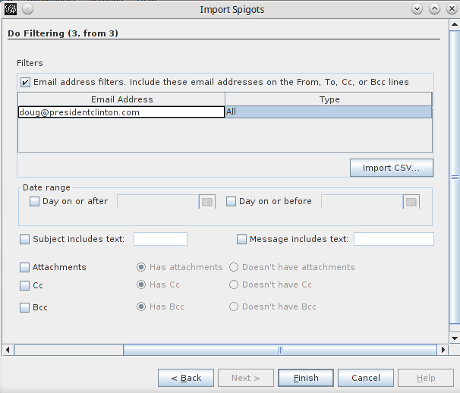
import-spigot-email-filter-460

I ran that on Gephi 8.2 against podesta-release-1-18 but the results were:

Nodes 0, Edges 0.

Hmmm, there is something missing, possibly the CSV file?

I checked and podesta-release-1-18 has 393 emails where doug@presidentclinton.com appears.

Could try to find the “right” way to filter on email addresses but for now, let’s take a dirty short-cut.

I created a directory to hold all emails with doug@presidentclinton.com and ran into all manner of difficulties because the file names are plagued with spaces!

So much so that I unintentionally (read “by mistake”) saved all the doug@presidentclinton.com posts from podesta-release-1-18 to a different folder than the ones from podesta-release-19.

🙁

Well, but there is a happy outcome and an illustration of yet another Gephi capability.

I build the first graph from the doug@presidentclinton.com posts from podesta-release-1-18 and then with that graph open, imported the doug@presidentclinton.com from podesta-release-19 and appended those results to the open graph.

How cool is that!

Imagine doing that across data sets, assuming you paid close attention to identifiers, etc.

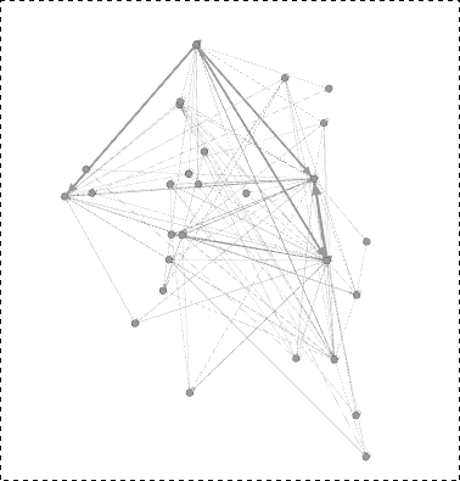
Sorry, back to the graphs, here is the random layout once the graphs were combined:

doug-default-460

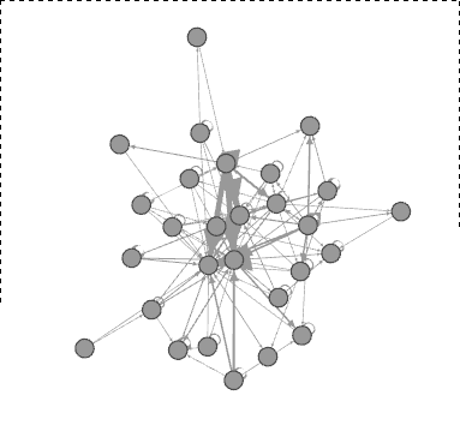
Applying the Yifan Hu network layout:

doug-network-yifan-hu-460

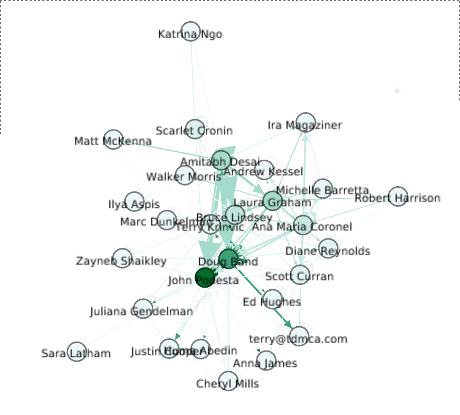
I ran network statistics on network diameter and applied colors based on betweenness:

doug-network-centrality-460

And finally, adjusted the font and turned on the labels:

doub-network-labels-460

I have spent a fair amount of time just moving stuff about but imagine if you could interactively explore the emails, creating and trashing networks based on to:, from:, cc:, dates, content, etc.

The limits of Gephi imports were a major source of pain today.

I’m dodging those tomorrow in favor of creating node and adjacency tables with scripts.

PS: Don’t John Podesta and Doug Band look like two pimps in a pod? 😉

PPS: If you haven’t read the pimping Bill Clinton memo. (I think it has some other official title.)

October 26, 2016

No Frills Gephi (8.2) Import of Clinton/Podesta Emails (1-18)

Filed under: Gephi,Graphs,Hillary Clinton,Neo4j,Networks,Politics,Visualization — Patrick Durusau @ 7:19 pm

Using Gephi 8.2, you can create graphs of the Clinton/Podesta emails based on terms in subject lines or the body of the emails. You can interactively work with all 30K+ (as of today) emails and extract networks based on terms in the posts. No programming required. (Networks based on terms will appear tomorrow.)

If you have Gephi 8.2 (I can’t find the import spigot in 9.0 or 9.1), you can import the Clinton/Podesta Emails (1-18) for analysis as a network.

To save you the trouble of regressing to Gephi 8.2, I performed a no frills/default import and exported that file as podesta-1-18-network.gephi.gz.

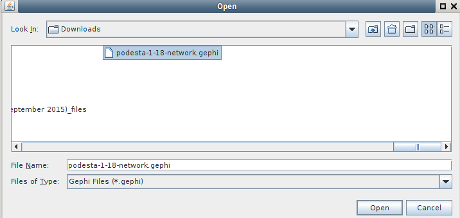
Download and uncompress podesta-1-18-network.gephi.gz, then you can pickup at timemark 3.49.

Open the file (your location may differ):

gephi-podesta-open-460

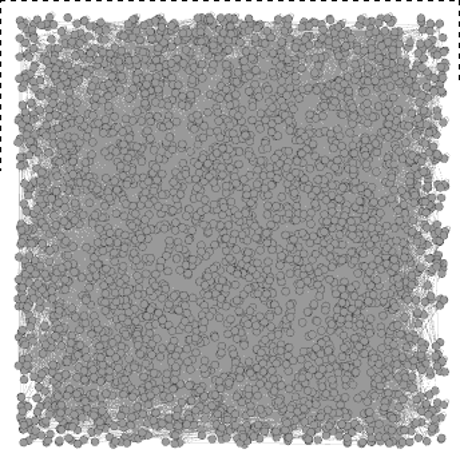
Obligatory hair-ball graph visualization. 😉

gephi-first-look-460

Considerably less appealing that Jennifer Golbeck’s but be patient!

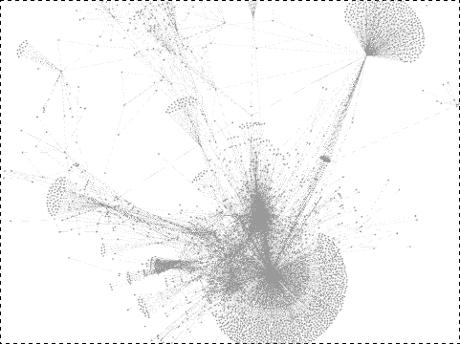
First step, Layout -> Yifan Hu. My results:

yifan-hu-first-460

Second step, Network Diameter statistics (right side, run).

No visible impact on the graph but, now you can change the color and size of nodes in the graph. That is they have attributes on which you can base the assignment of color and size.

Tutorial gotcha: Not one of Jennifer’s tutorials but I was watching a Gephi tutorial that skipped the part about running statistics on the graph prior to assignment of color and size. Or I just didn’t hear it. The menu options appear in documentation but you can’t access them unless and until you run network statistics or have attributes for the assignment of color and size. Run statistics first!

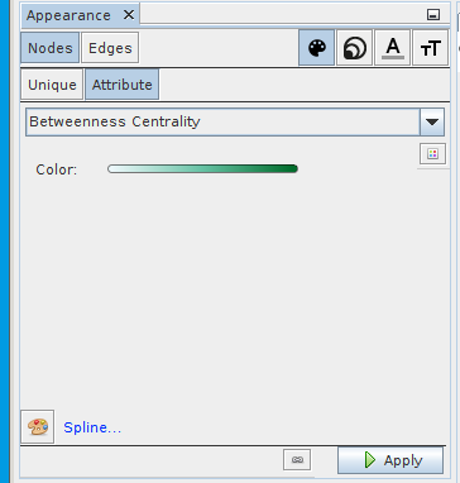
Next, assign colors based on betweenness centrality:

gephi-betweenness-460

The densest node is John Podesta, but if you remove his node, rerun the network statistics and re-layout the graph, here is part of what results:

delete-central-node-460

A no frills import of 31,819 emails results in a graph of 3235 nodes and 11,831 edges.

That’s because nodes and edges combine (merge to you topic map readers) when they have the same identifier or for edges are between the same nodes.

Subject to correction, when that combining/merging occurs, the properties on the respective nodes/edges are accumulated.

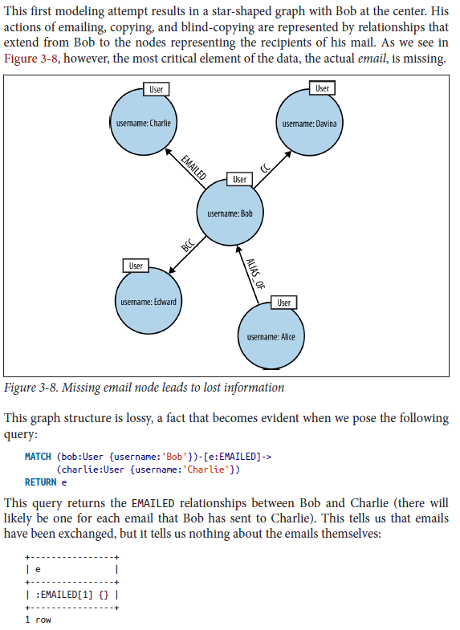
Topic mappers already realize there are important subjects missing, some 31,819 of them. That is the emails themselves don’t by default appear as nodes in the network.

Ian Robinson, Jim Webber & Emil Eifrem illustrate this lossy modeling in Graph Databases this way:

graph-databases-lossy-460

Modeling emails without the emails is rather lossy. 😉

Other nodes/subjects we might want:

  • Multiple to: emails – Is who was also addressed important?
  • Multiple cc: emails – Same question as with to:.
  • Date sent as properties? So evolution of network/emails can be modeled.
  • Capture “reply-to” for relationships between emails?

Other modeling concerns?

Bear in mind that we can suppress a large amount of the detail so you can interactively explore the graph and only zoom into/display data after finding interesting patterns.

Some helpful links:

https://archive.org/details/PodestaEmailszipped: The email collection as bulk download, thanks to Michael Best, @NatSecGeek.

https://github.com/gephi/gephi/releases: Where you can grab a copy of Gephi 8.2.

August 26, 2016

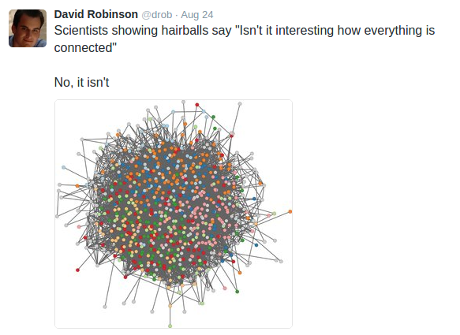
Hair Ball Graphs

Filed under: Cybersecurity,Graphs,Visualization — Patrick Durusau @ 1:32 pm

An example of a non-useful “hair ball” graph visualization:

hairball-01-460

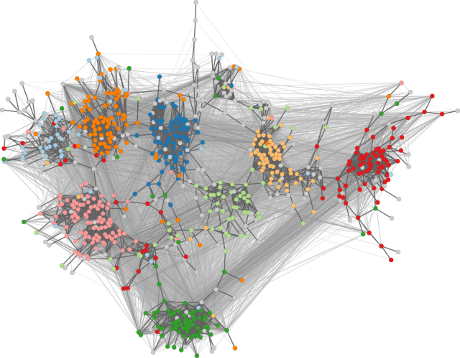
That image is labeled as “standard layout” at a site that offers this cohesion adapted layout alternative:

hairball-alternative-B02b-460

The full-size image is quite impressive.

If you were attempting to visualize vulnerabilities, which one would you pick?

August 14, 2016

Simit: A Language for Physical Simulation

Filed under: Graphs,Hypergraphs,Simulations — Patrick Durusau @ 9:28 pm

Simit: A Language for Physical Simulation by Fredrik Kjolstad, et al.

Abstract:

With existing programming tools, writing high-performance simulation code is labor intensive and requires sacrificing readability and portability. The alternative is to prototype simulations in a high-level language like Matlab, thereby sacrificing performance. The Matlab programming model naturally describes the behavior of an entire physical system using the language of linear algebra. However, simulations also manipulate individual geometric elements, which are best represented using linked data structures like meshes. Translating between the linked data structures and linear algebra comes at significant cost, both to the programmer and to the machine. High-performance implementations avoid the cost by rephrasing the computation in terms of linked or index data structures, leaving the code complicated and monolithic, often increasing its size by an order of magnitude.

In this article, we present Simit, a new language for physical simulations that lets the programmer view the system both as a linked data structure in the form of a hypergraph and as a set of global vectors, matrices, and tensors depending on what is convenient at any given time. Simit provides a novel assembly construct that makes it conceptually easy and computationally efficient to move between the two abstractions. Using the information provided by the assembly construct, the compiler generates efficient in-place computation on the graph. We demonstrate that Simit is easy to use: a Simit program is typically shorter than a Matlab program; that it is high performance: a Simit program running sequentially on a CPU performs comparably to hand-optimized simulations; and that it is portable: Simit programs can be compiled for GPUs with no change to the program, delivering 4 to 20× speedups over our optimized CPU code.

Very deep sledding ahead but consider the contributions:


Simit is the first system that allows the development of physics code that is simultaneously:

Concise. The Simit language has Matlab-like syntax that lets algorithms be implemented in a compact, readable form that closely mirrors their mathematical expression. In addition, Simit matrices assembled from hypergraphs are indexed by hypergraph elements like vertices and edges rather than by raw integers, significantly simplifying indexing code and eliminating bugs.

Expressive. The Simit language consists of linear algebra operations augmented with control flow that let developers implement a wide range of algorithms ranging from finite elements for deformable bodies to cloth simulations and more. Moreover, the powerful hypergraph abstraction allows easy specification of complex geometric data structures.

Fast. The Simit compiler produces high-performance executable code comparable to that of hand-optimized end-to-end libraries and tools, as validated against the state-of-the-art SOFA [Faure et al. 2007] and Vega [Sin et al. 2013] real-time simulation frameworks. Simulations can now be written as easily as a traditional prototype and yet run as fast as a high-performance implementation without manual optimization.

Performance Portable. A Simit program can be compiled to both CPUs and GPUs with no additional programmer effort, while generating efficient code for each architecture. Where Simit delivers performance comparable to hand-optimized CPU code on the same processor, the same simple Simit program delivers roughly an order of magnitude higher performance on a modern GPU in our benchmarks, with no changes to the program.

Interoperable. Simit hypergraphs and program execution are exposed as C++ APIs, so developers can seamlessly integrate with existing C++ programs, algorithms, and libraries.
(emphasis in original)

Additional resources:

http://simit-lang.org/

Getting Started

Simit mailing list

Source code (MIT license)

Enjoy!

August 5, 2016

Node XL (641 Pins)

Filed under: Graphs,NodeXL,Visualization — Patrick Durusau @ 8:17 pm

Node XL

Just a quick sample:

node-xl-pins-460

That’s only a sample, another 629 await your viewing (perhaps more by the time you read this post).

I have a Pineterest account but this is the first set of pins I have chosen to follow.

Suggestions of similar visualization boards at Pinterest?

Enjoy!

August 3, 2016

OnionRunner, ElasticSearch & Maltego

Filed under: ElasticSearch,Graphs,OnionRunner,Tor,Visualization — Patrick Durusau @ 2:21 pm

OnionRunner, ElasticSearch & Maltego by Adam Maxwell.

From the post:

Last week Justin Seitz over at automatingosint.com released OnionRunner which is basically a python wrapper (because Python is awesome) for the OnionScan tool (https://github.com/s-rah/onionscan).

At the bottom of Justin’s blog post he wrote this:

For bonus points you can also push those JSON files into Elasticsearch (or modify onionrunner.py to do so on the fly) and analyze the results using Kibana!

Always being up for a challenge I’ve done just that. The onionrunner.py script outputs each scan result as a json file, you have two options for loading this into ElasticSearch. You can either load your results after you’ve run a scan or you can load them into ElasticSearch as a scan runs. Now this might sound scary but it’s not, lets tackle each option separately.

A great enhancement to Justin’s original OnionRunner!

You will need a version of Maltego to perform the visualization as described. Not a bad idea to become familiar with Maltego in general.

Data is just data, until it is analyzed.

Enjoy!

June 17, 2016

Visualizing your Titan graph database:…

Filed under: Graphs,Gremlin,TinkerPop,Titan,Visualization — Patrick Durusau @ 8:42 am

Visualizing your Titan graph database: An update by Marco Liberati.

From the post:

Last summer, we wrote a blog with our five simple steps to visualizing your Titan graph database with KeyLines. Since then TinkerPop has emerged from the Apache Incubator program with TinkerPop3, and the Titan team have released v1.0 of their graph database:

  • TinkerPop3 is the latest major reincarnation of the graph proje­­­ct, pulling together the multiple ventures into a single united ecosystem.
  • Titan 1.0 is the first stable release of the Titan graph database, based on the TinkerPop3 stack.

We thought it was about time we updated our five-step process, so here’s:

Not exactly five (5) steps because you have to acquire a KeyLines trial key, etc.

A great endorsement of much improved installation process for TinkerPop3 and Titan 1.0.

Enjoy!

May 23, 2016

Incubate No Longer! Tinkerpop™!

Filed under: Graphs,TinkerPop — Patrick Durusau @ 3:38 pm

The Apache Software Foundation Announces Apache® TinkerPop™ as a Top-Level Project

From the post:

The Apache Software Foundation (ASF), the all-volunteer developers, stewards, and incubators of more than 350 Open Source projects and initiatives, announced today that Apache® TinkerPop™ has graduated from the Apache Incubator to become a Top-Level Project (TLP), signifying that the project’s community and products have been well-governed under the ASF’s meritocratic process and principles.

Apache TinkerPop is a graph computing framework that provides developers the tools required to build modern graph applications in any application domain and at any scale.

“Graph databases and mainstream interest in graph applications have seen tremendous growth in recent years,” said Stephen Mallette, Vice President of Apache TinkerPop. “Since its inception in 2009, TinkerPop has been helping to promote that growth with its Open Source graph technology stack. We are excited to now do this same work as a top-level project within the Apache Software Foundation.”

As a graph computing framework for both real-time, transactional graph databases (OLTP) and and batch analytic graph processors (OLAP), TinkerPop is useful for working with small graphs that fit within the confines of a single machine, as well as massive graphs that can only exist partitioned and distributed across a multi-machine compute cluster.

TinkerPop unifies these highly varied graph system models, giving developers less to learn, faster time to development, and less risk associated with both scaling their system and avoiding vendor lock-in.

In addition to that good news, the announcement also answers the inevitable question about scaling:


Apache TinkerPop is in use at organizations such as DataStax and IBM, among many others. Amazon.com is currently using TinkerPop and Gremlin to process its order fullfillment graph which contains approximately one trillion edges. (emphasis added)

A trillion edges, unless you are a stealth Amazon, Tinkerpop™ will scale for you.

Congratulations to the Tinkerpop™ community!

May 11, 2016

MOOGI – The Film Discovery Engine

Filed under: Graphs,Mind Maps,TinkerPop — Patrick Durusau @ 3:14 pm

MOOGI – The Film Discovery Engine

Not the most recent movie I have seen but under genre I entered:

movies about B.C.

Thinking that it would return (rather quickly):

One Million Years B.C. (1966)

Possibly just load on this alpha site but after a couple of minutes, I just reloaded the homepage.

Using “keyword,” just typing “B.C.” brought up a pick list where One Million Years B.C. (1966) was eight in the list. Without any visible delay.

The keyword categories are interesting and many.

Learned a new word, canuxploitation! There is an entire site devoted to Canadian B-movies, i.e., Canuxploitation! – Your Complete Guide to Canadian B-Film.

You will recognize most of the other keywords.

If not, check the New York Times or the Washington Post and include the term plus “member of congress.” You will get several stories that will flesh out the meaning of “erotic,” “female nudity,” “drugs,” “prostitution,” “monster,” “hotel,” “adultery” and the like.

If search isn’t your strong point, try the “explore” option. You can search for movies “similar to” some named movie.

Just for grins, I typed in:

The Dirty Dozen. When I saw it during its first release, it had been given a “condemned” rating by Catholic movie rating service. Had no redeeming qualities at all. No one should see it.

I miss those lists because they were great guides to what movies to go see! 😉

One of five (5) results was The Dirty Dozen: The Deadly Mission (1987).

When I chose that movie, the system failed so I closed out the window and tried again. Previous quick response is taking a good bit of time, suspect load/alpha quality. (I will revisit fairly soon and update this report.)

In terms of aesthetics, they really should lose the hand in the background moving around with a remote control. Adds nothing to the experience other than annoyance.

The site is powered by Mindmaps. Which means you are going to find Apache Tinkerpop under the hood.

Enjoy!

May 10, 2016

Panama Papers Import Scripts for Neo4j and Docker

Filed under: Graphs,Neo4j,Panama Papers — Patrick Durusau @ 3:35 pm

Panama Papers Import Scripts for Neo4j and Docker by Michael Hunger.

Michael’s import scripts enable you too to explore and visualize, a sub-set of the Panama Papers data.

Thanks Michael!

Older Posts »

Powered by WordPress