Another Word For It Patrick Durusau on Topic Maps and Semantic Diversity

July 28, 2016

What That Election Probability Means
[500 Simulated Clinton-Trump Elections]

Filed under: Politics,Probability,Simulations,Visualization — Patrick Durusau @ 2:05 pm

What That Election Probability Means by Nathan Yau.

From the post:

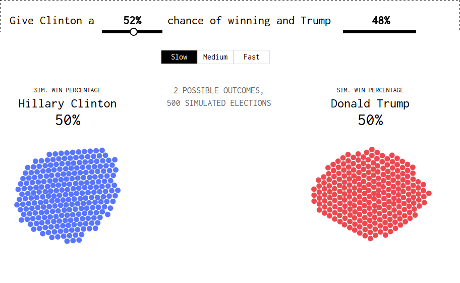
We now have our presidential candidates, and for the next few months you get to hear about the changing probability of Hillary Clinton and Donald Trump winning the election. As of this writing, the Upshot estimates a 68% probability for Clinton and 32% for Donald Trump. FiveThirtyEight estimates 52% and 48% for Clinton and Trump, respectively. Forecasts are kind of all over the place this far out from November. Plus, the numbers aren’t especially accurate post-convention.

But the probabilities will start to converge and grow more significant.

So what does it mean when Clinton has a 68% chance of becoming president? What if there were a 90% chance that Trump wins?

Some interpret a high percentage as a landslide, which often isn’t the case with these election forecasts, and it certainly doesn’t mean the candidate with a low chance will lose. If this were the case, the Cleveland Cavaliers would not have beaten the Golden State Warriors, and I would not be sitting here hating basketball.

Fiddle with the probabilities in the graphic below to see what I mean.

As always, visualizations from Nathan are a joy to view and valuable in practice.

You need to run it several times but here’s the result I got with “FiveThirtyEight estimates 52% and 48% for Clinton and Trump, respectively.”

yau-simulation-460

You have to wonder what a similar simulation for breach/no-breach would look like for your enterprise?

Would that be an effective marketing tool for cybersecurity?

Perhaps not if you are putting insecure code on top of insecure code but there are other solutions.

For example, having state legislatures prohibit the operation of escape from liability clauses in EULAs.

Assuming someone who has read one in sufficient detail to draft legislation. 😉

That could be an interesting data project. Anyone have a pointer to a collection of EULAs?

December 12, 2015

Estimating “known unknowns”

Filed under: Data Science,Mathematics,Probability,Proofing,Statistics — Patrick Durusau @ 4:36 pm

Estimating “known unknowns” by Nick Berry.

From the post:

There’s a famous quote from former Secretary of Defense Donald Rumsfeld:

“ … there are known knowns; there are things we know we know. We also know there are known unknowns; that is to say we know there are some things we do not know. But there are also unknown unknowns – the ones we don’t know we don’t know.”

I write this blog. I’m an engineer. Whilst I do my best and try to proof read, often mistakes creep in. I know there are probably mistakes in just about everything I write! How would I go about estimating the number of errors?

The idea for this article came from a book I recently read by Paul J. Nahin, entitled Duelling Idiots and Other Probability Puzzlers (In turn, referencing earlier work by the eminent mathematician George Pólya).

Proof Reading2

Imagine I write a (non-trivially short) document and give it to two proof readers to check. These two readers (independantly) proof read the manuscript looking for errors, highlighting each one they find.

Just like me, these proof readers are not perfect. They, also, are not going to find all the errors in the document.

Because they work independently, there is a chance that reader #1 will find some errors that reader #2 does not (and vice versa), and there could be errors that are found by both readers. What we are trying to do is get an estimate for the number of unseen errors (errors detected by neither of the proof readers).*

*An alternate way of thinking of this is to get an estimate for the total number of errors in the document (from which we can subtract the distinct number of errors found to give an estimate to the number of unseen errros.

A highly entertaining posts on estimating “known unknowns,” such as the number of errors in a paper that has been proofed by two independent proof readers.

Of more than passing interest to me because I am involved in a New Testament Greek Lexicon project that is an XML encoding of a 500+ page Greek lexicon.

The working text is in XML, but not every feature of the original lexicon was captured in markup and even if that were true, we would still want to improve upon features offered by the lexicon. All of which depend upon the correctness of the original markup.

You will find Nick’s analysis interesting and more than that, memorable. Just in case you are asked about “estimating ‘known unknowns'” in a data science interview.

Only Rumsfeld could tell you how to estimate an “unknown unknowns.” I think it goes: “Watch me pull a number out of my ….”

😉

I was found this post by following another post at this site, which was cited by Data Science Renee.

September 27, 2015

What Does Probability Mean in Your Profession? [Divergences in Meaning]

Filed under: Mathematics,Probability,Subject Identity — Patrick Durusau @ 9:39 pm

What Does Probability Mean in Your Profession? by Ben Orlin.

Impressive drawings that illustrate the divergence in meaning of “probability” for various professions.

I’m not sold on the “actual meaning” drawing because if everyone in a discipline understands “probability” to mean something else, on what basis can you argue for the “actual meaning?”

If I am reading a paper by someone who subscribes to a different meaning than your claimed “actual” one, then I am going to reach erroneous conclusions about their paper. Yes?

That is in order to understand a paper I have to understand the words as they are being used by the author. Yes?

If I understand “democracy and freedom” to mean “serves the interest of U.S.-based multinational corporations,” then calls for “democracy and freedom” in other countries isn’t going to impress me all that much.

Enjoy the drawings!

August 31, 2014

An Introduction to Graphical Models

Filed under: Graphical Models,Graphs,Probability,Probalistic Models — Patrick Durusau @ 2:08 pm

An Introduction to Graphical Models by Michael I. Jordan.

A bit dated (1997), slides, although “wordy” ones, that introduce you to graphical models.

Makes a nice outline to check your knowledge of graphical models.

I first saw this in a tweet by Data Tau.

March 14, 2014

An R “meta” book

Filed under: Probability,R,Statistics — Patrick Durusau @ 7:13 pm

An R “meta” book by Joseph Rickert.

From the post:

Recently, however, while crawling around CRAN, it occurred to me that there is a tremendous amount of high quality material on a wide range of topics in the Contributed Documentation page that would make a perfect introduction to all sorts of people coming to R. Maybe, all it needs is a little marketing and reorganization. So, from among this treasure cache (and a few other online sources), I have assembled an R “meta” book in the following table that might be called: An R Based Introduction to Probability and Statistics with Applications.

What a very clever idea! There is lots of documentation already written and organizing it is simpler than re-doing it all from scratch. Not to mention less time consuming.

Take a close look at Joseph’s “meta” book and see what you think.

Perhaps there are other “meta” books hiding in the Contributed Documentation.

I first saw this in a tweet by David Smith.

February 13, 2014

Conditional probability

Filed under: Graphics,Probability,Visualization — Patrick Durusau @ 8:38 pm

Conditional probability by Victor Powell.

From the post:

A conditional probability is the probability of an event, given some other event has already occurred. In the below example, there are two possible events that can occur. A ball falling could either hit the red shelf (we’ll call this event A) or hit the blue shelf (we’ll call this event B) or both.

Just in terms of visualization prowess, you need to see Victor’s post.

January 23, 2014

$1 Billion Bet, From Another Point of View

Filed under: Probability,Statistics — Patrick Durusau @ 2:20 pm

What’s Warren Buffett’s $1 Billion Basketball Bet Worth? by Corey Chivers.

From the post:

A friend of mine just alerted me to a story on NPR describing a prize on offer from Warren Buffett and Quicken Loans. The prize is a billion dollars (1B USD) for correctly predicting all 63 games in the men’s Division I college basketball tournament this March. The facebook page announcing the contest puts the odds at 1:9,223,372,036,854,775,808, which they note “may vary depending upon the knowledge and skill of entrant”.
….

Corey has some R code for you to do your own analysis based on the skill level of the bettors.

But, while I was thinking about yesterday’s post: Want to win $1,000,000,000 (yes, that’s one billion dollars)?, it occurred to me that the common view of this wager is from a potential winner.

What does this bet look like from Warren Buffet/Quicken Loan point of view?

From the rules:

To be eligible for the $1 billion grand prize, entrants must be 21 years of age, a U.S. citizen and one of the first 10 million to register for the contest. At its sole discretion, Quicken Loans reserves the right and option to expand the entry pool to a larger number of entrants. Submissions will be limited to a total of one per household. (emphasis added)

Only ten million outcomes out of 9,223,372,036,854,775,808 outcomes or 0.00000000010842% of the possible outcomes will be wagered.

$1 Billion is a lot to wager but with wagered outcomes at 0.00000000010842% that leaves 99.9999999998158% of outcomes not wagered.

Remember in multi-player games to consider not only your odds but the odds of others. only the odds that interest you but the odds facing other players.

Thoughts on the probability the tournament outcome will be in the outcomes not wagered?

January 22, 2014

Want to win $1,000,000,000 (yes, that’s one billion dollars)?

Want to win $1,000,000,000 (yes, that’s one billion dollars)? by Ann Drobnis.

The offer is one billion dollars for picking the winners of every game in the NCAA men’s basketball tournament in the Spring of 2014.

Unfortunately, none of the news stories I saw had links back to any authentic information from Quicken Loans and Berkshire Hathaway about the offer.

After some searching I found: Win a Billion Bucks with the Quicken Loans Billion Dollar Bracket Challenge by Clayton Closson, on January 21, 2014 on the Quicken Loans blog. (As far as I can tell it is an authentic post on the QL website.)

From that post:

You could be America’s next billionaire if you’re the grand prize winner of the Quicken Loans Billion Dollar Bracket Challenge. You read that right: one billion. Not one million. Not one hundred million. Not five hundred million. One billion U.S. dollars.

All you have to do is pick a perfect tournament bracket for the upcoming 2014 tournament. That’s it. Guess all the winners of all the games correctly, and Quicken Loans, along with Berkshire Hathaway, will make you a billionaire. The official press release is below. The contest starts March 3, 2014, so we’ll soon have all the info on how and when to enter your perfect bracket.

Good luck, my friends. This is your chance to play in perhaps the biggest sweepstakes in U.S. history. It’s your chance for a billion.

Oh, and by the way, the 20 closest imperfect brackets will win a cool hundred grand to put toward their home (or new home). Plus, in conjunction with the sweepstakes, Quicken Loans will donate $1 million to Detroit and Cleveland nonprofits to help with education of inner city youth.

So, to recap: If you’re perfect, you’ll win a billion. If you’re not perfect, you could win $100,000. The entry period begins Monday, March 3, 2014 and runs until Wednesday, March 19, 2014. Stay tuned on how to enter.

Contest updates at: Facebook.com/QuickenLoans.

The odds against winning are absurd but this has all the markings of a big data project. Historical data, current data on the teams and players, models, prior outcomes to test your models, etc.

I wonder if Watson likes basketball?

October 8, 2013

From Algorithms to Z-Scores:…

Filed under: Algorithms,Computer Science,Mathematics,Probability,R,Statistics — Patrick Durusau @ 2:47 pm

From Algorithms to Z-Scores: Probabilistic and Statistical Modeling in Computer Science by Noram Matloff.

From the Overview:

The materials here form a textbook for a course in mathematical probability and statistics for computer science students. (It would work fine for general students too.)


“Why is this text different from all other texts?”

  • Computer science examples are used throughout, in areas such as: computer networks; data and text mining; computer security; remote sensing; computer performance evaluation; software engineering; data management; etc.
  • The R statistical/data manipulation language is used throughout. Since this is a computer science audience, a greater sophistication in programming can be assumed. It is recommended that my R tutorials be used as a supplement:

  • Throughout the units, mathematical theory and applications are interwoven, with a strong emphasis on modeling: What do probabilistic models really mean, in real-life terms? How does one choose a model? How do we assess the practical usefulness of models?

    For instance, the chapter on continuous random variables begins by explaining that such distributions do not actually exist in the real world, due to the discreteness of our measuring instruments. The continuous model is therefore just that–a model, and indeed a very useful model.

    There is actually an entire chapter on modeling, discussing the tradeoff between accuracy and simplicity of models.

  • There is considerable discussion of the intuition involving probabilistic concepts, and the concepts themselves are defined through intuition. However, all models and so on are described precisely in terms of random variables and distributions.

Another open-source textbook from Norm Matloff!

Algorithms to Z-Scores (the book).

Source files for the book available at: http://heather.cs.ucdavis.edu/~matloff/132/PLN .

Norm suggests his R tutorial, R for Programmers http://heather.cs.ucdavis.edu/~matloff/R/RProg.pdf as supplemental reading material.

To illustrate the importance of statistics, Norm gives the following examples in chapter 1:

  • The statistical models used on Wall Street made the quants” (quantitative analysts) rich— but also contributed to the worldwide fi nancial crash of 2008.
  • In a court trial, large sums of money or the freedom of an accused may hinge on whether the judge and jury understand some statistical evidence presented by one side or the other.
  • Wittingly or unconsciously, you are using probability every time you gamble in a casino— and every time you buy insurance.
  • Statistics is used to determine whether a new medical treatment is safe/e ffective for you.
  • Statistics is used to flag possible terrorists —but sometimes unfairly singling out innocent people while other times missing ones who really are dangerous.

Mastering the material in this book will put you a long way to becoming a network “statistical skeptic.”

So you can debunk mis-leading or simply wrong claims by government, industry and special interest groups. Wait! Those are also known as advertisers. Never mind.

April 16, 2013

Probabilistic Bounds — A Primer

Filed under: Mathematics,Probability — Patrick Durusau @ 4:43 pm

Probabilistic Bounds — A Primer by Jeremy Kun.

From the post:

Probabilistic arguments are a key tool for the analysis of algorithms in machine learning theory and probability theory. They also assume a prominent role in the analysis of randomized and streaming algorithms, where one imposes a restriction on the amount of storage space an algorithm is allowed to use for its computations (usually sublinear in the size of the input).

While a whole host of probabilistic arguments are used, one theorem in particular (or family of theorems) is ubiquitous: the Chernoff bound. In its simplest form, the Chernoff bound gives an exponential bound on the deviation of sums of random variables from their expected value.

This is perhaps most important to algorithm analysis in the following mindset. Say we have a program whose output is a random variable X. Moreover suppose that the expected value of X is the correct output of the algorithm. Then we can run the algorithm multiple times and take a median (or some sort of average) across all runs. The probability that the algorithm gives a wildly incorrect answer is the probability that more than half of the runs give values which are wildly far from their expected value. Chernoff’s bound ensures this will happen with small probability.

So this post is dedicated to presenting the main versions of the Chernoff bound that are used in learning theory and randomized algorithms. Unfortunately the proof of the Chernoff bound in its full glory is beyond the scope of this blog. However, we will give short proofs of weaker, simpler bounds as a straightforward application of this blog’s previous work laying down the theory.

If the reader has not yet intuited it, this post will rely heavily on the mathematical formalisms of probability theory. We will assume our reader is familiar with the material from our first probability theory primer, and it certainly wouldn’t hurt to have read our conditional probability theory primer, though we won’t use conditional probability directly. We will refrain from using measure-theoretic probability theory entirely (some day my colleagues in analysis will like me, but not today).

Another heavy sledding post from Jeremy but if you persist, you will gain a deeper understanding of the algorithms of machine learning theory.

If that sounds esoteric, consider that it will help you question results produced by algorithms of machine learning.

Do you really want to take a machine’s “word” for something important?

Or do you want the chance to know why an answer is correct, questionable or incorrect?

April 5, 2013

Probability and Statistics Cookbook

Filed under: Mathematics,Probability,Statistics — Patrick Durusau @ 3:02 pm

Probability and Statistics Cookbook by Matthias Vallentin.

From the webpage:

The cookbook contains a succinct representation of various topics in probability theory and statistics. It provides a comprehensive reference reduced to the mathematical essence, rather than aiming for elaborate explanations.

When Matthias says “succient,” he is quite serious:

Probability Screenshot

But by the time you master the twenty-seven pages of this “cookbook,” you will have a very good grounding on probability and statistics.

January 13, 2013

Outlier Analysis

Filed under: Data Analysis,Outlier Detection,Probability,Statistics — Patrick Durusau @ 8:15 pm

Outlier Analysis by Charu Aggarwal (Springer, January 2013). Post by Gregory Piatetsky.

From the post:

This is an authored text book on outlier analysis. The book can be considered a first comprehensive text book in this area from a data mining and computer science perspective. Most of the earlier books in outlier detection were written from a statistical perspective, and precede the emergence of the data mining field over the last 15-20 years.

Each chapter contains carefully organized content on the topic, case studies, extensive bibliographic notes and the future direction of research in this field. Thus, the book can also be used as a reference aid. Emphasis was placed on simplifying the content, so that the material is relatively easy to assimilate. The book assumes relatively little prior background, other than a very basic understanding of probability and statistical concepts. Therefore, in spite of its deep coverage, it can also provide a good introduction to the beginner. The book includes exercises as well, so that it can be used as a teaching aid.

Table of Contents and Introduction. Includes exercises and a 500+ reference bibliography.

Definitely a volume for the short reading list.

Caveat: As an outlier by any measure, my opinions here may be biased. 😉

January 11, 2013

Probability Theory — A Primer

Filed under: Mathematics,Probability — Patrick Durusau @ 7:36 pm

Probability Theory — A Primer by Jeremy Kun.

From the post:

It is a wonder that we have yet to officially write about probability theory on this blog. Probability theory underlies a huge portion of artificial intelligence, machine learning, and statistics, and a number of our future posts will rely on the ideas and terminology we lay out in this post. Our first formal theory of machine learning will be deeply ingrained in probability theory, we will derive and analyze probabilistic learning algorithms, and our entire treatment of mathematical finance will be framed in terms of random variables.

And so it’s about time we got to the bottom of probability theory. In this post, we will begin with a naive version of probability theory. That is, everything will be finite and framed in terms of naive set theory without the aid of measure theory. This has the benefit of making the analysis and definitions simple. The downside is that we are restricted in what kinds of probability we are allowed to speak of. For instance, we aren’t allowed to work with probabilities defined on all real numbers. But for the majority of our purposes on this blog, this treatment will be enough. Indeed, most programming applications restrict infinite problems to finite subproblems or approximations (although in their analysis we often appeal to the infinite).

We should make a quick disclaimer before we get into the thick of things: this primer is not meant to connect probability theory to the real world. Indeed, to do so would be decidedly unmathematical. We are primarily concerned with the mathematical formalisms involved in the theory of probability, and we will leave the philosophical concerns and applications to future posts. The point of this primer is simply to lay down the terminology and basic results needed to discuss such topics to begin with.

So let us begin with probability spaces and random variables.

Jeremy’s “primer” posts make good background reading. (A primers listing.)

Work through them carefully for best results.

September 17, 2012

Probability and Statistics Cookbook

Filed under: Mathematics,Probability,Statistics — Patrick Durusau @ 6:16 pm

Probability and Statistics Cookbook by Matthias Vallentin.

From the webpage:

The cookbook contains a succinct representation of various topics in probability theory and statistics. It provides a comprehensive reference reduced to the mathematical essence, rather than aiming for elaborate explanations.

Very summary presentation so better as a quick reminder type resource.

I was particularly impressed by the univariate distribution relationships map on the last page.

In that regard, you may want to look at John D. Cook’s Diagram of distribution relationships
and the links therein.

August 27, 2012

Grinstead and Snell’s Introduction to Probability

Filed under: Mathematics,Probability — Patrick Durusau @ 2:37 pm

Grinstead and Snell’s Introduction to Probability

From the preface:

Probability theory began in seventeenth century France when the two great French mathematicians, Blaise Pascal and Pierre de Fermat, corresponded over two problems from games of chance. Problems like those Pascal and Fermat solved continued to influence such early researchers as Huygens, Bernoulli, and DeMoivre in establishing a mathematical theory of probability. Today, probability theory is a well-established branch of mathematics that finds applications in every area of scholarly activity from music to physics, and in daily experience from weather prediction to predicting the risks of new medical treatments.

This text is designed for an introductory probability course taken by sophomores, juniors, and seniors in mathematics, the physical and social sciences, engineering, and computer science. It presents a thorough treatment of probability ideas and techniques necessary for a firm understanding of the subject. The text can be used in a variety of course lengths, levels, and areas of emphasis.

What promises to be an entertaining and even literate book on probability.

I first saw this at Christopher Lalanne’s A bag of tweets / August 2012.

Powered by WordPress