Another Word For It Patrick Durusau on Topic Maps and Semantic Diversity

November 10, 2018

Relational inductive biases, deep learning, and graph networks

Filed under: Deep Learning,Graphs,Networks — Patrick Durusau @ 9:15 pm

Relational inductive biases, deep learning, and graph networks by Peter W. Battaglia, et al.

Abstract:

Artificial intelligence (AI) has undergone a renaissance recently, making major progress in key domains such as vision, language, control, and decision-making. This has been due, in part, to cheap data and cheap compute resources, which have fit the natural strengths of deep learning. However, many defining characteristics of human intelligence, which developed under much different pressures, remain out of reach for current approaches. In particular, generalizing beyond one’s experiences–a hallmark of human intelligence from infancy–remains a formidable challenge for modern AI.

The following is part position paper, part review, and part unification. We argue that combinatorial generalization must be a top priority for AI to achieve human-like abilities, and that structured representations and computations are key to realizing this objective. Just as biology uses nature and nurture cooperatively, we reject the false choice between “hand-engineering” and “end-to-end” learning, and instead advocate for an approach which benefits from their complementary strengths. We explore how using relational inductive biases within deep learning architectures can facilitate learning about entities, relations, and rules for composing them. We present a new building block for the AI toolkit with a strong relational inductive bias–the graph network–which generalizes and extends various approaches for neural networks that operate on graphs, and provides a straightforward interface for manipulating structured knowledge and producing structured behaviors. We discuss how graph networks can support relational reasoning and combinatorial generalization, laying the foundation for more sophisticated, interpretable, and flexible patterns of reasoning. As a companion to this paper, we have released an open-source software library for building graph networks, with demonstrations of how to use them in practice.

Forty pages of very deep sledding.

Just on a quick scan, I do take encouragement from:

An entity is an element with attributes, such as a physical object with a size and mass. (page 4)

Could it be that entities have identities defined by their attributes? Are the attributes and their values recursive subjects?

Only a close read of the paper will tell but I wanted to share it today.

Oh, the authors have released a library for building graph networks: https://github.com/deepmind/graph_nets.
February 17, 2018

Evidence for Power Laws – “…I work scientifically!”

Filed under: Computer Science,Networks,Scale-Free — Patrick Durusau @ 9:28 pm

Scant Evidence of Power Laws Found in Real-World Networks by Erica Klarreich.

From the post:

A paper posted online last month has reignited a debate about one of the oldest, most startling claims in the modern era of network science: the proposition that most complex networks in the real world — from the World Wide Web to interacting proteins in a cell — are “scale-free.” Roughly speaking, that means that a few of their nodes should have many more connections than others, following a mathematical formula called a power law, so that there’s no one scale that characterizes the network.

Purely random networks do not obey power laws, so when the early proponents of the scale-free paradigm started seeing power laws in real-world networks in the late 1990s, they viewed them as evidence of a universal organizing principle underlying the formation of these diverse networks. The architecture of scale-freeness, researchers argued, could provide insight into fundamental questions such as how likely a virus is to cause an epidemic, or how easily hackers can disable a network.

An informative and highly entertaining read that reminds me of an exchange between in The Never Ending Story between Atreyu and Engywook.

Engywook’s “scientific specie-ality” is the Southern Oracle. From the transcript:

Atreyu: Have you ever been to the Southern Oracle?

Engywook: Eh… what do YOU think? I work scientifically!

In the context of the movie, Engywook’s answer is deeply ambiguous.

Where do you land on the power law question?

February 6, 2018

Dive into BPF: a list of reading material

Filed under: Cybersecurity,Networks — Patrick Durusau @ 8:22 pm

Dive into BPF: a list of reading material by Quentin Monnet.

From the post:

BPF, as in Berkeley Packet Filter, was initially conceived in 1992 so as to provide a way to filter packets and to avoid useless packet copies from kernel to userspace. It initially consisted in a simple bytecode that is injected from userspace into the kernel, where it is checked by a verifier—to prevent kernel crashes or security issues—and attached to a socket, then run on each received packet. It was ported to Linux a couple of years later, and used for a small number of applications (tcpdump for example). The simplicity of the language as well as the existence of an in-kernel Just-In-Time (JIT) compiling machine for BPF were factors for the excellent performances of this tool.

Then in 2013, Alexei Starovoitov completely reshaped it, started to add new functionalities and to improve the performances of BPF. This new version is designated as eBPF (for “extended BPF”), while the former becomes cBPF (“classic” BPF). New features such as maps and tail calls appeared. The JIT machines were rewritten. The new language is even closer to native machine language than cBPF was. And also, new attach points in the kernel have been created.

Thanks to those new hooks, eBPF programs can be designed for a variety of use cases, that divide into two fields of applications. One of them is the domain of kernel tracing and event monitoring. BPF programs can be attached to kprobes and they compare with other tracing methods, with many advantages (and sometimes some drawbacks).

The other application domain remains network programming. In addition to socket filter, eBPF programs can be attached to tc (Linux traffic control tool) ingress or egress interfaces and perform a variety of packet processing tasks, in an efficient way. This opens new perspectives in the domain.

And eBPF performances are further leveraged through the technologies developed for the IO Visor project: new hooks have also been added for XDP (“eXpress Data Path”), a new fast path recently added to the kernel. XDP works in conjunction with the Linux stack, and relies on BPF to perform very fast packet processing.

Even some projects such as P4, Open vSwitch, consider or started to approach BPF. Some others, such as CETH, Cilium, are entirely based on it. BPF is buzzing, so we can expect a lot of tools and projects to orbit around it soon…

I haven’t even thought about the Berkeley Packet Filter in more than a decade.

But such a wonderful reading list merits mention in its own right. What a great model for reading lists on other topics!

And one or more members of your team may want to get closer to the metal on packet traffic.

PS: I don’t subscribe to the only governments can build nation state level tooling for hacks. Loose confederations of people built the Internet. Something to keep in mind while sharing code and hacks.

January 31, 2018

GraphDBLP [“dblp computer science bibliography” as a graph]

Filed under: Computer Science,Graphs,Neo4j,Networks — Patrick Durusau @ 3:30 pm

GraphDBLP: a system for analysing networks of computer scientists through graph databases by Mario Mezzanzanica, et al.

Abstract:

This paper presents GraphDBLP, a system that models the DBLP bibliography as a graph database for performing graph-based queries and social network analyses. GraphDBLP also enriches the DBLP data through semantic keyword similarities computed via word-embedding. In this paper, we discuss how the system was formalized as a multi-graph, and how similarity relations were identified through word2vec. We also provide three meaningful queries for exploring the DBLP community to (i) investigate author profiles by analysing their publication records; (ii) identify the most prolific authors on a given topic, and (iii) perform social network analyses over the whole community. To date, GraphDBLP contains 5+ million nodes and 24+ million relationships, enabling users to explore the DBLP data by referencing more than 3.3 million publications, 1.7 million authors, and more than 5 thousand publication venues. Through the use of word-embedding, more than 7.5 thousand keywords and related similarity values were collected. GraphDBLP was implemented on top of the Neo4j graph database. The whole dataset and the source code are publicly available to foster the improvement of GraphDBLP in the whole computer science community.

Although the article is behind a paywall, GraphDBLP as a tool is not! https://github.com/fabiomercorio/GraphDBLP.

From the webpage:

GraphDBLP is a tool that models the DBLP bibliography as a graph database for performing graph-based queries and social network analyses.

GraphDBLP also enriches the DBLP data through semantic keyword similarities computed via word-embedding.

GraphDBLP provides to users three meaningful queries for exploring the DBLP community:

  1. investigate author profiles by analysing their publication records;
  2. identify the most prolific authors on a given topic;
  3. perform social network analyses over the whole community;
  4. perform shortest-paths over DBLP (e.g., the shortest-path between authors, the analysis of co-author networks, etc.)

… (emphasis in original)

Sorry to see author, title, venue, publication, keyword all as flat strings but that’s not uncommon. Disappointing but not uncommon.

Viewing these flat strings as parts of structured representatives will be in addition to this default.

Not to minimize the importance of improving the usefulness of the dblp, but imagine integrating the GraphDBLP into your local library system. Without a massive data mapping project. That’s what lies just beyond the reach of this data project.

December 20, 2017

Violating TCP

Filed under: Cybersecurity,Networks — Patrick Durusau @ 8:18 pm

This is strictly a violation of the TCP specification by Marek Majkowski.

From the post:

I was asked to debug another weird issue on our network. Apparently every now and then a connection going through CloudFlare would time out with 522 HTTP error.

522 error on CloudFlare indicates a connection issue between our edge server and the origin server. Most often the blame is on the origin server side – the origin server is slow, offline or encountering high packet loss. Less often the problem is on our side.

In the case I was debugging it was neither. The internet connectivity between CloudFlare and origin was perfect. No packet loss, flat latency. So why did we see a 522 error?

The root cause of this issue was pretty complex. After a lot of debugging we identified an important symptom: sometimes, once in thousands of runs, our test program failed to establish a connection between two daemons on the same machine. To be precise, an NGINX instance was trying to establish a TCP connection to our internal acceleration service on localhost. This failed with a timeout error.

It’s unlikely that you will encounter this issue but Majkowski’s debugging of it is a great story.

It also illustrates how deep the foundations of an error, bug or vulnerability may lie.

September 18, 2017

Game of Thrones, Murder Network Analysis

Filed under: Games,Graphs,Networks,Social Graphs,Social Networks,Visualization — Patrick Durusau @ 1:03 pm

Game of Thrones, Murder Network Analysis by George McIntire.

From the post:

Everybody’s favorite show about bloody power struggles and dragons, Game of Thrones, is back for its seventh season. And since we’re such big GoT fans here, we just had to do a project on analyzing data from the hit HBO show. You might not expect it, but the show is rife with data and has been the subject of various data projects from data scientists, who we all know love to combine their data powers with the hobbies and interests.

Milan Janosov of the Central European University devised a machine learning algorithm to predict the death of certain characters. A handy tool, for any fan tired of being surprised by the shock murders of the show. Dr. Allen Downey, author of the popular ThinkStats textbooks conducted a Bayesian analysis of the characters’ survival rate in the show. Data Scientist and biologist Shirin Glander applied social network analysis tools to analyze and visualize the family and house relationships of the characters.

The project we did is quite similar to that of Glander’s, we’ll be playing around with network analysis, but with data on the murderers and their victims. We constructed a giant network that maps out every murder of character’s with minor, recurring, and major roles.

The data comes courtesy of Ændrew Rininsland of The Financial Times, who’s done a great of collecting, cleaning, and formatting the data. For the purposes of this project, I had to do a whole lot of wrangling and cleaning of my own and in addition to my subjective decisions about which characters to include as well and what constitutes a murder. My finalized dataset produced a total of of 240 murders from 79 killers. For my network graph, the data produced a total of 225 nodes and 173 edges.

I prefer the Game of Thrones (GoT) books over the TV series. The text exercises a reader’s imagination in ways that aren’t matched by visual media.

That said, the TV series murder data set (Ændrew Rininsland of The Financial Times) is a great resource to demonstrate the power of network analysis.

After some searching, it appears that sometime in 2018 is the earliest date for the next volume in the GoT series. Sorry.

May 15, 2017

Network analysis of Game of Thrones family ties [A Timeless Network?]

Filed under: Graphs,Networks,R — Patrick Durusau @ 4:37 pm

Network analysis of Game of Thrones family ties by Shirin Glander.

From the post:

In this post, I am exploring network analysis techniques in a family network of major characters from Game of Thrones.

Not surprisingly, we learn that House Stark (specifically Ned and Sansa) and House Lannister (especially Tyrion) are the most important family connections in Game of Thrones; they also connect many of the storylines and are central parts of the narrative.

The basis for this network is Kaggle’s Game of Throne dataset (character-deaths.csv). Because most family relationships were missing in that dataset, I added the missing information in part by hand (based on A Wiki of Ice and Fire) and by scraping information from the Game of Thrones wiki. You can find the full code for how I generated the network on my Github page.

Glander improves network data for the Game of Thrones and walks you through the use of R to analyze that network.

It’s useful work and will repay close study.

Network analysis can used with all social groups, activists, bankers, hackers, members of Congress (U.S.), terrorists, etc.

But just as Ned Stark has no relationship with dire wolves when the story begins, networks of social groups develop, change, evolve if you will, over time.

Moreover, events, interactions, involving one or more members of the network, occur in time sequence. A social network that fails to capture those events and their sequencing, from one or more points of view, is a highly constrained network.

A useful network as Glander demonstrates but one cannot answer simple questions about the order in which characters gained knowledge that a particular character hurled another character from a very high window.

If I were investigating say a leak of NSA cybertools, time sequencing like that would be one of my top priorities.

Thoughts?

May 9, 2017

Network datasets (@Ognyanova)

Filed under: Graphs,Networks — Patrick Durusau @ 3:24 pm

Network datasets by Katherine Ognyanova.

From the post:

Since I started posting network tutorials on this site, people will occasionally write to ask me about the included example datasets. I also get e-mails from people asking where they might find network data to use for a project or in teaching. Seems like a good idea to post a quick reply here.

The datasets included in my tutorials are mostly synthetic (or trimmed and heavily manipulated) in order to illustrate various visualization aspects in a manageable way. Feel free to use those datasets (citing or linking to the source is appreciated), but keep in mind that they are artificially generated and not the result of actual data collection. When I do use empirical data, the download files include documentation (if the data is collected by me) or clearly point to the source (if the data was collected by someone else).

If you are looking for network data, large or small, there are a number of excellent open online repositories that you can take a look at. Below is a short list (feel free to e-mail me if you have other good links, and I will add them here).

Links to ten (10) collections of network datasets, plus suggestions on software for collecting and analyzing social network data.

Considering following her: @Ognyanova. See her website, http://kateto.net/ for additional resources.

October 26, 2016

No Frills Gephi (8.2) Import of Clinton/Podesta Emails (1-18)

Filed under: Gephi,Graphs,Hillary Clinton,Neo4j,Networks,Politics,Visualization — Patrick Durusau @ 7:19 pm

Using Gephi 8.2, you can create graphs of the Clinton/Podesta emails based on terms in subject lines or the body of the emails. You can interactively work with all 30K+ (as of today) emails and extract networks based on terms in the posts. No programming required. (Networks based on terms will appear tomorrow.)

If you have Gephi 8.2 (I can’t find the import spigot in 9.0 or 9.1), you can import the Clinton/Podesta Emails (1-18) for analysis as a network.

To save you the trouble of regressing to Gephi 8.2, I performed a no frills/default import and exported that file as podesta-1-18-network.gephi.gz.

Download and uncompress podesta-1-18-network.gephi.gz, then you can pickup at timemark 3.49.

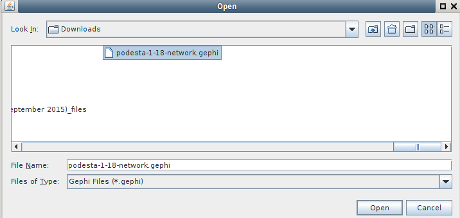
Open the file (your location may differ):

gephi-podesta-open-460

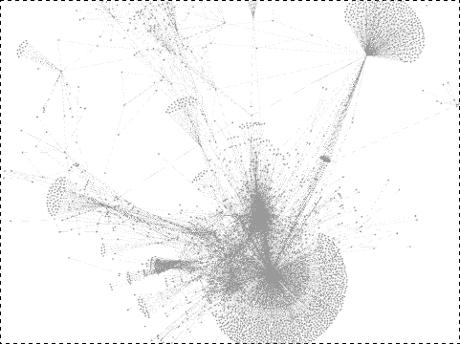
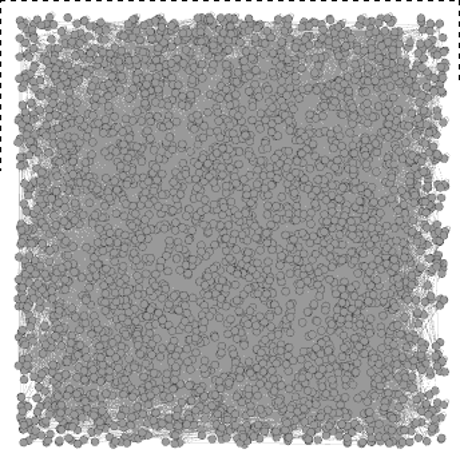
Obligatory hair-ball graph visualization. 😉

gephi-first-look-460

Considerably less appealing that Jennifer Golbeck’s but be patient!

First step, Layout -> Yifan Hu. My results:

yifan-hu-first-460

Second step, Network Diameter statistics (right side, run).

No visible impact on the graph but, now you can change the color and size of nodes in the graph. That is they have attributes on which you can base the assignment of color and size.

Tutorial gotcha: Not one of Jennifer’s tutorials but I was watching a Gephi tutorial that skipped the part about running statistics on the graph prior to assignment of color and size. Or I just didn’t hear it. The menu options appear in documentation but you can’t access them unless and until you run network statistics or have attributes for the assignment of color and size. Run statistics first!

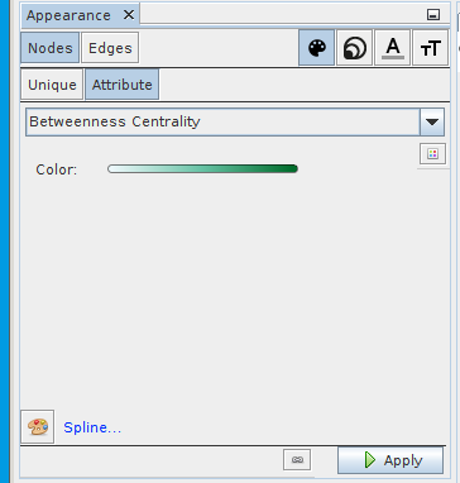
Next, assign colors based on betweenness centrality:

gephi-betweenness-460

The densest node is John Podesta, but if you remove his node, rerun the network statistics and re-layout the graph, here is part of what results:

delete-central-node-460

A no frills import of 31,819 emails results in a graph of 3235 nodes and 11,831 edges.

That’s because nodes and edges combine (merge to you topic map readers) when they have the same identifier or for edges are between the same nodes.

Subject to correction, when that combining/merging occurs, the properties on the respective nodes/edges are accumulated.

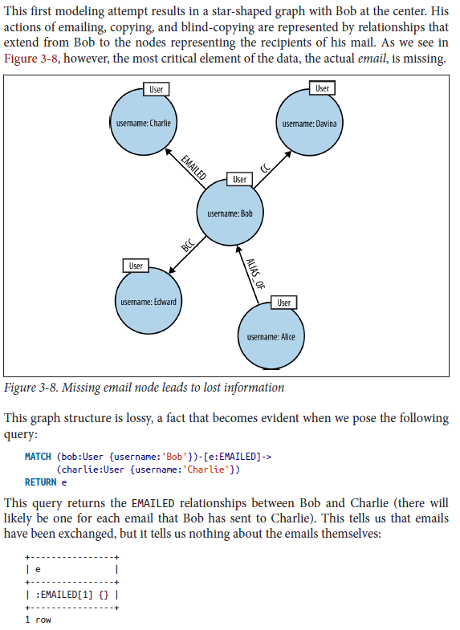
Topic mappers already realize there are important subjects missing, some 31,819 of them. That is the emails themselves don’t by default appear as nodes in the network.

Ian Robinson, Jim Webber & Emil Eifrem illustrate this lossy modeling in Graph Databases this way:

graph-databases-lossy-460

Modeling emails without the emails is rather lossy. 😉

Other nodes/subjects we might want:

  • Multiple to: emails – Is who was also addressed important?
  • Multiple cc: emails – Same question as with to:.
  • Date sent as properties? So evolution of network/emails can be modeled.
  • Capture “reply-to” for relationships between emails?

Other modeling concerns?

Bear in mind that we can suppress a large amount of the detail so you can interactively explore the graph and only zoom into/display data after finding interesting patterns.

Some helpful links:

https://archive.org/details/PodestaEmailszipped: The email collection as bulk download, thanks to Michael Best, @NatSecGeek.

https://github.com/gephi/gephi/releases: Where you can grab a copy of Gephi 8.2.

May 4, 2016

Network structure and resilience of Mafia syndicates

Filed under: Networks,Social Networks — Patrick Durusau @ 7:11 pm

Network structure and resilience of Mafia syndicates by Santa Agrestea, Salvatore Catanesea, Pasquale De Meoc, Emilio Ferrara, Giacomo Fiumaraa.

Abstract:

In this paper we present the results of our study of Sicilian Mafia organizations using social network analysis. The study investigates the network structure of a Mafia syndicate, describing its evolution and highlighting its plasticity to membership-targeting interventions and its resilience to disruption caused by police operations. We analyze two different datasets dealing with Mafia gangs that were built by examining different digital trails and judicial documents that span a period of ten years. The first dataset includes the phone contacts among suspected individuals, and the second captures the relationships among individuals actively involved in various criminal offenses. Our report illustrates the limits of traditional investigative methods like wiretapping. Criminals high up in the organization hierarchy do not occupy the most central positions in the criminal network, and oftentimes do not appear in the reconstructed criminal network at all. However, we also suggest possible strategies of intervention. We show that, although criminal networks (i.e., the network encoding mobsters and crime relationships) are extremely resilient to different kinds of attacks, contact networks (i.e., the network reporting suspects and reciprocated phone calls) are much more vulnerable, and their analysis can yield extremely valuable insights.

Studying the vulnerabilities identified here may help you strengthen your own networks against similar analysis.

To give you the perspective of the authors:

Due to its normative structure as well as strong ties with finance, entrepreneurs and politicians, Mafia has now risen to prominence as a worldwide criminal organization by controlling many illegal activities like the trade of cocaine, money laundering or illegal military weapon trafficking [4].

They say that as though it is a bad thing. As Neal Stephenson says in Snow Crash, the Mafia is just another franchise. 😉

Understanding the model others expect enables you to expose a model that doesn’t match their expectations.

Think of it as hiding in plain sight.

April 10, 2016

NSA Grade – Network Visualization with Gephi

Filed under: Gephi,Networks,R,Visualization — Patrick Durusau @ 5:07 pm

Network Visualization with Gephi by Katya Ognyanova.

It’s not possible to cover Gephi in sixteen (16) pages but you will wear out more than one printed copy of these sixteen (16) pages as you become experienced with Gephi.

This version is from a Gephi workshop at Sunbelt 2016.

Katya‘s homepage offers a wealth of network visualization posts and extensive use of R.

Follow her at @Ognyanova.

PS: Gephi equals or exceeds visualization capabilities in use by the NSA, depending upon your skill as an analyst and the quality of the available data.

March 31, 2016

Game of Thrones – Network Analysis

Filed under: Graphs,Networks — Patrick Durusau @ 8:11 pm

game-of-thrones-network

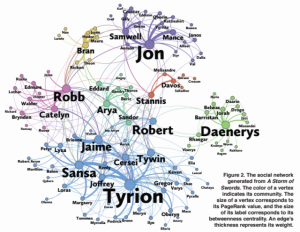
You can read the popular account of this network analysis of the Game of Thrones in Mathematicians mapped out every “Game of Thrones” relationship to find the main character by Adam Epstein or, you can try Network of Thrones by Andrew Beveridge and Jie Shan.

There are a number of choices you may want to re-visit if you explore the Game of Thrones as a graph/network, not the least of which is expanding the data beyond volume 3, characterizing the type of “relationships” (edges) found between characters and how you would capture the time aspect of the development of the “relationships” you do find.

Great work that will hopefully spur others to similar explorations.

February 24, 2016

Visualizing the Clinton Email Network in R

Filed under: Networks,R,Visualization — Patrick Durusau @ 5:04 pm

Visualizing the Clinton Email Network in R by Bob Rudis.

From the post:

This isn’t a post about politics. I do have opinions about the now infamous e-mail server (which will no doubt come out here), but when the WSJ folks made it possible to search the Clinton email releases I though it would be fun to get the data into R to show how well the igraph and ggnetwork packages could work together, and also show how to use svgPanZoom to make it a bit easier to poke around the resulting hairball network.

NOTE: There are a couple “Assignment” blocks in here. My Elements of Data Science students are no doubt following the blog by now so those are meant for you 🙂 Other intrepid readers can ignore them.

A great walk through on importing, analyzing, and visualizing any email archive, not just Hillary’s.

You will quickly find that “…connecting the dots…” isn’t as useful as the intelligence community would have you believe.

Yes, yes! There is a call to Papa John’s! Oh, that’s not a code name, that’s a pizza place. (Even suspected terrorists have to eat.)

Great to have the dots. Great to have connections. Not so great if that is all that you have.

I found a number of other interesting posts at Bob’s blog: http://rud.is/b/.

Including: Dairy-free Parker House Rolls! I bake fairly often so am susceptible to this sort of posting. Looks very good!

February 15, 2016

networkD3: D3 JavaScript Network Graphs from R

Filed under: D3,Graphs,Javascript,Networks,R — Patrick Durusau @ 5:41 pm

networkD3: D3 JavaScript Network Graphs from R by Christopher Gandrud, JJ Allaire, & Kent Russell.

From the post:

This is a port of Christopher Gandrud’s R package d3Network for creating D3 network graphs to the htmlwidgets framework. The htmlwidgets framework greatly simplifies the package’s syntax for exporting the graphs, improves integration with RStudio’s Viewer Pane, RMarkdown, and Shiny web apps. See below for examples.

It currently supports three types of network graphs:

I haven’t compared this to GraphViz but the Sankey diagram option is impressive!

December 25, 2015

The Social-Network Illusion That Tricks Your Mind – (Terrorism As Majority Illusion)

Filed under: Networks,Social Media,Social Networks — Patrick Durusau @ 5:19 pm

The Social-Network Illusion That Tricks Your Mind

From the post:

One of the curious things about social networks is the way that some messages, pictures, or ideas can spread like wildfire while others that seem just as catchy or interesting barely register at all. The content itself cannot be the source of this difference. Instead, there must be some property of the network that changes to allow some ideas to spread but not others.

Today, we get an insight into why this happens thanks to the work of Kristina Lerman and pals at the University of Southern California. These people have discovered an extraordinary illusion associated with social networks which can play tricks on the mind and explain everything from why some ideas become popular quickly to how risky or antisocial behavior can spread so easily.

Network scientists have known about the paradoxical nature of social networks for some time. The most famous example is the friendship paradox: on average your friends will have more friends than you do.

This comes about because the distribution of friends on social networks follows a power law. So while most people will have a small number of friends, a few individuals have huge numbers of friends. And these people skew the average.

Here’s an analogy. If you measure the height of all your male friends. you’ll find that the average is about 170 centimeters. If you are male, on average, your friends will be about the same height as you are. Indeed, the mathematical notion of “average” is a good way to capture the nature of this data.

But imagine that one of your friends was much taller than you—say, one kilometer or 10 kilometers tall. This person would dramatically skew the average, which would make your friends taller than you, on average. In this case, the “average” is a poor way to capture this data set.

If that has you interested, see:

The Majority Illusion in Social Networks by Kristina Lerman, Xiaoran Yan, Xin-Zeng Wu.

Abstract:

Social behaviors are often contagious, spreading through a population as individuals imitate the decisions and choices of others. A variety of global phenomena, from innovation adoption to the emergence of social norms and political movements, arise as a result of people following a simple local rule, such as copy what others are doing. However, individuals often lack global knowledge of the behaviors of others and must estimate them from the observations of their friends’ behaviors. In some cases, the structure of the underlying social network can dramatically skew an individual’s local observations, making a behavior appear far more common locally than it is globally. We trace the origins of this phenomenon, which we call “the majority illusion,” to the friendship paradox in social networks. As a result of this paradox, a behavior that is globally rare may be systematically overrepresented in the local neighborhoods of many people, i.e., among their friends. Thus, the “majority illusion” may facilitate the spread of social contagions in networks and also explain why systematic biases in social perceptions, for example, of risky behavior, arise. Using synthetic and real-world networks, we explore how the “majority illusion” depends on network structure and develop a statistical model to calculate its magnitude in a network.

Research has not reached the stage of enabling the manipulation of public opinion to reflect the true rarity of terrorist activity in the West.

That being the case, being factually correct that Western fear of terrorism is a majority illusion isn’t as profitable as product tying to that illusion.

December 5, 2015

‘Outsiders’ Crack A 50-Year-Old Math Problem

Filed under: Mathematics,Matrix,Networks — Patrick Durusau @ 3:28 pm

‘Outsiders’ Crack A 50-Year-Old Math Problem by Erica Klarreich.

From the post:

In 2008, Daniel Spielman told his Yale University colleague Gil Kalai about a computer science problem he was working on, concerning how to “sparsify” a network so that it has fewer connections between nodes but still preserves the essential features of the original network.

Network sparsification has applications in data compression and efficient computation, but Spielman’s particular problem suggested something different to Kalai. It seemed connected to the famous Kadison-Singer problem, a question about the foundations of quantum physics that had remained unsolved for almost 50 years.

Over the decades, the Kadison-Singer problem had wormed its way into a dozen distant areas of mathematics and engineering, but no one seemed to be able to crack it. The question “defied the best efforts of some of the most talented mathematicians of the last 50 years,” wrote Peter Casazza and Janet Tremain of the University of Missouri in Columbia, in a 2014 survey article.

As a computer scientist, Spielman knew little of quantum mechanics or the Kadison-Singer problem’s allied mathematical field, called C*-algebras. But when Kalai, whose main institution is the Hebrew University of Jerusalem, described one of the problem’s many equivalent formulations, Spielman realized that he himself might be in the perfect position to solve it. “It seemed so natural, so central to the kinds of things I think about,” he said. “I thought, ‘I’ve got to be able to prove that.’” He guessed that the problem might take him a few weeks.

Instead, it took him five years. In 2013, working with his postdoc Adam Marcus, now at Princeton University, and his graduate student Nikhil Srivastava, now at the University of California, Berkeley, Spielman finally succeeded. Word spread quickly through the mathematics community that one of the paramount problems in C*-algebras and a host of other fields had been solved by three outsiders — computer scientists who had barely a nodding acquaintance with the disciplines at the heart of the problem.

Why all the excitement?


The proof of the Kadison-Singer problem implies that all the constructions in its dozen incarnations can, in principle, be carried out—quantum knowledge can be extended to full quantum systems, networks can be decomposed into electrically similar ones, matrices can be broken into simpler chunks. The proof won’t change what quantum physicists do, but it could have applications in signal processing, since it implies that collections of vectors used to digitize signals can be broken down into smaller frames that can be processed faster. The theorem “has potential to affect some important engineering problems,” Casazza said.

Just so you know, the same people who are saying it will be years before practical results emerge from this breakthrough are the same ones who assumed the answer to this problem was negative. 😉

I’m not saying techniques based on this work will be in JavaScript libraries next year but without trying, they never will be.

Enjoy!

I first saw this in a post by Lars Marius Garshol

November 22, 2015

Why you should understand (a little) about TCP

Filed under: Cybersecurity,Networks,Systems Administration — Patrick Durusau @ 2:26 pm

Why you should understand (a little) about TCP by Julia Evans.

From the post:

This isn’t about understanding everything about TCP or reading through TCP/IP Illustrated. It’s about how a little bit of TCP knowledge is essential. Here’s why.

When I was at the Recurse Center, I wrote a TCP stack in Python (and wrote about what happens if you write a TCP stack in Python). This was a fun learning experience, and I thought that was all.

A year later, at work, someone mentioned on Slack “hey I’m publishing messages to NSQ and it’s taking 40ms each time”. I’d already been thinking about this problem on and off for a week, and hadn’t gotten anywhere.

A little background: NSQ is a queue that you send to messages to. The way you publish a message is to make an HTTP request on localhost. It really should not take 40 milliseconds to send a HTTP request to localhost. Something was terribly wrong. The NSQ daemon wasn’t under high CPU load, it wasn’t using a lot of memory, it didn’t seem to be a garbage collection pause. Help.

Then I remembered an article I’d read a week before called In search of performance – how we shaved 200ms off every POST request. In that article, they talk about why every one of target=”_blank” their POST requests were taking 200 extra milliseconds. That’s.. weird. Here’s the key paragraph from the post

Julia’s posts are generally useful and entertaining to read and this one is no exception.

As Julia demonstrates in this post, TCP isn’t as low-level as you might think. 😉

The other lesson to draw here is the greater your general knowledge of how things work, the more likely you can fix (or cause) problems with a minimal amount of effort.

Learn a little TCP with Julia and keep bookmarked deeper resources should the need arise.

October 27, 2015

A Certain Tendency Of The Database Community

Filed under: Consistency,Database,Networks — Patrick Durusau @ 7:16 pm

A Certain Tendency Of The Database Community by Christopher Meiklejohn.

From the post:

Abstract

We posit that striving for distributed systems that provide “single system image” semantics is fundamentally flawed and at odds with how systems operate in the physical world. We realize the database as an optimization of this system: a required, essential optimization in practice that facilitates central data placement and ease of access to participants in a system. We motivate a new model of computation that is designed to address the problems of computation over “eventually consistent” information in a large-scale distributed system.

Eventual Consistency

When we think about the world we live in, we do not usually say it is eventually consistent, for this is a term usually applied to computing systems, made up of multiple machines, that have to operate with shared information.

Eventual consistency is a consistency model for replicated, shared state. A consistency model is a contract between an application developer and a system that application will run on. A contract between a developer and a system states the following: given the developer follows the rules defined by the system, certain outcomes from the system are guaranteed. This makes it possible for developers to build successful applications, for without this contract, applications would have no guarantee that the actions they perform would have a correct outcome.

(italics in original)

A very accessible and great read on “eventual consistency.”

Christopher points out that any “state” of knowledge is a snapshot under a given set of constraints:

For instance, if the leading researchers on breast cancer were to document the state-of-the-art in a book, as the document is being written it would no longer reflect the state-of-the-art. The collective knowledge of this group is always changing, and as long as we continue to rewrite the document it will only be approaching the combined knowledge of the group. We can think of this somewhat formally: if we had a way to view the group’s knowledge as a omniscient observer and we represent that knowledge as a linear function, the recorded text would be asymptotic to function of the sum of global knowledge.

He concludes with this question:

…Can we build computational abstractions that allow devices to communicate peer-to-peer, acknowledging the true source of truth for a particular piece of information and scale to the amount of information that exists, not only between all computers in a planetary-scale distributed system, but all entities in the universe[?]

I’m not sure about “all entities in the universe,” or even a “planetary-scale distributed system,” but we do know that Netware Directory Services (NDS) (now eDirectory) was a replicated, distributed, sharded database with eventual convergence that was written in 1993.

We have had the computational abstractions for a replicated, distributed, sharded database with eventual convergence for a number of years.

I would adjust Christopher’s “true source of truth,” for “source of truth as defined by users,” to avoid the one-world-truth position that crippled the Semantic Web even before FOL and RDF syntax arrived.

August 30, 2015

Network motif discovery: A GPU approach [subgraph isomorphism and topics]

Filed under: GPU,Graphs,Networks — Patrick Durusau @ 4:13 pm

Network motif discovery: A GPU approach by Wenqing Lin ; Xiaokui Xiao ; Xing Xie ; Xiao-Li Li.

Abstract:

The identification of network motifs has important applications in numerous domains, such as pattern detection in biological networks and graph analysis in digital circuits. However, mining network motifs is computationally challenging, as it requires enumerating subgraphs from a real-life graph, and computing the frequency of each subgraph in a large number of random graphs. In particular, existing solutions often require days to derive network motifs from biological networks with only a few thousand vertices. To address this problem, this paper presents a novel study on network motif discovery using Graphical Processing Units (GPUs). The basic idea is to employ GPUs to parallelize a large number of subgraph matching tasks in computing subgraph frequencies from random graphs, so as to reduce the overall computation time of network motif discovery. We explore the design space of GPU-based subgraph matching algorithms, with careful analysis of several crucial factors that affect the performance of GPU programs. Based on our analysis, we develop a GPU-based solution that (i) considerably differs from existing CPU-based methods, and (ii) exploits the strengths of GPUs in terms of parallelism while mitigating their limitations in terms of the computation power per GPU core. With extensive experiments on a variety of biological networks, we show that our solution is up to two orders of magnitude faster than the best CPU-based approach, and is around 20 times more cost-effective than the latter, when taking into account the monetary costs of the CPU and GPUs used.

For those of you who need to dodge the paywall: Network motif discovery: A GPU approach

From the introduction (topic map comments interspersed):

Given a graph $$G$$, a network motif in $$G$$ is a subgraph $$g$$ of $$G$$, such that $$g$$ appears much more frequently in $$G$$ than in random graphs whose degree distributions are similar to that of $$G$$ [1]. The identification of network motifs finds important applications in numerous domains. For example, network motifs are used (i) in system biology to predict protein interactions in biological networks and discover functional sub-units [2], (ii) in electronic engineering to understand the characteristics of circuits [3], and (iii) in brain science to study the functionalities of brain networks [4].

Unlike a topic map considered as graph $$G$$, the network motif problem is to discover subgraphs of $$G$$. In a topic map, the subgraph constituting a topic and its defined isomophism with other topics, is declarable.

…Roughly speaking, all existing techniques adopt a common two-phase framework as follows:

Subgraph Enumeration: Given a graph $$G$$ and a parameter $$k$$, enumerate the subgraphs $$g$$ of $$G$$ with $$k$$ vertices each;

Frequency Estimation:

Rather than enumerating subgraph $$g$$ of $$G$$ (a topic map), we need only collect those subgraphs for the isomorphism test.

…To compute the frequency of $$g$$ in a random graph $$G’$$, however, we need to derive the number of subgraphs of $$G$$ that are isomorphic to $$g$$ – this requires a large number of subgraph isomorphism tests [14], which are known to be computationally expensive.

Footnote 14 is a reference to: Practical graph isomorphism, II by Brendan D. McKay, Adolfo Piperno.

See also: nauty and Traces by Brendan McKay and Adolfo Piperno.

nauty and Traces are programs for computing automorphism groups of graphs and digraphs [*]. They can also produce a canonical label. They are written in a portable subset of C, and run on a considerable number of different systems.

This is where topic map subgraph $$g$$ isomorphism issue intersects with the more general subgraph isomorphism case.

Any topic can have properties (nee internal occurrences) in addition to those thought to make it “isomorphic” to another topic. Or play roles in associations that are not played by other topics representing the same subject.

Motivated by the deficiency of existing work, we present an in-depth study on efficient solutions for network motif discovery. Instead of focusing on the efficiency of individual subgraph isomorphism tests, we propose to utilize Graphics Processing Units (GPUs) to parallelize a large number of isomorphism tests, in order to reduce the computation time of the frequency estimation phase. This idea is intuitive, and yet, it presents a research challenge since there is no existing algorithm for testing subgraph isomorphisms on GPUs. Furthermore, as shown in Section III, existing CPU-based algorithms for subgraph isomorphism tests cannot be translated into efficient solutions on GPUs, as the characteristics of GPUs make them inherently unsuitable for several key procedures used in CPU-based algorithms.

The punch line is that the authors present a solution that:

…is up to two orders of magnitude faster than the best CPU-based approach, and is around 20 times more cost-effective than the latter, when taking into account the monetary costs of the CPU and GPUs used.

Since topic isomophism is defined as opposed to discovered, this looks like a fruitful avenue to explore for topic map engine performance.

May 14, 2015

Dynamical Systems on Networks: A Tutorial

Filed under: Dynamic Graphs,Dynamic Updating,Networks,Topic Maps — Patrick Durusau @ 2:55 pm

Dynamical Systems on Networks: A Tutorial by Mason A. Porter and James P. Gleeson.

Abstract:

We give a tutorial for the study of dynamical systems on networks. We focus especially on “simple” situations that are tractable analytically, because they can be very insightful and provide useful springboards for the study of more complicated scenarios. We briefly motivate why examining dynamical systems on networks is interesting and important, and we then give several fascinating examples and discuss some theoretical results. We also briefly discuss dynamical systems on dynamical (i.e., time-dependent) networks, overview software implementations, and give an outlook on the field.

At thirty-nine (39) pages and two hundred and sixty-three references, the authors leave the reader with an overview of the field and the tools to go further.

I am intrigued by the closer by the authors:


Finally, many networks are multiplex (i.e., include multiple types of edges) or have other multilayer features [16, 136]. The existence of multiple layers over which dynamics can occur and the possibility of both structural and dynamical correlations between layers offers another rich set of opportunities to study dynamical systems on networks. The investigation of dynamical systems on multilayer networks is only in its infancy, and this area is also loaded with a rich set of problems [16, 136, 144, 205].

Topic maps can have multiple type of edges and multiple layers.

For further reading on those topics see:

The structure and dynamics of multilayer networks by S. Boccaletti, G. Bianconi, R. Criado, C.I. del Genio, J. Gómez-Gardeñes, M. Romance, I. Sendiña-Nadal, Z. Wang, M. Zanin.

Abstract:

In the past years, network theory has successfully characterized the interaction among the constituents of a variety of complex systems, ranging from biological to technological, and social systems. However, up until recently, attention was almost exclusively given to networks in which all components were treated on equivalent footing, while neglecting all the extra information about the temporal- or context-related properties of the interactions under study. Only in the last years, taking advantage of the enhanced resolution in real data sets, network scientists have directed their interest to the multiplex character of real-world systems, and explicitly considered the time-varying and multilayer nature of networks. We offer here a comprehensive review on both structural and dynamical organization of graphs made of diverse relationships (layers) between its constituents, and cover several relevant issues, from a full redefinition of the basic structural measures, to understanding how the multilayer nature of the network affects processes and dynamics.

Multilayer Networks by Mikko Kivelä, Alexandre Arenas, Marc Barthelemy, James P. Gleeson, Yamir Moreno, Mason A. Porter.

Abstract:

In most natural and engineered systems, a set of entities interact with each other in complicated patterns that can encompass multiple types of relationships, change in time, and include other types of complications. Such systems include multiple subsystems and layers of connectivity, and it is important to take such “multilayer” features into account to try to improve our understanding of complex systems. Consequently, it is necessary to generalize “traditional” network theory by developing (and validating) a framework and associated tools to study multilayer systems in a comprehensive fashion. The origins of such efforts date back several decades and arose in multiple disciplines, and now the study of multilayer networks has become one of the most important directions in network science. In this paper, we discuss the history of multilayer networks (and related concepts) and review the exploding body of work on such networks. To unify the disparate terminology in the large body of recent work, we discuss a general framework for multilayer networks, construct a dictionary of terminology to relate the numerous existing concepts to each other, and provide a thorough discussion that compares, contrasts, and translates between related notions such as multilayer networks, multiplex networks, interdependent networks, networks of networks, and many others. We also survey and discuss existing data sets that can be represented as multilayer networks. We review attempts to generalize single-layer-network diagnostics to multilayer networks. We also discuss the rapidly expanding research on multilayer-network models and notions like community structure, connected components, tensor decompositions, and various types of dynamical processes on multilayer networks. We conclude with a summary and an outlook.

This may have been where we collectively went wrong in marketing topic maps. Yes, yes it is true that topic maps could do multilayer networks but network theory has made $billions with an overly simplistic model that bears little resemblance to reality.

As computation resources improve and closer to reality models, at least somewhat closer, become popular, something between simplistic networks and the full generality of topic maps could be successful.

April 16, 2015

Hunting Changes in Complex Networks (Changes in Networks)

Filed under: Astroinformatics,Graphs,Networks — Patrick Durusau @ 6:54 pm

While writing the Methods for visualizing dynamic networks post, I remembered a technique that the authors didn’t discuss.

What if only one node in a complex network was different? That is all of the other nodes and edges remained fixed while one node and it edges changed? How easy would that be to visualize?

If that sounds like an odd use case, it’s not. In fact, the discovery of Pluto in the 1930’s was made using a blink comparator exactly for that purpose.

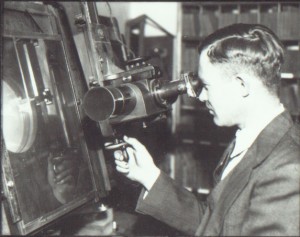
blink

This is Cyrus Tombaugh using a blink comparator which shows the viewer two images, quickly alternating between them. The images are of the same parts of the night sky and anything that has changed with be quickly noticed by the human eye.

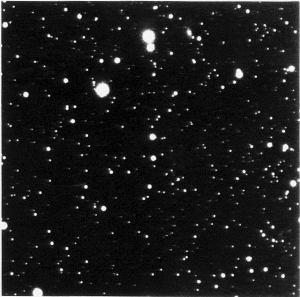
plutodisc_noarrows

Select the star field image to get a larger view and the gif will animate as though seen through a blink comparator. Do you see Pluto? (These are images of the original discovery plates.)

If not, see these http://upload.wikimedia.org/wikipedia/en/c/c6/Pluto_discovery_plates.pngplates with Pluto marked by a large arrow in each one.

This wonderful material on Pluto came from: Beyond the Planets – the discovery of Pluto

All of that was to interest you in reading: GrepNova: A tool for amateur supernova hunting by Frank Dominic.

From the article:

This paper presents GrepNova, a software package which assists amateur supernova hunters by allowing new observations of galaxies to be compared against historical library images in a highly automated fashion. As each new observation is imported, GrepNova automatically identifies a suitable comparison image and rotates it into a common orientation with the new image. The pair can then be blinked on the computer’s display to allow a rapid visual search to be made for stars in outburst. GrepNova has been in use by Tom Boles at his observatory in Coddenham, Suffolk since 2005 August, where it has assisted in the discovery of 50 supernovae up to 2011 October.

That’s right, these folks are searching for supernovas in other galaxies, each of which consists of millions of stars, far denser than most contact networks.

The download information for GrepNova has changed since the article was published: https://in-the-sky.org/software.php.

I don’t have any phone metadata to try the experiment on but with a graph of contacts, the usual contacts will simply be background and new contacts will jump off the screen at you.

A great illustration of why prior searching techniques remain relevant to modern “information busy” visualizations.

Methods for visualizing dynamic networks (Parts 1 and 2)

Filed under: Dynamic Graphs,Networks,Visualization — Patrick Durusau @ 6:16 pm

Methods for visualizing dynamic networks Part 1

Methods for visualizing dynamic networks Part 2

From part 1:

The challenge of visualizing the evolution of connected data through time has kept academics and data scientists busy for years. Finding a way to convey the added complexity of a temporal element without overwhelming the end user with it is not easy.

Whilst building the KeyLines Time Bar – our component for visualizing dynamic networks – we spent a great deal of time appraising the existing temporal visualization options available.

In this blog post, we’ve collated some of the most popular ways of visualizing dynamic graphs through time. Next week, we’ll share some of the more creative and unusual options.

Not a comprehensive survey but eight (8) ways to visualize dynamic networks that you will find interesting.

Others that you would add to this list?

February 9, 2015

Newly Discovered Networks among Different Diseases…

Filed under: Bioinformatics,Medical Informatics,Networks — Patrick Durusau @ 4:32 pm

Newly Discovered Networks among Different Diseases Reveal Hidden Connections by Veronique Greenwood and Quanta Magazine.

From the post:

Stefan Thurner is a physicist, not a biologist. But not long ago, the Austrian national health insurance clearinghouse asked Thurner and his colleagues at the Medical University of Vienna to examine some data for them. The data, it turned out, were the anonymized medical claims records—every diagnosis made, every treatment given—of most of the nation, which numbers some 8 million people. The question was whether the same standard of care could continue if, as had recently happened in Greece, a third of the funding evaporated. But Thurner thought there were other, deeper questions that the data could answer as well.

In a recent paper in the New Journal of Physics, Thurner and his colleagues Peter Klimek and Anna Chmiel started by looking at the prevalence of 1,055 diseases in the overall population. They ran statistical analyses to uncover the risk of having two diseases together, identifying pairs of diseases for which the percentage of people who had both was higher than would be expected if the diseases were uncorrelated—in other words, a patient who had one disease was more likely than the average person to have the other. They applied statistical corrections to reduce the risk of drawing false connections between very rare and very common diseases, as any errors in diagnosis will get magnified in such an analysis. Finally, the team displayed their results as a network in which the diseases are nodes that connect to one another when they tend to occur together.

The style of analysis has uncovered some unexpected links. In another paper, published on the scientific preprint site arxiv.org, Thurner’s team confirmed a controversial connection between diabetes and Parkinson’s disease, as well as unique patterns in the timing of when diabetics develop high blood pressure. The paper in the New Journal of Physics generated additional connections that they hope to investigate further.

Every medical claim for almost eight (8) million people would make a very dense graph. Yes?

When you look at the original papers, notice that the researchers did not create a graph that held all their data. In the New Journal of Physics paper, only the diseases appear to demonstrate their clustering and the patients not at all. In the archiv.org paper, another means is used to demonstrate the risk of specific diseases and the two types (DM1, DM2) of diabetes.

I think the lesson here is that despite being “network” data, that isn’t determinative for presentation or analysis of data.

February 4, 2015

Graph-Tool – Update!

Filed under: Graphs,Networks — Patrick Durusau @ 8:35 pm

Graph-Tool – Update!

From the webpage:

Graph-tool is an efficient Python module for manipulation and statistical analysis of graphs (a.k.a. networks). Contrary to most other python modules with similar functionality, the core data structures and algorithms are implemented in C++, making extensive use of template metaprogramming, based heavily on the Boost Graph Library. This confers it a level of performance that is comparable (both in memory usage and computation time) to that of a pure C/C++ library.

A new version of graph-tool is available for downloading!

A graph based analysis of the 2016 U.S. Budget is going to require all the speed you can muster!

Enjoy!

December 7, 2014

Stellar Navigation Using Network Analysis

Filed under: Astroinformatics,Graphs,Networks — Patrick Durusau @ 3:14 pm

Stellar Navigation Using Network Analysis by Caleb Jones.

To give you an idea of where this post ends up:

From the post:

This has been the funnest and most challenging network analysis and visualization I have done to date. As I've mentioned before, I am a huge space fan. One of my early childhood fantasies was the idea of flying instantly throughout the universe exploring all the different planets, stars, nebulae, black holes, galaxies, etc. The idea of a (possibly) infinite universe with inexhaustible discoveries to be made has kept my interest and fascination my whole life. I identify with the sentiment expressed by Carl Sagan in his book Pale Blue Dot:

In the last ten thousand years, an instant in our long history, we’ve abandoned the nomadic life. For all its material advantages, the sedentary life has left us edgy, unfulfilled. The open road still softly calls like a nearly forgotten song of childhood. Your own life, or your band’s, or even your species’ might be owed to a restless few—drawn, by a craving they can hardly articulate or understand, to undiscovered lands and new worlds.

Herman Melville, in Moby Dick, spoke for wanderers in all epochs and meridians: “I am tormented with an everlasting itch for things remote. I love to sail forbidden seas…”

Maybe it’s a little early. Maybe the time is not quite yet. But those other worlds— promising untold opportunities—beckon.

Silently, they orbit the Sun, waiting.

Fair warning: If you aren’t already a space enthusiast, this project may well turn you into one!

Distance and relative location are only two (2) facts that are known for stars within eight (8) light-years. What other facts or resources would you connect to the stars in these networks?

September 8, 2014

Visualizing Website Pathing With Network Graphs

Filed under: Graphs,Networks,R,Visualization — Patrick Durusau @ 6:54 pm

Visualizing Website Pathing With Network Graphs by Randy Zwitch.

From the post:

Last week, version 1.4 of RSiteCatalyst was released, and now it’s possible to get site pathing information directly within R. Now, it’s easy to create impressive looking network graphs from your Adobe Analytics data using RSiteCatalyst and d3Network. In this blog post, I will cover simple and force-directed network graphs, which show the pairwise representation between pages. In a follow-up blog post, I will show how to visualize longer paths using Sankey diagrams, also from the d3Network package.

Great technical details and examples but also worth the read for:

I’m not going to lie, all three of these diagrams are hard to interpret. Like wordclouds, network graphs can often be visually interesting, yet difficult to ascertain any concrete information. Network graphs also have the tendency to reinforce what you already know (you or someone you know designed your website, you should already have a feel for its structure!).

Randy does spot some patterns but working out what those patterns “mean” remain for further investigation.

Hairball graph visualizations can be a starting point for the hard work that extracts actionable intelligence.

July 26, 2014

Stanford Large Network Dataset Collection

Filed under: Data,Graphs,Networks — Patrick Durusau @ 8:27 pm

Stanford Large Network Dataset Collection by Jure Leskovec.

From the webpage:

SNAP networks are also availalbe from UF Sparse Matrix collection. Visualizations of SNAP networks by Tim Davis.

If you need software to go with these datasets, consider Stanford Network Analysis Platform (SNAP)

Stanford Network Analysis Platform (SNAP) is a general purpose, high performance system for analysis and manipulation of large networks. Graphs consists of nodes and directed/undirected/multiple edges between the graph nodes. Networks are graphs with data on nodes and/or edges of the network.

The core SNAP library is written in C++ and optimized for maximum performance and compact graph representation. It easily scales to massive networks with hundreds of millions of nodes, and billions of edges. It efficiently manipulates large graphs, calculates structural properties, generates regular and random graphs, and supports attributes on nodes and edges. Besides scalability to large graphs, an additional strength of SNAP is that nodes, edges and attributes in a graph or a network can be changed dynamically during the computation.

A Python interface is available for SNAP.

I first saw this at: Stanford Releases Large Network Datasets by Ryan Swanstrom.

June 11, 2014

Network Data (And Merging Graphs)

Filed under: Data,Graphs,Networks — Patrick Durusau @ 7:20 pm

Network Data by Mark Newman.

From the webpage:

This page contains links to some network data sets I’ve compiled over the years. All of these are free for scientific use to the best of my knowledge, meaning that the original authors have already made the data freely available, or that I have consulted the authors and received permission to the post the data here, or that the data are mine. If you make use of any of these data, please cite the original sources.

The data sets are in GML format. For a description of GML see here. GML can be read by many network analysis packages, including Gephi and Cytoscape. I’ve written a simple parser in C that will read the files into a data structure. It’s available here. There are many features of GML not supported by this parser, but it will read the files in this repository just fine. There is a Python parser for GML available as part of the NetworkX package here and another in the igraph package, which can be used from C, Python, or R. If you know of or develop other software (Java, C++, Perl, R, Matlab, etc.) that reads GML, let me know.

I count sixteen (16) data sets and seven (7) collections of data sets.

Reminded me of a tweet I saw today:

Glimpse Conference

It’s used to be the social graph, then the interest-graph. Now, w/ social shopping it’s all about the taste graph. (emphasis added)

That’s three very common graphs and we all belong to networks or have interests that could be represented as still others.

After all the labor that goes into the composition of a graph, Mr. Normalization Graph would say we have to re-normalize these graphs to use them together.

That sounds like a bad plan. To me, reduplicating work that has already been done is always a bad plan.

If we could merge nodes and edges of two or more graphs together, then we can leverage the prior work on both graphs.

Not to mention that after merging, the unified graph could be searched, visualized and explored with less capable graph software and techniques.

Something to keep in mind.

I first saw this in a tweet by Steven Strogatz.

June 5, 2014

Community detection in networks:…

Filed under: Clustering,Networks,Topology — Patrick Durusau @ 7:17 pm

Community detection in networks: structural clusters versus ground truth by Darko Hric, Richard K. Darst, and, Santo Fortunato.

Abstract:

Algorithms to find communities in networks rely just on structural information and search for cohesive subsets of nodes. On the other hand, most scholars implicitly or explicitly assume that structural communities represent groups of nodes with similar (non-topological) properties or functions. This hypothesis could not be verified, so far, because of the lack of network datasets with ground truth information on the classification of the nodes. We show that traditional community detection methods fail to find the ground truth clusters in many large networks. Our results show that there is a marked separation between structural and annotated clusters, in line with recent findings. That means that either our current modeling of community structure has to be substantially modified, or that annotated clusters may not be recoverable from topology alone.

Deeply interesting work if you are trying to detect “subjects” by clustering nodes in a network.

I would heed the warning that typology may not accurately represent hidden information.

Beyond this particular case, I would test any assumption that some known factor represents an unknown factor(s) for any data set. Better than the results surprise you than your client.

I first saw this in a tweet by Brian Keegan.

PS: As you already know, “ground truth” depends upon your point of view. Don’t risk your work on the basis of someone else’s “ground truth.”

May 20, 2014

Community Detection in Graphs — a Casual Tour

Filed under: Graphs,Networks,Social Networks — Patrick Durusau @ 4:43 pm

Community Detection in Graphs — a Casual Tour by Jeremy Kun.

From the post:

Graphs are among the most interesting and useful objects in mathematics. Any situation or idea that can be described by objects with connections is a graph, and one of the most prominent examples of a real-world graph that one can come up with is a social network.

Recall, if you aren’t already familiar with this blog’s gentle introduction to graphs, that a graph G is defined by a set of vertices V, and a set of edges E, each of which connects two vertices. For this post the edges will be undirected, meaning connections between vertices are symmetric.

One of the most common topics to talk about for graphs is the notion of a community. But what does one actually mean by that word? It’s easy to give an informal definition: a subset of vertices C such that there are many more edges between vertices in C than from vertices in C to vertices in V - C (the complement of C). Try to make this notion precise, however, and you open a door to a world of difficult problems and open research questions. Indeed, nobody has yet come to a conclusive and useful definition of what it means to be a community. In this post we’ll see why this is such a hard problem, and we’ll see that it mostly has to do with the word “useful.” In future posts we plan to cover some techniques that have found widespread success in practice, but this post is intended to impress upon the reader how difficult the problem is.

Thinking that for some purposes, communities of nodes could well be a subject in a topic map. But we would have to be able to find them. And Jeremy says that’s a hard problem.

Looking forward to more posts on communities in graphs from Jeremy.

Older Posts »

Powered by WordPress