Another Word For It Patrick Durusau on Topic Maps and Semantic Diversity

February 2, 2018

PubMed Commons to be Discontinued

Filed under: Bioinformatics,Medical Informatics,PubMed,Social Media — Patrick Durusau @ 5:10 pm

PubMed Commons to be Discontinued

From the post:

PubMed Commons has been a valuable experiment in supporting discussion of published scientific literature. The service was first introduced as a pilot project in the fall of 2013 and was reviewed in 2015. Despite low levels of use at that time, NIH decided to extend the effort for another year or two in hopes that participation would increase. Unfortunately, usage has remained minimal, with comments submitted on only 6,000 of the 28 million articles indexed in PubMed.

While many worthwhile comments were made through the service during its 4 years of operation, NIH has decided that the low level of participation does not warrant continued investment in the project, particularly given the availability of other commenting venues.

Comments will still be available, see the post for details.

Good time for the reminder that even negative results from an experiment are valuable.

Even more so in this case because discussion/comment facilities are non-trivial components of a content delivery system. Time and resources not spent on comment facilities could be put in other directions.

Where do discussions of medical articles take place and can they be used to automatically annotate published articles?

February 16, 2017

Can You Replicate Your Searches?

Filed under: Bioinformatics,Biomedical,Medical Informatics,Search Engines,Searching — Patrick Durusau @ 4:30 pm

A comment at PubMed raises the question of replicating reported literature searches:

From the comment:

Mellisa Rethlefsen

I thank the authors of this Cochrane review for providing their search strategies in the document Appendix. Upon trying to reproduce the Ovid MEDLINE search strategy, we came across several errors. It is unclear whether these are transcription errors or represent actual errors in the performed search strategy, though likely the former.

For instance, in line 39, the search is “tumour bed boost.sh.kw.ti.ab” [quotes not in original]. The correct syntax would be “tumour bed boost.sh,kw,ti,ab” [no quotes]. The same is true for line 41, where the commas are replaced with periods.

In line 42, the search is “Breast Neoplasms /rt.sh” [quotes not in original]. It is not entirely clear what the authors meant here, but likely they meant to search the MeSH heading Breast Neoplasms with the subheading radiotherapy. If that is the case, the search should have been “Breast Neoplasms/rt” [no quotes].

In lines 43 and 44, it appears as though the authors were trying to search for the MeSH term “Radiotherapy, Conformal” with two different subheadings, which they spell out and end with a subject heading field search (i.e., Radiotherapy, Conformal/adverse events.sh). In Ovid syntax, however, the correct search syntax would be “Radiotherapy, Conformal/ae” [no quotes] without the subheading spelled out and without the extraneous .sh.

In line 47, there is another minor error, again with .sh being extraneously added to the search term “Radiotherapy/” [quotes not in original].

Though these errors are minor and are highly likely to be transcription errors, when attempting to replicate this search, each of these lines produces an error in Ovid. If a searcher is unaware of how to fix these problems, the search becomes unreplicable. Because the search could not have been completed as published, it is unlikely this was actually how the search was performed; however, it is a good case study to examine how even small details matter greatly for reproducibility in search strategies.

A great reminder that replication of searches is a non-trivial task and that search engines are literal to the point of idiocy.

February 19, 2016

OMOP Common Data Model V5.0

Filed under: Data Models,Medical Informatics,Modeling — Patrick Durusau @ 9:02 pm

OMOP Common Data Model V5.0

From the webpage:

The Observational Medical Outcomes Partnership (OMOP) was a public-private partnership established to inform the appropriate use of observational healthcare databases for studying the effects of medical products. Over the course of the 5-year project and through its community of researchers from industry, government, and academia, OMOP successfully achieved its aims to:

  1. Conduct methodological research to empirically evaluate the performance of various analytical methods on their ability to identify true associations and avoid false findings
  2. Develop tools and capabilities for transforming, characterizing, and analyzing disparate data sources across the health care delivery spectrum, and
  3. Establish a shared resource so that the broader research community can collaboratively advance the science.

The results of OMOP's research has been widely published and presented at scientific conferences, including annual symposia.

The OMOP Legacy continues…

The community is actively using the OMOP Common Data Model for their various research purposes. Those tools will continue to be maintained and supported, and information about this work is available in the public domain.

The OMOP Research Lab, a central computing resource developed to facilitate methodological research, has been transitioned to the Reagan-Udall Foundation for the FDA under the Innovation in Medical Evidence Development and Surveillance (IMEDS) Program, and has been re-branded as the IMEDS Lab. Learn more at imeds.reaganudall.org.

Observational Health Data Sciences and Informatics (OHDSI) has been established as a multi-stakeholder, interdisciplinary collaborative to create open-source solutions that bring out the value of observational health data through large-scale analytics. The OHDSI collaborative includes all of the original OMOP research investigators, and will develop its tools using the OMOP Common Data Model. Learn more at ohdsi.org.

The OMOP Common Data Model will continue to be an open-source, community standard for observational healthcare data. The model specifications and associated work products will be placed in the public domain, and the entire research community is encouraged to use these tools to support everybody's own research activities.

One of the many data models that will no doubt be in play as work begins on searching for a common cancer research language.

Every data model has a constituency, the trick is to find two or more where cross-mapping has semantic and hopefully financial ROI.

I first saw this in a tweet by Christophe Lalanne.

February 11, 2016

Tackling Zika

Filed under: Bioinformatics,Medical Informatics,Open Access,Open Data — Patrick Durusau @ 1:43 pm

F1000Research launches rapid, open, publishing channel to help scientists tackle Zika

From the post:

ZAO provides a platform for scientists and clinicians to publish their findings and source data on Zika and its mosquito vectors within days of submission, so that research, medical and government personnel can keep abreast of the rapidly evolving outbreak.

The channel provides diamond-access: it is free to access and articles are published free of charge. It also accepts articles on other arboviruses such as Dengue and Yellow Fever.

The need for the channel is clearly evidenced by a recent report on the global response to the Ebola virus by the Harvard-LSHTM (London School of Hygiene & Tropical Medicine) Independent Panel.

The report listed ‘Research: production and sharing of data, knowledge, and technology’ among its 10 recommendations, saying: “Rapid knowledge production and dissemination are essential for outbreak prevention and response, but reliable systems for sharing epidemiological, genomic, and clinical data were not established during the Ebola outbreak.”

Dr Megan Coffee, an infectious disease clinician at the International Rescue Committee in New York, said: “What’s published six months, or maybe a year or two later, won’t help you – or your patients – now. If you’re working on an outbreak, as a clinician, you want to know what you can know – now. It won’t be perfect, but working in an information void is even worse. So, having a way to get information and address new questions rapidly is key to responding to novel diseases.”

Dr. Coffee is also a co-author of an article published in the channel today, calling for rapid mobilisation and adoption of open practices in an important strand of the Zika response: drug discovery – http://f1000research.com/articles/5-150/v1.

Sean Ekins, of Collaborative Drug Discovery, and lead author of the article, which is titled ‘Open drug discovery for the Zika virus’, said: “We think that we would see rapid progress if there was some call for an open effort to develop drugs for Zika. This would motivate members of the scientific community to rally around, and centralise open resources and ideas.”

Another co-author, of the article, Lucio Freitas-Junior of the Brazilian Biosciences National Laboratory, added: “It is important to have research groups working together and sharing data, so that scarce resources are not wasted in duplication. This should always be the case for neglected diseases research, and even more so in the case of Zika.”

Rebecca Lawrence, Managing Director, F1000, said: “One of the key conclusions of the recent Harvard-LSHTM report into the global response to Ebola was that rapid, open data sharing is essential in disease outbreaks of this kind and sadly it did not happen in the case of Ebola.

“As the world faces its next health crisis in the form of the Zika virus, F1000Research has acted swiftly to create a free, dedicated channel in which scientists from across the globe can share new research and clinical data, quickly and openly. We believe that it will play a valuable role in helping to tackle this health crisis.”

###

For more information:

Andrew Baud, Tala (on behalf of F1000), +44 (0) 20 3397 3383 or +44 (0) 7775 715775

Excellent news for researchers but a direct link to the new channel would have been helpful as well: Zika & Arbovirus Outbreaks (ZAO).

See this post: The Zika & Arbovirus Outbreaks channel on F1000Research by Thomas Ingraham.

News organizations should note that as of today, 11 February 2016, ZAO offers 9 articles, 16 posters and 1 set of slides. Those numbers are likely to increase rapidly.

Oh, did I mention the ZAO channel is free?

Unlike some journals, payment, prestige, privilege, are not pre-requisites for publication.

Useful research on Zika & Arboviruses is the only requirement.

I know, sounds like a dangerous precedent but defeating a disease like Zika will require taking risks.

February 8, 2016

Data from the World Health Organization API

Filed under: Medical Informatics,R,Visualization — Patrick Durusau @ 11:28 am

Data from the World Health Organization API by Peter’s stats stuff – R.

From the post:

Eric Persson released yesterday a new WHO R package which allows easy access to the World Health Organization’s data API. He’s also done a nice vignette introducing its use.

I had a play and found it was easy access to some interesting data. Some time down the track I might do a comparison of this with other sources, the most obvious being the World Bank’s World Development Indicators, to identify relative advantages – there’s a lot of duplication of course. It’s a nice problem to have, too much data that’s too easy to get hold of. I wish we’d had that problem when I studied aid and development last century – I vividly remember re-keying numbers from almanac-like hard copy publications, and pleased we were to have them too!

Here’s a plot showing country-level relationships between the latest data of three indicators – access to contraception, adolescent fertility, and infant mortality – that help track the Millennium Development Goals.

With visualizations and R code!

A nice way to start off your data mining week!

Enjoy!

I first saw this in a tweet by Christophe Lalanne.

January 28, 2016

New Nvidia Resources – Data Science Bowl [Topology and Aligning Heart Images?]

Filed under: GPU,Medical Informatics,NVIDIA — Patrick Durusau @ 5:22 pm

New Resources Available to Help Participants by Pauline Essalou.

From the post:

Hungry for more help? NVIDIA can feed your passion and fuel your progress.

The free course includes lecture recordings and hands-on exercises. You’ll learn how to design, train, and integrate neural network-powered artificial intelligence into your applications using widely-used open source frameworks and NVIDIA software.

Visit NVIDIA at: https://developer.nvidia.com/deep-learning-courses

For access to the hands-on labs for free, you’ll need to register, using the promo code KAGGLE, at: https://developer.nvidia.com/qwiklabs-signup

With weeks to go until the March 7 stage one deadline and stage two data release deadline, there’s still plenty of time for participants to take advantage of these tools and continue to submit solutions. Visit the Data Science Bowl Resources page for a complete listing of free resources.

If you aren’t already competing, the challenge in brief:

Declining cardiac function is a key indicator of heart disease. Doctors determine cardiac function by measuring end-systolic and end-diastolic volumes (i.e., the size of one chamber of the heart at the beginning and middle of each heartbeat), which are then used to derive the ejection fraction (EF). EF is the percentage of blood ejected from the left ventricle with each heartbeat. Both the volumes and the ejection fraction are predictive of heart disease. While a number of technologies can measure volumes or EF, Magnetic Resonance Imaging (MRI) is considered the gold standard test to accurately assess the heart’s squeezing ability.

The challenge with using MRI to measure cardiac volumes and derive ejection fraction, however, is that the process is manual and slow. A skilled cardiologist must analyze MRI scans to determine EF. The process can take up to 20 minutes to complete—time the cardiologist could be spending with his or her patients. Making this measurement process more efficient will enhance doctors’ ability to diagnose heart conditions early, and carries broad implications for advancing the science of heart disease treatment.

The 2015 Data Science Bowl challenges you to create an algorithm to automatically measure end-systolic and end-diastolic volumes in cardiac MRIs. You will examine MRI images from more than 1,000 patients. This data set was compiled by the National Institutes of Health and Children’s National Medical Center and is an order of magnitude larger than any cardiac MRI data set released previously. With it comes the opportunity for the data science community to take action to transform how we diagnose heart disease.

This is not an easy task, but together we can push the limits of what’s possible. We can give people the opportunity to spend more time with the ones they love, for longer than ever before. (From: https://www.kaggle.com/c/second-annual-data-science-bowl)

Unlike the servant with the one talent, Nvidia isn’t burying its talent under a basket. It is spreading access to its information as far as possible, in contrast to editorial writers at the New England Journal of Medicine.

Care to guess who is going to have the greater impact on cardiology and medicine?

I forgot to mention that Nietzsche described the editorial page writers of the New England Journal of Medicine quite well when he said, “…they tell the proper time and make a modest noise when doing so….” (Of Scholars).

I first saw this in a tweet by Kirk D. Borne.

PS: Kirk pointed to Image Preprocessing: The Challenges and Approach by Peter VanMaasdam today.

Are you surprised that the data is dirty? 😉

I’m not a professional mathematicians but what if you created a common topology for hearts and then treated the different measurements for each one as dimensions?

I say that having recently read: Quantum algorithms for topological and geometric analysis of data by Seth Lloyd, Silvano Garnerone & Paolo Zanardi. Nature Communications 7, Article number: 10138 doi:10.1038/ncomms10138, Published 25 January 2016.

Whether you have a quantum computer or not, given the small size of the heart data set, some of those methods might be applicable.

Unless my memory fails me, the entire GPU Gems series in online at Nvidia and has several chapters on topological methods.

Good luck!

November 10, 2015

The Gene Hackers [Chaos Remains King]

Filed under: Bioinformatics,Biology,Biomedical,Medical Informatics — Patrick Durusau @ 8:46 pm

The Gene Hackers by Michael Specter.

From the post:

It didn’t take Zhang or other scientists long to realize that, if nature could turn these molecules into the genetic equivalent of a global positioning system, so could we. Researchers soon learned how to create synthetic versions of the RNA guides and program them to deliver their cargo to virtually any cell. Once the enzyme locks onto the matching DNA sequence, it can cut and paste nucleotides with the precision we have come to expect from the search-and-replace function of a word processor. “This was a finding of mind-boggling importance,” Zhang told me. “And it set off a cascade of experiments that have transformed genetic research.”

With CRISPR, scientists can change, delete, and replace genes in any animal, including us. Working mostly with mice, researchers have already deployed the tool to correct the genetic errors responsible for sickle-cell anemia, muscular dystrophy, and the fundamental defect associated with cystic fibrosis. One group has replaced a mutation that causes cataracts; another has destroyed receptors that H.I.V. uses to infiltrate our immune system.

The potential impact of CRISPR on the biosphere is equally profound. Last year, by deleting all three copies of a single wheat gene, a team led by the Chinese geneticist Gao Caixia created a strain that is fully resistant to powdery mildew, one of the world’s most pervasive blights. In September, Japanese scientists used the technique to prolong the life of tomatoes by turning off genes that control how quickly they ripen. Agricultural researchers hope that such an approach to enhancing crops will prove far less controversial than using genetically modified organisms, a process that requires technicians to introduce foreign DNA into the genes of many of the foods we eat.

The technology has also made it possible to study complicated illnesses in an entirely new way. A few well-known disorders, such as Huntington’s disease and sickle-cell anemia, are caused by defects in a single gene. But most devastating illnesses, among them diabetes, autism, Alzheimer’s, and cancer, are almost always the result of a constantly shifting dynamic that can include hundreds of genes. The best way to understand those connections has been to test them in animal models, a process of trial and error that can take years. CRISPR promises to make that process easier, more accurate, and exponentially faster.

Deeply compelling read on the stellar career of Feng Zhang and his use of “clustered regularly interspaced short palindromic repeats” (CRISPR) for genetic engineering.

If you are up for the technical side, try PubMed on CRISPR at 2,306 “hits” as of today.

If not, continue with Michael’s article. You will get enough background to realize this is a very profound moment in the development of genetic engineering.

A profound moment that can be made all the more valuable by linking its results to the results (not articles or summaries of articles) of prior research.

Proposals for repackaging data in some yet-to-be-invented format are a non-starter from my perspective. That is more akin to the EU science/WPA projects than a realistic prospect for value-add.

Let’s start with the assumption that when held in electronic format, data has its native format as a given. Nothing we can change about that part of the problem of access.

Whether labbooks, databases, triple stores, etc.

That one assumption reduces worries about corrupting the original data and introduces a sense of “tinkering” with existing data interfaces. (Watch for a post tomorrow on the importance of “tinkering.”)

Hmmm, nodes anyone?

PS: I am not overly concerned about genetic “engineering.” My money is riding on chaos in genetics and environmental factors.

July 28, 2015

Big Data to Knowledge (Biomedical)

Filed under: Bioinformatics,Funding,Medical Informatics — Patrick Durusau @ 3:45 pm

Big Data to Knowledge (BD2K) Development of Software Tools and Methods for Biomedical Big Data in Targeted Areas of High Need (U01).

Dates:

Open Date (Earliest Submission Date) September 6, 2015

Letter of Intent Due Date(s) September 6, 2015

Application Due Date(s) October 6, 2015,

Scientific Merit Review February 2016

Advisory Council Review May 2016

Earliest Start Date July 2016

From the webpage:

The purpose of this BD2K Funding Opportunity Announcement (FOA) is to solicit development of software tools and methods in the three topic areas of Data Privacy, Data Repurposing, and Applying Metadata, all as part of the overall BD2K initiative. While this FOA is intended to foster new development, submissions consisting of significant adaptations of existing methods and software are also invited.

The instructions say to submit early so that corrections to your application can be suggested. (Take the advice.)

Topic maps, particularly with customized subject identity rules, are a nice fit to the detailed requirements you will find at the grant site.

Ping me if you are interested in discussing why you should include topic maps in your application.

July 8, 2015

PMID-PMCID-DOI Mappings (monthly update)

Filed under: Bioinformatics,Medical Informatics,PubMed — Patrick Durusau @ 2:22 pm

PMID-PMCID-DOI Mappings (monthly update)

Dario Taraborelli tweets:

All PMID-PMCID-DOI mappings known by @EuropePMC_news, refreshed monthly ftp://ftp.ebi.ac.uk/pub/databases/pmc/DOI/

The file lists at 150MB but be aware that it decompresses to 909MB+. Approximately 25.6 million lines.

In case you are unfamiliar with PMID/PMCID:

PMID and PMCID are not the same thing.

PMID is the unique identifier number used in PubMed. They are assigned to each article record when it enters the PubMed system, so an in press publication will not have one unless it is issued as an electronic pre-pub. The PMID# is always found at the end of a PubMed citation.

Example of PMID#: Diehl SJ. Incorporating health literacy into adult basic education: from life skills to life saving. N C Med J. 2007 Sep-Oct;68(5):336-9. Review. PubMed PMID: 18183754.

PMCID is the unique identifier number used in PubMed Central. People are usually looking for this number in order to comply with the NIH Public Access Regulations. We have a webpage that gathers information to guide compliance. You can find it here: http://guides.hsl.unc.edu/NIHPublicAccess (broken link) [updated link: https://publicaccess.nih.gov/policy.htm]

A PMCID# is assigned after an author manuscript is deposited into PubMed Central. Some journals will deposit for you. Is this your publication? What is the journal?

PMCID#s can be found at the bottom of an article citation in PubMed, but only for articles that have been deposited in PubMed Central.

Example of a PMCID#: Ishikawa H, Kiuchi T. Health literacy and health communication. Biopsychosoc Med. 2010 Nov 5;4:18. PubMed PMID: 21054840; PubMed Central PMCID: PMC2990724.

From: how do I find the PMID (is that the same as the PMCID?) for in press publications?

If I were converting this into a topic map, I would use the PMID, PMCID, and DOI entries as subject identifiers. (PMIDs and PMCIDs can be expressed as hrefs.)

June 28, 2015

Medical Sieve [Information Sieve]

Filed under: Bioinformatics,Data Science,Medical Informatics — Patrick Durusau @ 4:35 pm

Medical Sieve

An effort to capture anomalies from medical imaging, package those with other data, and deliver it for use by clinicians.

If you think of each medical image as represented a large amount of data, the underlying idea is to filter out all but the most relevant data, so that clinicians are not confronting an overload of information.

In network terms, rather than displaying all of the current connections to a network (the ever popular eye-candy view of connections), displaying only those connections that are different from all the rest.

The same technique could be usefully applied in a number of “big data” areas.

From the post:

Medical Sieve is an ambitious long-term exploratory grand challenge project to build a next generation cognitive assistant with advanced multimodal analytics, clinical knowledge and reasoning capabilities that is qualified to assist in clinical decision making in radiology and cardiology. It will exhibit a deep understanding of diseases and their interpretation in multiple modalities (X-ray, Ultrasound, CT, MRI, PET, Clinical text) covering various radiology and cardiology specialties. The project aims at producing a sieve that filters essential clinical and diagnostic imaging information to form anomaly-driven summaries and recommendations that tremendously reduce the viewing load of clinicians without negatively impacting diagnosis.

Statistics show that eye fatigue is a common problem with radiologists as they visually examine a large number of images per day. An emergency room radiologist may look at as many 200 cases a day, and some of these imaging studies, particulary lower body CT angiography can be as many as 3000 images per study. Due to the volume overload, and limited amount of clinical information available as part of imaging studies, diagnosis errors, particularly relating to conincidental diagnosis cases can occur. With radiologists also being a scarce resource in many countries, it will even more important to reduce the volume of data to be seen by clinicians particularly, when they have to be sent over low bandwidth teleradiology networks.

MedicalSieve is an image-guided informatics system that acts as a medical sieve filtering the essential clinical information physicians need to know about the patient for diagnosis and treatment planning. The system gathers clinical data about the patient from a variety of enterprise systems in hospitals including EMR, pharmacy, labs, ADT, and radiology/cardiology PACs systems using HL7 and DICOM adapters. It then uses sophisticated medical text and image processing, pattern recognition and machine learning techniques guided by advanced clinical knowledge to process clinical data about the patient to extract meaningful summaries indicating the anomalies. Finally, it creates advanced summaries of imaging studies capturing the salient anomalies detected in various viewpoints.

Medical Sieve is leading the way in diagnostic interpretation of medical imaging datasets guided by clinical knowledge with many first-time inventions including (a) the first fully automatic spatio-temporal coronary stenosis detection and localization from 2D X-ray angiography studies, (b) novel methods for highly accurate benign/malignant discrimination in breast imaging, and (c) first automated production of AHA guideline17 segment model for cardiac MRI diagnosis.

For more details on the project, please contact Tanveer Syeda-Mahmood (>stf@us.ibm.com).

You can watch a demo of our Medical Sieve Cognitive Assistant Application here.

Curious: How would you specify the exclusions of information? So that you could replicate the “filtered” view of the data?

Replication is a major issue in publicly funded research these days. Not reason for that to be any different for data science.

Yes?

June 1, 2015

Memantic Is Online!

Filed under: Bioinformatics,Biomedical,Medical Informatics — Patrick Durusau @ 2:34 pm

Memantic

I first blogged about the Memantic paper: Memantic: A Medical Knowledge Discovery Engine in March of this year and am very happy to now find it online!

From the about page:

Memantic captures relationships between medical concepts by mining biomedical literature and organises these relationships visually according to a well-known medical ontology. For example, a search for “Vitamin B12 deficiency” will yield a visual representation of all related diseases, symptoms and other medical entities that Memantic has discovered from the 25 million medical publications and abstracts mentioned above, as well as a number of medical encyclopaedias.

The user can explore a relationship of interest (such as the one between “Vitamin B12 deficiency” and “optic neuropathy”, for instance) by clicking on it, which will bring up links to all the scientific texts that have been discovered to support that relationship. Furthermore, the user can select the desired type of related concepts — such as “diseases”, “symptoms”, “pharmacological agents”, “physiological functions”, and so on — and use it as a filter to make the visualisation even more concise. Finally, the related concepts can be semantically grouped into an expandable tree hierarchy to further reduce screen clutter and to let the user quickly navigate to the relevant area of interest.

Concisely organising related medical entities without duplication

Memantic first presents all medical terms related to the query concept and then groups publications by the presence of each such term in addition to the query itself. The hierarchical nature of this grouping allows the user to quickly establish previously unencountered relationships and to drill down into the hierarchy to only look at the papers concerning such relationships. Contrast this with the same search performed on Google, where the user normally gets a number of links, many of which have the same title; the user has to go through each link to see if it contains any novel information that is relevant to their query.

Keeping the index of relationships up-to-date

Memantic perpetually renews its index by continuously mining the biomedical literature, extracting new relationships and adding supporting publications to the ones already discovered. The key advantage of Memantic’s user interface is that novel relationships become apparent to the user much quicker than on standard search engines. For example, Google may index a new research paper that exposes a previously unexplored connection between a particular drug and the disease that is being searched for by the user. However, Google may not assign that paper the sufficient weight for it to appear in the first few pages of the search results, thus making it invisible to the people searching for the disease who do not persevere in clicking past those initial pages.

To get a real feel for what the site is capable of, you need to create an account (free) and try it for yourself.

I am not a professional medical researchers but was able to duplicate some prior research I have done on edge case conditions fairly quickly. Whether that was due to the interface and its techniques or because of my knowledge of the subject area is hard to answer.

The interface alone is worth the visit.

Do give Memantic a spin! I think you will like what you find.

March 10, 2015

NIH-led effort launches Big Data portal for Alzheimer’s drug discovery

Filed under: BigData,Bioinformatics,Medical Informatics,Open Science — Patrick Durusau @ 6:23 pm

NIH-led effort launches Big Data portal for Alzheimer’s drug discovery

From the post:

A National Institutes of Health-led public-private partnership to transform and accelerate drug development achieved a significant milestone today with the launch of a new Alzheimer’s Big Data portal — including delivery of the first wave of data — for use by the research community. The new data sharing and analysis resource is part of the Accelerating Medicines Partnership (AMP), an unprecedented venture bringing together NIH, the U.S. Food and Drug Administration, industry and academic scientists from a variety of disciplines to translate knowledge faster and more successfully into new therapies.

The opening of the AMP-AD Knowledge Portal and release of the first wave of data will enable sharing and analyses of large and complex biomedical datasets. Researchers believe this approach will ramp up the development of predictive models of Alzheimer’s disease and enable the selection of novel targets that drive the changes in molecular networks leading to the clinical signs and symptoms of the disease.

“We are determined to reduce the cost and time it takes to discover viable therapeutic targets and bring new diagnostics and effective therapies to people with Alzheimer’s. That demands a new way of doing business,” said NIH Director Francis S. Collins, M.D., Ph.D. “The AD initiative of AMP is one way we can revolutionize Alzheimer’s research and drug development by applying the principles of open science to the use and analysis of large and complex human data sets.”

Developed by Sage Bionetworks , a Seattle-based non-profit organization promoting open science, the portal will house several waves of Big Data to be generated over the five years of the AMP-AD Target Discovery and Preclinical Validation Project by multidisciplinary academic groups. The academic teams, in collaboration with Sage Bionetworks data scientists and industry bioinformatics and drug discovery experts, will work collectively to apply cutting-edge analytical approaches to integrate molecular and clinical data from over 2,000 postmortem brain samples.

Big data and open science, now that sounds like a winning combination:

Because no publication embargo is imposed on the use of the data once they are posted to the AMP-AD Knowledge Portal, it increases the transparency, reproducibility and translatability of basic research discoveries, according to Suzana Petanceska, Ph.D., NIA’s program director leading the AMP-AD Target Discovery Project.

“The era of Big Data and open science can be a game-changer in our ability to choose therapeutic targets for Alzheimer’s that may lead to effective therapies tailored to diverse patients,” Petanceska said. “Simply stated, we can work more effectively together than separately.”

Imagine that, academics who aren’t hoarding data for recruitment purposes.

Works for me!

Does it work for you?

NIH RFI on National Library of Medicine

Filed under: BigData,Machine Learning,Medical Informatics,NIH — Patrick Durusau @ 2:16 pm

NIH Announces Request for Information Regarding Deliberations of the Advisory Committee to the NIH Director (ACD) Working Group on the National Library of Medicine

Deadline: Friday, March 13, 2015.

Responses to this RFI must be submitted electronically to: http://grants.nih.gov/grants/rfi/rfi.cfm?ID=41.

Apologies for having missed this announcement. Perhaps the title lacked urgency? 😉

From the post:

The National Institutes of Health (NIH) has issued a call for participation in a Request for Information (RFI), allowing the public to share its thoughts with the NIH Advisory Committee to the NIH Director Working Group charged with helping to chart the course of the National Library of Medicine, the world’s largest biomedical library and a component of the NIH, in preparation for recruitment of a successor to Dr. Donald A.B. Lindberg, who will retire as NLM Director at the end of March 2015.

As part of the working group’s deliberations, NIH is seeking input from stakeholders and the general public through an RFI.

Information Requested

The RFI seeks input regarding the strategic vision for the NLM to ensure that it remains an international leader in biomedical data and health information. In particular, comments are being sought regarding the current value of and future need for NLM programs, resources, research and training efforts and services (e.g., databases, software, collections). Your comments can include but are not limited to the following topics:

  • Current NLM elements that are of the most, or least, value to the research community (including biomedical, clinical, behavioral, health services, public health and historical researchers) and future capabilities that will be needed to support evolving scientific and technological activities and needs.
  • Current NLM elements that are of the most, or least, value to health professionals (e.g., those working in health care, emergency response, toxicology, environmental health and public health) and future capabilities that will be needed to enable health professionals to integrate data and knowledge from biomedical research into effective practice.
  • Current NLM elements that are of most, or least, value to patients and the public (including students, teachers and the media) and future capabilities that will be needed to ensure a trusted source for rapid dissemination of health knowledge into the public domain.
  • Current NLM elements that are of most, or least, value to other libraries, publishers, organizations, companies and individuals who use NLM data, software tools and systems in developing and providing value-added or complementary services and products and future capabilities that would facilitate the development of products and services that make use of NLM resources.
  • How NLM could be better positioned to help address the broader and growing challenges associated with:
    • Biomedical informatics, “big data” and data science;
    • Electronic health records;
    • Digital publications; or
    • Other emerging challenges/elements warranting special consideration.

If I manage to put something together, I will post it here as well as to the NIH.

Experiences with big data and machine learning, for all of the hype, have been falling short of the promised land. Not that I think topic maps/subject identity can get you there but certainly closer than wandering in the woods of dark data.

March 1, 2015

John Snow, and OpenStreetMap

Filed under: Medical Informatics,Open Street Map — Patrick Durusau @ 6:06 pm

John Snow, and OpenStreetMap by Arthur Charpentier.

From the post:

johnsnowillustration

While I was working for a training on data visualization, I wanted to get a nice visual for John Snow’s cholera dataset. This dataset can actually be found in a great package of famous historical datasets.

You know the story, right? Cholera epidemic in Soho, London, 1854. After Snow established that the Broad Street water pump was at the center of the outbreak, the Broad Street pump handle was removed.

But the story doesn’t end there, Wikipedia notes:

After the cholera epidemic had subsided, government officials replaced the Broad Street pump handle. They had responded only to the urgent threat posed to the population, and afterward they rejected Snow’s theory. To accept his proposal would have meant indirectly accepting the oral-fecal method transmission of disease, which was too unpleasant for most of the public to contemplate.

Government has been looking out for public opinion, not to say public health and well-being for quite some time.

Replicating the Snow analysis is important but it is even more important to realize that the equivalents of cholera are present in modern urban environments. Not cholera so often but street violence, bad drugs, high interest rate loans, food deserts, lack of child care, etc. are the modern equivalents of cholera.

What if a John Snow like mapping demonstrated that living in particular areas made you some N% more likely to spent X number of years in a state prison? Do you think that would affect the property values of housing owned by slum lords? Or impact the allocation for funds for schools and libraries?

Enjoy!

February 9, 2015

Newly Discovered Networks among Different Diseases…

Filed under: Bioinformatics,Medical Informatics,Networks — Patrick Durusau @ 4:32 pm

Newly Discovered Networks among Different Diseases Reveal Hidden Connections by Veronique Greenwood and Quanta Magazine.

From the post:

Stefan Thurner is a physicist, not a biologist. But not long ago, the Austrian national health insurance clearinghouse asked Thurner and his colleagues at the Medical University of Vienna to examine some data for them. The data, it turned out, were the anonymized medical claims records—every diagnosis made, every treatment given—of most of the nation, which numbers some 8 million people. The question was whether the same standard of care could continue if, as had recently happened in Greece, a third of the funding evaporated. But Thurner thought there were other, deeper questions that the data could answer as well.

In a recent paper in the New Journal of Physics, Thurner and his colleagues Peter Klimek and Anna Chmiel started by looking at the prevalence of 1,055 diseases in the overall population. They ran statistical analyses to uncover the risk of having two diseases together, identifying pairs of diseases for which the percentage of people who had both was higher than would be expected if the diseases were uncorrelated—in other words, a patient who had one disease was more likely than the average person to have the other. They applied statistical corrections to reduce the risk of drawing false connections between very rare and very common diseases, as any errors in diagnosis will get magnified in such an analysis. Finally, the team displayed their results as a network in which the diseases are nodes that connect to one another when they tend to occur together.

The style of analysis has uncovered some unexpected links. In another paper, published on the scientific preprint site arxiv.org, Thurner’s team confirmed a controversial connection between diabetes and Parkinson’s disease, as well as unique patterns in the timing of when diabetics develop high blood pressure. The paper in the New Journal of Physics generated additional connections that they hope to investigate further.

Every medical claim for almost eight (8) million people would make a very dense graph. Yes?

When you look at the original papers, notice that the researchers did not create a graph that held all their data. In the New Journal of Physics paper, only the diseases appear to demonstrate their clustering and the patients not at all. In the archiv.org paper, another means is used to demonstrate the risk of specific diseases and the two types (DM1, DM2) of diabetes.

I think the lesson here is that despite being “network” data, that isn’t determinative for presentation or analysis of data.

February 4, 2015

ChEMBL 20 incorporates the Pistoia Alliance’s HELM annotation

Filed under: Bioinformatics,Chemistry,Medical Informatics — Patrick Durusau @ 4:35 pm

ChEMBL 20 incorporates the Pistoia Alliance’s HELM annotation by Richard Holland.

From the post:

The European Bioinformatics Institute (EMBL-EBI) has released version 20 of ChEMBL, the database of compound bioactivity data and drug targets. ChEMBL now incorporates the Hierarchical Editing Language for Macromolecules (HELM), the macromolecular representation standard recently released by the Pistoia Alliance.

HELM can be used to represent simple macromolecules (e.g. oligonucleotides, peptides and antibodies) complex entities (e.g. those with unnatural amino acids) or conjugated species (e.g. antibody-drug conjugates). Including the HELM notation for ChEMBL’s peptide-derived drugs and compounds will, in future, enable researchers to query that content in new ways, for example in sequence- and chemistry-based searches.

Initially created at Pfizer, HELM was released as an open standard with an accompanying toolkit through a Pistoia Alliance initiative, funded and supported by its member organisations. EMBL-EBI joins the growing list of HELM adopters and contributors, which include Biovia, ACD Labs, Arxspan, Biomax, BMS, ChemAxon, eMolecules, GSK, Lundbeck, Merck, NextMove, Novartis, Pfizer, Roche, and Scilligence. All of these organisations have either built HELM-based infrastructure, enabled HELM import/export in their tools, initiated projects for the incorporation of HELM into their workflows, published content in HELM format, or supplied funding or in-kind contributions to the HELM project.

More details:

The European Bioinformatics Institute

HELM project (open source, download, improve)

Pistoia Alliance

Another set of subjects ripe for annotation with topic maps!

January 20, 2015

Databases of Biological Databases (yes, plural)

Filed under: Bioinformatics,Biology,Medical Informatics — Patrick Durusau @ 4:15 pm

Mick Watson points out in a tweet today that there are at least two databases of biological databases.

Metabase

MetaBase is a user-contributed list of all the biological databases available on the internet. Currently there are 1,802 entries, each describing a different database. The databases are described in a semi-structured way by using templates and entries can cary various user comments and annotations (see a random entry). Entries can be searched, listed or browsed by category.

The site uses the same MediaWiki technology that powers Wikipedia, probably the best known user-contributed resource on the internet. The Mediawiki system allows users to participate on many different levels, ranging from authors and editors to curators and designers.

Database description

MetaBase aims to be a flexible, user-driven (user-created) resource for the biological database community.

The main focus of MetaBase is summarised below:

  • As a basic requirement, MB contains a list of databases, URLs and descriptions of the most commonly used biological databases currently available on the internet.
  • The system should be flexible, allowing users to contribute, update and maintain the data in different ways.
  • In the future we aim to generate more communication between the database developer and user communities.

A larger, more ambitious list of aims is given here.

The first point was acheived using data taken from the Molecular Biology Database Collection. Secondly, MetaBase has been implemented using MediaWiki. The final point will take longer, and is dependent on the community uptake of MB…

DBD – Database of Biological Databases

DBD: Database of Biological Database team are R.R. Siva Kiran, MVN Setty, Department of Biotechnology, MS Ramaiah Institute of Technology, MSR Nagar, Bangalore, India and G. Hanumantha Rao, Center for Biotechnology, Department of Chemical Engineering, Andhra University, Visakhapatnam-530003, India. DBD consists of 1200 Database entries covering wide range of databases useful for biological researchers.

Be aware that the DBD database reports its last update as 30-July-2008. I have written to confirm if that is the correct date.

Assuming it is, has anyone validated the links in the DBD database and/or compared them to the links in Metabase? That seems like a worthwhile service to the community.

January 13, 2015

Adventures in Design

Filed under: Design,Medical Informatics,Software Engineering — Patrick Durusau @ 2:36 pm

Whether you remember the name or not, you have heard of the Therac-25, a radiation therapy machine responsible for giving massive radiation doses resulting in serious injury or death between 1985 and 1987. Classic case for software engineering.

The details are quite interesting but I wanted to point out that it doesn’t take complex or rare software failures to be dangerous.

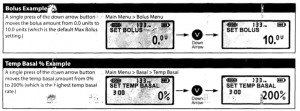
Case in point: I received a replacement insulin pump today that had the following header:

medtronic-models

The problem?

medtronic-roll-over

Interesting. You go down from “zero” to the maximum setting.

FYI, the device in question measures insulin in 0.05 increments, so 10.0 units is quite a bit. Particularly if that isn’t what you intended to do.

Medtronic has offered a free replacement for any pump with this “roll around feature.”

I have been using Medtronic devices for years and have always found them to be extremely responsive to users so don’t take this as a negative comment on them or their products.

It is, however, a good illustration that what may be a feature to one user may well not be a feature for another. Which makes me wonder, how do you design counters? Do they wrap at maximum/minimum values?

Design issues only come up when you recognize them as design issues. Otherwise they are traps for the unwary.

November 18, 2014

When Information Design is a Matter of Life or Death

Filed under: Design,Interface Research/Design,Medical Informatics — Patrick Durusau @ 4:43 pm

When Information Design is a Matter of Life or Death by Thomas Bohm.

From the post:

In 2008, Lloyds Pharmacy conducted 20 minute interviews1 with 1,961 UK adults. Almost one in five people admitted to having taken prescription medicines incorrectly; more than eight million adults have either misread medicine labels or misunderstood the instructions, resulting in them taking the wrong dose or taking medication at the wrong time of day. In addition, the overall problem seemed to be more acute among older patients.

Almost one in five people admitted to having taken prescription medicines incorrectly; more than eight million adults have either misread medicine labels or misunderstood the instructions.

Medicine or patient information leaflets refer to the document included inside medicine packaging and are typically printed on thin paper (see figures 1.1–1.4). They are essential for the safe use of medicines and help answer people’s questions when taking the medicine.

If the leaflet works well, it can lead to people taking the medicine correctly, hopefully improving their health and wellness. If it works poorly, it can lead to adverse side effects, harm, or even death. Subsequently, leaflets are heavily regulated in the way they need to be designed, written, and produced. European2 and individual national legislation sets out the information to be provided, in a specific order, within a medicine information leaflet.

A good reminder that failure to communicate in some information systems has more severe penalties than others.

I was reminded while reading the “thin paper” example:

Medicine information leaflets are often printed on thin paper and folded many times to fit into the medicine package. There is a lot of show-through from the information printed on the back of the leaflet, which decreases readability. When the leaflet is unfolded, the paper crease marks affect the readability of the text (see figures 1.3 and 1.4). A possible improvement would be to print the leaflet on a thicker paper.

of a information leaflet that unfolded to be 18 inches wide and 24 inches long. A real tribute to the folding art. The typeface was challenging even with glasses and a magnifying glass. Too tiring to read much of it.

I don’t think thicker paper would have helped, unless the information leaflet became an information booklet.

What are the consequences if someone misreads your interface?

November 17, 2014

Programming in the Life Sciences

Filed under: Bioinformatics,Life Sciences,Medical Informatics,Programming,Science — Patrick Durusau @ 4:06 pm

Programming in the Life Sciences by Egon Willighagen.

From the first post in this series, Programming in the Life Sciences #1: a six day course (October, 2013):

Our department will soon start the course Programming in the Life Sciences for a group of some 10 students from the Maastricht Science Programme. This is the first time we give this course, and over the next weeks I will be blogging about this course. First, some information. These are the goals, to use programming to:

  • have the ability to recognize various classes of chemical entities in pharmacology and to understand the basic physical and chemical interactions.
  • be familiar with technologies for web services in the life sciences.
  • obtain experience in using such web services with a programming language.
  • be able to select web services for a particular pharmacological question.
  • have sufficient background for further, more advanced, bioinformatics data analyses.

So, this course will be a mix of things. I will likely start with a lecture or too about scientific programming, such as the importance of reproducibility, licensing, documentation, and (unit) testing. To achieve these learning goals we have set a problem. The description is:


    In the life sciences the interactions between chemical entities is of key interest. Not only do these play an important role in the regulation of gene expression, and therefore all cellular processes, they are also one of the primary approaches in drug discovery. Pharmacology is the science studies the action of drugs, and for many common drugs, this is studying the interaction of small organic molecules and protein targets.
    And with the increasing information in the life sciences, automation becomes increasingly important. Big data and small data alike, provide challenges to integrate data from different experiments. The Open PHACTS platform provides web services to support pharmacological research and in this course you will learn how to use such web services from programming languages, allowing you to link data from such knowledge bases to other platforms, such as those for data analysis.

So, it becomes pretty clear what the students will be doing. They only have six days, so it won’t be much. It’s just to learn them the basic skills. The students are in their 3rd year at the university, and because of the nature of the programme they follow, a mixed background in biology, mathematics, chemistry, and physics. So, I have a good hope they will surprise me in what they will get done.

Pharmacology is the basic topic: drug-protein interaction, but the students are free to select a research question. In fact, I will not care that much what they like to study, as long as they do it properly. They will start with Open PHACTS’ Linked Data API, but here too, they are free to complement data from the OPS cache with additional information. I hope they do.

Now, regarding the technology they will use. The default will be JavaScript, and in the next week I will hack up demo code showing the integration of ops.js and d3.js. Let’s see how hard it will be; it’s new to me too. But, if the students already are familiar with another programming language and prefer to use that, I won’t stop them.

(For the Dutch readers, would #mscpils be a good tag?)

For quite a few “next weeks,” Egon’s blogging has gone on and life sciences, to say nothing of his readers, are all better off for it! His most recent post is titled: Programming in the Life Sciences #20: extracting data from JSON.

Definitely a series to catch or to pass along for anyone involved in life sciences.

Enjoy!

November 16, 2014

New SNOMED CT Data Files Available

Filed under: Medical Informatics,SNOMED — Patrick Durusau @ 8:01 pm

New SNOMED CT Data Files Available

From the post:

NLM is pleased to announce the following releases available for download:

  1. A new subset from Convergent Medical Terminology (CMT) is now available for download from the UMLS Terminology Services (UTS) by UMLS licensees. This problem list subset includes concepts that KP uses within the ED Problem List. There are 2189 concepts in this file. SNOMED Concepts are based on the 1/31/2012 version of the International Release.

    For more information about CMT, please see the NLM CMT Frequently Asked Questions page.

  2. The Spanish Edition of the SNOMED CT International Release is now available for download.
  3. On behalf of the International Health Terminology Standards Development Organisation (IHTSDO), NLM is pleased to announce the release of the SNOMED CT International General/Family Practice subset (GP/FP Subset) and map from the GP/FP Subset to the International Classification of Primary Care (ICPC-2). This is the baseline work release resulting from the harmonization agreement between the IHTSDO and WONCA.

    The purpose of this subset is to provide the frequently used SNOMED CT concepts for use in general/family practice electronic health records within the following data fields: reason for encounter, and health issue. The purpose of the map from the SNOMED CT GP/FP subset to ICPC-2 is to allow for the granular concepts to be recorded by GPs/FPs at the point of care using SNOMED CT, with subsequent analysis and reporting using the internationally recognized ICPC-2 classification. However please note that use within clinical systems cannot be supported at this time. This Candidate Baseline is distributed for evaluation purposes only and should not be used in production clinical systems or in clinical settings.

    The subsets are aligned to the July 2014 SNOMED CT International Release. The SNOMED CT to ICPC-2 map is a Candidate Baseline, which IHTSDO expects to confirm as the Baseline release following the January 2015 SNOMED CT International Release.

If your work in any way touches upon medical teminology, Convergent Medical Terminology (CMT) and SNOMED CT (Systematized Nomenclature of Medicine–Clinical Terms), among other collections of medical terminology will be of interest to you.

Medical terminology is a small part of the world at large and you can see what it takes for the NLM to maintain a semblance of chaotic order. Great benefit flow even from a semblance of order but those benefits are not free.

November 14, 2014

Exemplar Public Health Datasets

Filed under: Bioinformatics,Dataset,Medical Informatics,Public Data — Patrick Durusau @ 2:45 pm

Exemplar Public Health Datasets Editor: Jonathan Tedds.

From the post:

This special collection contains papers describing exemplar public heath datasets published as part of the Enhancing Discoverability of Public Health and Epidemiology Research Data project commissioned by the Wellcome Trust and the Public Health Research Data Forum.

The publication of the datasets included in this collection is intended to promote faster progress in improving health, better value for money and higher quality science, in accordance with the joint statement made by the forum members in January 2011.

Submission to this collection is by invitation only, and papers have been peer reviewed. The article template and instructions for submission are available here.

Data for analysis as well as examples of best practices for pubic health datasets.

Enjoy!

I first saw this in a tweet by Christophe Lallanne.

November 5, 2014

MeSH on Demand Update: How to Find Citations Related to Your Text

Filed under: Indexing,Medical Informatics,MeSH — Patrick Durusau @ 7:51 pm

MeSH on Demand Update: How to Find Citations Related to Your Text

From the post:

In May 2014, NLM introduced MeSH on Demand, a Web-based tool that suggests MeSH terms from your text such as an abstract or grant summary up to 10,000 characters using the MTI (Medical Text Indexer) software. For more background information, see the article, MeSH on Demand Tool: An Easy Way to Identify Relevant MeSH Terms.

New Feature

A new MeSH on Demand feature displays the PubMed ID (PMID) for the top ten related citations in PubMed that were also used in computing the MeSH term recommendations.

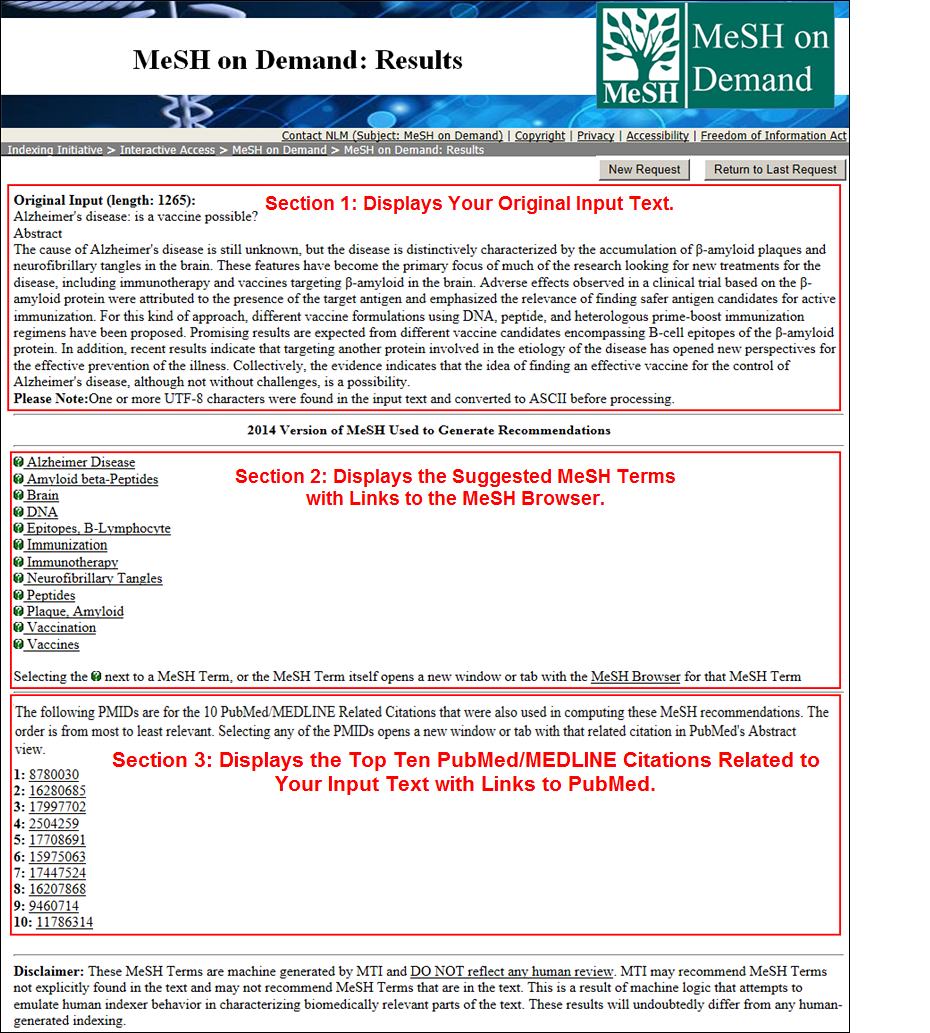
To access this new feature start from the MeSH on Demand homepage (see Figure 1), add your text, such as a project summary, into the box labeled “Text to be Processed.” Then, click the “Find MeSH Terms” button.

Results page:

mesh results

A clever way to deal with the problem of a searcher not knowing the specialized vocabulary of an indexing system.

Have you seen this method used outside of MeSH?

October 13, 2014

The Dirty Little Secret of Cancer Research

Filed under: BigData,Bioinformatics,Genomics,Medical Informatics — Patrick Durusau @ 8:06 pm

The Dirty Little Secret of Cancer Research by Jill Neimark.

From the post:


Across different fields of cancer research, up to a third of all cell lines have been identified as imposters. Yet this fact is widely ignored, and the lines continue to be used under their false identities. As recently as 2013, one of Ain’s contaminated lines was used in a paper on thyroid cancer published in the journal Oncogene.

“There are about 10,000 citations every year on false lines—new publications that refer to or rely on papers based on imposter (human cancer) celllines,” says geneticist Christopher Korch, former director of the University of Colorado’s DNA Sequencing Analysis & Core Facility. “It’s like a huge pyramid of toothpicks precariously and deceptively held together.”

For all the worry about “big data,” where is the concern over “big bad data?”

Or is “big data” too big for correctness of the data to matter?

Once you discover that a paper is based on “imposter (human cancer) celllines,” how do you pass that information along to anyone who attempts to cite the article?

In other words, where do you write down that data about the paper, where the paper is the subject in question?

And how do you propagate that data across a universe of citations?

The post ends on a high note of current improvements but it is far from settled how to prevent reliance on compromised research.

I first saw this in a tweet by Dan Graur

October 10, 2014

Recognizing patterns in genomic data

Filed under: Bioinformatics,Biomedical,Genomics,Medical Informatics — Patrick Durusau @ 3:13 pm

Recognizing patterns in genomic data – New visualization software uncovers cancer subtypes from a vast repository of biomedical information by Stephanie Dutchen.

From the post:

Much of biomedical research these days is about big data—collecting and analyzing vast, detailed repositories of information about health and disease. These data sets can be treasure troves for investigators, often uncovering genetic mutations that drive a particular kind of cancer, for example.

Trouble is, it’s impossible for humans to browse that much data, let alone make any sense of it.

“It’s [StratomeX] a tool to help you make sense of the data you’re collecting and find the right questions to ask,” said Nils Gehlenborg, research associate in biomedical informatics at HMS and co-senior author of the correspondence in Nature Methods. “It gives you an unbiased view of patterns in the data. Then you can explore whether those patterns are meaningful.”

The software, called StratomeX, was developed to help researchers distinguish subtypes of cancer by crunching through the incredible amount of data gathered as part of The Cancer Genome Atlas, a National Institutes of Health–funded initiative. Identifying distinct cancer subtypes can lead to more effective, personalized treatments.

When users input a query, StratomeX compares tumor data at the molecular level that was collected from hundreds of patients and detects patterns that might indicate significant similarities or differences between groups of patients. The software presents those connections in an easy-to-grasp visual format.

“It helps you make meaningful distinctions,” said co-first author Alexander Lex, a postdoctoral researcher in the Pfister group.

Other than the obvious merits of this project, note the the role of software as the assistant to the user. It crunches the numbers in a specific domain and presents those results in a meaningful fashion.

It is up to the user to decide which patters are useful and which are not. Shades of “recommending” other instances of the “same” subject?

StratomeX is available for download.

I first saw this in a tweet by Harvard SEAS.

October 2, 2014

NCBI webinar on E-Utilities October 15th

Filed under: Bioinformatics,Medical Informatics — Patrick Durusau @ 3:58 pm

NCBI webinar on E-Utilities October 15th

From the post:

On October 15th, NCBI will have a webinar entitled “An Introduction to NCBI’s E-Utilities, an NCBI API.” E-Utilities is a tool to assist programmers in accessing, searching and retrieving a wide variety of data from NCBI servers.

This presentation will introduce you to the Entrez Programming Utilities (E-Utilities), the public API for the NCBI Entrez system that includes 40 databases such as Pubmed, PMC, Gene, Genome, GEO and dbSNP. After covering the basic functions and URL syntax of the E-utilities, we will then demonstrate these functions using Entrez Direct, a set of UNIX command line programs that allow you to incorporate E-utility calls easily into simple shell scripts.

Click here to register.

Thought you might find this interesting for populating topic maps out of NCBI servers.

September 21, 2014

Medical Heritage Library (MHL)

Filed under: Biomedical,History,Library,Medical Informatics — Patrick Durusau @ 10:48 am

Medical Heritage Library (MHL)

From the post:

The Medical Heritage Library (MHL) and DPLA are pleased to announce that MHL content can now be discovered through DPLA.

The MHL, a specialized research collection stored in the Internet Archive, currently includes nearly 60,000 digital rare books, serials, audio and video recordings, and ephemera in the history of medicine, public health, biomedical sciences, and popular medicine from the medical special collections of 22 academic, special, and public libraries. MHL materials have been selected through a rigorous process of curation by subject specialist librarians and archivists and through consultation with an advisory committee of scholars in the history of medicine, public health, gender studies, digital humanities, and related fields. Items, selected for their educational and research value, extend from 1235 (Liber Aristotil[is] de nat[u]r[a] a[nima]li[u]m ag[res]tium [et] marino[rum]), to 2014 (The Grog Issue 40 2014) with the bulk of the materials dating from the 19th century.

“The rich history of medicine content curated by the MHL is available for the first time alongside collections like those from the Biodiversity Heritage Library and the Smithsonian, and offers users a single access point to hundreds of thousands of scientific and history of science resources,” said DPLA Assistant Director for Content Amy Rudersdorf.

The collection is particularly deep in American and Western European medical publications in English, although more than a dozen languages are represented. Subjects include anatomy, dental medicine, surgery, public health, infectious diseases, forensics and legal medicine, gynecology, psychology, anatomy, therapeutics, obstetrics, neuroscience, alternative medicine, spirituality and demonology, diet and dress reform, tobacco, and homeopathy. The breadth of the collection is illustrated by these popular items: the United States Naval Bureau of Medical History’s audio oral history with Doctor Walter Burwell (1994) who served in the Pacific theatre during World War II and witnessed the first Japanese kamikaze attacks; History and medical description of the two-headed girl : sold by her agents for her special benefit, at 25 cents (1869), the first edition of Gray’s Anatomy (1858) (the single most-downloaded MHL text at more than 2,000 downloads annually), and a video collection of Hanna – Barbera Production Flintstones (1960) commercials for Winston cigarettes.

“As is clear from today’s headlines, science, health, and medicine have an impact on the daily lives of Americans,” said Scott H. Podolsky, chair of the MHL’s Scholarly Advisory Committee. “Vaccination, epidemics, antibiotics, and access to health care are only a few of the ongoing issues the history of which are well documented in the MHL. Partnering with the DPLA offers us unparalleled opportunities to reach new and underserved audiences, including scholars and students who don’t have access to special collections in their home institutions and the broader interested public.“

Quick links:

Digital Public Library of America

Internet Archive

Medical Heritage Library website

I remember the Flintstone commercials for Winston cigarettes. Not all that effective a campaign, I smoked Marboros (reds in a box) for almost forty-five (45) years. 😉

As old vices die out, new ones, like texting and driving take their place. On behalf of current and former smokers, I am confident that smoking was not a factor in 1,600,000 accidents per year and 11 teen deaths every day.

August 23, 2014

NLM RSS Feeds

Filed under: Medical Informatics,MeSH — Patrick Durusau @ 10:19 am

National Library of Medicine RSS Feeds

RSS feeds covering a broad range National Library of Medicine activities.

I am reporting it here because as soon as I don’t, I will need the listing.

NLM Technical Bulletin

Filed under: Medical Informatics,MeSH — Patrick Durusau @ 10:07 am

NLM Technical Bulletin

A publication of the U.S. National Library of Medicine (NLM). The about page for NLM gives the following overview:

The National Library of Medicine (NLM), on the campus of the National Institutes of Health in Bethesda, Maryland, has been a center of information innovation since its founding in 1836. The world’s largest biomedical library, NLM maintains and makes available a vast print collection and produces electronic information resources on a wide range of topics that are searched billions of times each year by millions of people around the globe. It also supports and conducts research, development, and training in biomedical informatics and health information technology. In addition, the Library coordinates a 6,000-member National Network of Libraries of Medicine that promotes and provides access to health information in communities across the United States.

The bulletin about page says:

The NLM Technical Bulletin, your source for the latest searching information, is produced by: MEDLARS Management Section, National Library of Medicine, Bethesda, Maryland, USA.

Which is true but seems inadequate to describe the richness of what you can find at the bulletin.

For example, in 2014 July&emdash;August No. 399 you find:

MeSH on Demand Update: How to Find Citations Related to Your Text

New CMT Subsets Available

New Tutorial: Searching Drugs or Chemicals in PubMed

If medical terminology touches your field of interest, this is a must read.

MeSH on Demand Tool:…

Filed under: Authoring Topic Maps,Bioinformatics,Medical Informatics,MeSH — Patrick Durusau @ 9:43 am

MeSH on Demand Tool: An Easy Way to Identify Relevant MeSH Terms by Dan Cho.

From the post:

Currently, the MeSH Browser allows for searches of MeSH terms, text-word searches of the Annotation and Scope Note, and searches of various fields for chemicals. These searches assume that users are familiar with MeSH terms and using the MeSH Browser.

Wouldn’t it be great if you could find MeSH terms directly from your text such as an abstract or grant summary? MeSH on Demand has been developed in close collaboration among MeSH Section, NLM Index Section, and the Lister Hill National Center for Biomedical Communications to address this need.

Using MeSH on Demand

Use MeSH on Demand to find MeSH terms relevant to your text up to 10,000 characters. One of the strengths of MeSH on Demand is its ease of use without any prior knowledge of the MeSH vocabulary and without any downloads.

Now there’s a clever idea!

Imagine extending it just a bit so that it produces topics for subjects it detects in your text and associations with the text and author of the text. I would call that assisted topic map authoring. You?

I followed a tweet by Michael Hoffman, which lead to: MeSH on Demand Update: How to Find Citations Related to Your Text, which describes an enhancement to MeSH on demands that finds relevant citations (10) based on your text.

The enhanced version mimics the traditional method of writing court opinions. A judge writes his decision and then a law clerk finds cases that support the positions taken in the opinion. You really thought it worked some other way? 😉

Older Posts »

Powered by WordPress