Another Word For It Patrick Durusau on Topic Maps and Semantic Diversity

January 30, 2019

‘Diversity in Faces’ Dataset – Are You Being Treated Unfairly? As A Matter of Fact, Yes.

IBM Research Releases ‘Diversity in Faces’ Dataset to Advance Study of Fairness in Facial Recognition Systems by John R. Smith.

From the post:

Have you ever been treated unfairly? How did it make you feel? Probably not too good. Most people generally agree that a fairer world is a better world, and our AI researchers couldn’t agree more. That’s why we are harnessing the power of science to create AI systems that are more fair and accurate.

Many of our recent advances in AI have produced remarkable capabilities for computers to accomplish increasingly sophisticated and important tasks, like translating speech across languages to bridge communications across cultures, improving complex interactions between people and machines, and automatically recognizing contents of video to assist in safety applications.

Much of the power of AI today comes from the use of data-driven deep learning to train increasingly accurate models by using growing amounts of data. However, the strength of these techniques can also be a weakness. The AI systems learn what they’re taught, and if they are not taught with robust and diverse datasets, accuracy and fairness could be at risk. For that reason, IBM, along with AI developers and the research community, need to be thoughtful about what data we use for training. IBM remains committed to developing AI systems to make the world more fair.

To request access to the DiF dataset, visit our webpage. To learn more about DiF, read our paper, “Diversity in Faces.”

Nice of Smith to we have “ever been treated unfairly?”

Because if not before, certainly now with the limitations on access to the “Diversity in Faces” Dataset.

Step 1

Review the DiF Terms of Use and Privacy Notice.

DOCUMENTS

Terms of use

DiF Privacy Notice

Step 2

Download and complete the questionnaire.

DOCUMENT

DiF Questionnaire (PDF)

Step 3

Email completed questionnaire to IBM Research.

APPLICATION CONTACT

Michele Merler | mimerler@us.ibm.com

Step 4

Further instructions will be provided from IBM Research via email once application is approved.

Check out Terms of Use, 3. IP Rights, 3.2 #5:


Licensee grants to IBM a non-exclusive, irrevocable, unrestricted, worldwide and paid-up right, license and sublicense to: a) include in any product or service any idea, know-how, feedback, concept, technique, invention, discovery or improvement, whether or not patentable, that Licensee provides to IBM, b) use, manufacture and market any such product or service, and c) allow others to do any of the foregoing. (emphasis added)

Treated unfairly? There’s the grasping claw of IBM so familiar across the decades. I suppose we should be thankful it doesn’t include any ideas, concepts, patents, etc., that you develop while in possession of the dataset. From that perspective, the terms of use are downright liberal.
November 8, 2018

Shape-Guided Image Generation [Danger! Danger! Sarah Huckabee Sanders]

Filed under: Deep Learning,Image Processing,Image synthesis — Patrick Durusau @ 9:34 pm

A Variational U-Net for Conditional Appearance and Shape Generation by Patrick Esser, Ekaterina Sutter, Björn Ommer.

Abstract:

Deep generative models have demonstrated great performance in image synthesis. However, results deteriorate in case of spatial deformations, since they generate images of objects directly, rather than modeling the intricate interplay of their inherent shape and appearance. We present a conditional U-Net [30] for shape-guided image generation, conditioned on the output of a variational autoencoder for appearance. The approach is trained end-to-end on images, without requiring samples of the same object with varying pose or appearance. Experiments show that the model enables conditional image generation and transfer. Therefore, either shape or appearance can be retained from a query image, while freely altering the other. Moreover, appearance can be sampled due to its stochastic latent representation, while preserving shape. In quantitative and qualitative experiments on COCO [20], DeepFashion [21, 23], shoes [43], Market-1501 [47] and handbags [49] the approach demonstrates significant improvements over the state-of-the-art.

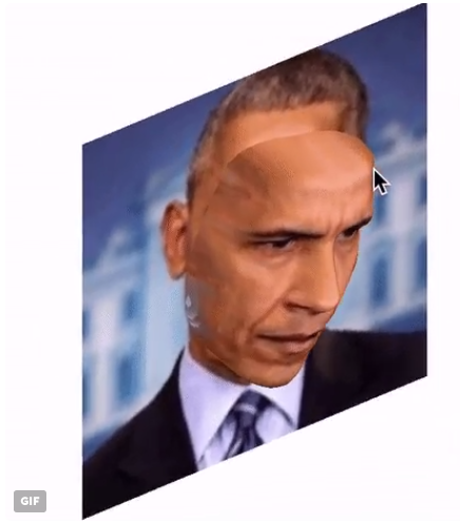
The abstract fails to convey the results described in the paper. Try:

The animated versions are based on the single image on the left.

There is a Github site with training data: https://github.com/CompVis/vunet which carries this short description:

The model learns to infer appearance from a single image and can synthesize images with that appearance in different poses.

My answer to anyone who objects to Sarah Huckabee Sanders or other members of the current regime in Washington being the subjects of this technique: Jim Acosta video.

This is war friends and you don’t win wars by praying for the other side to be more courteous.

September 4, 2018

Install OpenCV on Ubuntu – Success!

Filed under: Image Processing,Image Recognition,OpenCV — Patrick Durusau @ 8:51 am

I tried following How to install OpenCV on Ubuntu 18.04, only to crash and burn in several different ways.

Let’s see, two version of python (2.7 and 3.6), lack of some of the default packages of Ubuntu, etc. Correcting the version of python being called was easy enough, but when I ran into the dependency issues, I took the easy way out!

I downloaded Ubuntu 18.04 from OSBoxes.org, installed it on VirtualBox and then followed the instructions in How to install OpenCV on Ubuntu 18.04.

Success!

I didn’t explore the highways and byways of why my Ubuntu 18.04 doesn’t support the installation of OpenCV, but then my goal was the installation and use of OpenCV. That goal stands accomplished.

If at first you don’t succeed, grab a VM!

More on why the more than casual interest in OpenCV in a future post.

August 31, 2018

Leonardo da Vinci’s Notebooks [IIIF + Topic Maps]

Victoria and Albert Museum brings Leonardo da Vinci’s notebooks to life online by Gareth Harris.

From the post:

Scholars and digital experts at the Victoria and Albert Museum (V&A) in London have posted online the contents of two notebooks by Leonardo da Vinci, enabling devotees of the Renaissance polymath to zoom in and examine his revolutionary ideas and concepts.

On the technical front, the use of IIIF (International Image Interoperability Framework) to present a digital version of the notebooks is an innovation. “It’s our use of the IIIF standard that has enabled us to present the codex in a new way. The V&A digital team has been doing a lot of work in the last 18 months using IIIF. We’ve used the deep-zoom functionality enabled through IIIF to present some of the most spectacular and detailed items in our collection,” says Kati Price, the V&A’s head of digital media and publishing.

Crucially, IIIF also lets scholars compare similar objects across several institutions’ collections. “Researchers can easily see the images together with Leonardo da Vinci items held by other institutions using IIIF, for side-by-side digital comparison,” Yvard says.

These two notebooks, not to mention those to be posted next year for the 500th anniversary of Leonardo’s death, are important in their own right.

However, I want to draw your attention to the use of International Image Interoperability Framework (IIIF) in this project.

From the IIIF FAQ:

What is IIIF?

The International Image Interoperability Framework (IIIF) is a set of shared application programming interface (API) specifications for interoperable functionality in digital image repositories. The IIIF is comprised of and driven by a community of libraries, museums, archives, software companies, and other organizations working together to create, test, refine, implement and promote the IIIF specifications. Using JSON-LD, linked data, and standard W3C web protocols such as Web Annotation, IIIF makes it easy to parse and share digital image data, migrate across technology systems, and provide enhanced image access for scholars and researchers. In short, IIIF enables better, faster and cheaper image delivery. It lets you leverage interoperability and the fabric of the Web to access new possibilities and new users for your image-based resources, while reducing long term maintenance and technological lock in. IIIF gives users a rich set of baseline functionality for viewing, zooming, and assembling the best mix of resources and tools to view, compare, manipulate and work with images on the Web, an experience made portable–shareable, citable, and embeddable.

What are the benefits of IIIF?

….

Advanced, interactive functionality for end users

  • Fast, rich, zoom and pan delivery of images
  • Manipulation of size, scale, region of interest, rotation, quality and format.
  • Annotation – IIIF has native compatibility with the W3C annotation working group’s Web Annotation Data Model, which supports annotating content on the Web. Users can comment on, transcribe, and draw on image-based resources using the Web’s inherent architecture.
  • Assemble and use image-based resources from across the Web, regardless of source. Compare pages, build an exhibit, or view a virtual collection of items served from different sites.
  • Cite and Share – IIIF APIs provide motivation for persistence, providing portable views of images and/or regions of images. Cite an image with confidence in stable image URIs, or share it for reference by others–or yourself in a different environment.

If you are looking to enhance your topic map with images, this sounds like the right way to go. Ping me with your examples of your uses of IIIF with topic maps.

BTW, the Draft IIIF v.3.0 Specifications have been released for review.

September 18, 2017

3D Face Reconstruction from a Single Image

Filed under: Face Detection,Image Processing,Image Recognition — Patrick Durusau @ 7:54 pm

3D Face Reconstruction from a Single Image by Aaron S. Jackson, Adrian Bulat, Vasileios Argyriou and Georgios Tzimiropoulos, Computer Vision Laboratory, The University of Nottingham.

From the webpage:

This is an online demo of our paper Large Pose 3D Face Reconstruction from a Single Image via Direct Volumetric CNN Regression. Take a look at our project website to read the paper and get the code. Please use a (close to) frontal image, or the face detector won’t see you (dlib)

Images and 3D reconstructions will be deleted within 20 minutes. They will not be used for anything other than this demo.

Very impressive!

You can upload your own image or use an example face.

Here’s an example I stole from Reza Zadeh:

This has all manner of interesting possibilities. 😉

Enjoy!

PS: Torch7/MATLAB code for “Large Pose 3D Face Reconstruction from a Single Image via Direct Volumetric CNN Regression”

September 15, 2017

Landsat Viewer

Filed under: Geographic Data,Geophysical,Geospatial Data,Image Processing,Mapping,Maps — Patrick Durusau @ 10:32 am

Landsat Viewer by rcarmichael-esristaff.

From the post:

Landsat Viewer Demonstration

The lab has just completed an experimental viewer designed to sort, filter and extract individual Landsat scenes. The viewer is a web application developed using Esri‘s JavaScript API and a three.js-based external renderer.


Click here for the live application.

Click here for the source code.


The application has a wizard-like workflow. First, the user is prompted to sketch a bounding box representation the area of interest. The next step defines the imagery source and minimum selection criteria for the image scenes. For example, in the screenshot below the user is interested in any scene taken over the past 45+ years but those scenes must have 10% or less cloud cover.


Other Landsat resources:

Landsat homepage

Landsat FAQ

Landsat 7 Science Data Users Handbook

Landsat 8 Science Data Users Handbook

Enjoy!

I first saw this at: Landsat satellite imagery browser by Nathan Yau.

April 17, 2017

Every NASA Image In One Archive – Crowd Sourced Index?

Filed under: Astroinformatics,BigData,Image Processing,NASA,Science — Patrick Durusau @ 8:49 pm

NASA Uploaded Every Picture It Has to One Amazing Online Archive by Will Sabel Courtney.

From the post:

Over the last five decades and change, NASA has launched hundreds of men and women from the planet’s surface into the great beyond. But America’s space agency has had an emotional impact on millions, if not billions, of others who’ve never gone past the Karmann Line separating Earth from space, thanks to the images, audio, and video generated by its astronauts and probes. NASA has given us our best glimpses at distant galaxies and nearby planets—and in the process, helped up appreciate our own world even more.

And now, the agency has placed them all in one place for everyone to see: images.nasa.gov.

No, viewing this site will not be considered an excuse for a late tax return. 😉

On the other hand, it’s an impressive bit of work, although a search only interface seems a bit thin to me.

The API docs don’t offer much comfort:

Name Description
q (optional) Free text search terms to compare to all 
indexed metadata.
center (optional) NASA center which published the media.
description(optional) Terms to search for in “Description” fields.
keywords (optional) Terms to search for in “Keywords” fields. 
Separate multiple values with commas.
location (optional) Terms to search for in “Location” fields.
media_type(optional) Media types to restrict the search to. 
Available types: [“image”, “audio”]. 
Separate multiple values with commas.
nasa_id (optional) The media asset’s NASA ID.
photographer(optional) The primary photographer’s name.
secondary_creator(optional) A secondary photographer/videographer’s name.
title (optional) Terms to search for in “Title” fields.
year_start (optional) The start year for results. Format: YYYY.
year_end (optional) The end year for results. Format: YYYY.

With no index, your results depend on your blind guessing the metadata entered by a NASA staffer.

Well, for “moon” I would expect “the Moon,” but the results are likely to include moons of other worlds, etc.

Indexing this collection has all the marks of a potential crowd sourcing project:

  1. Easy to access data
  2. Free data
  3. Interesting data
  4. Metadata

Interested?

February 26, 2017

ForWarn: Satellite-Based Change Recognition and Tracking [Looking for Leaks/Spills/Mines]

Filed under: Environment,Government,Image Processing,Mapping,Maps — Patrick Durusau @ 2:52 pm

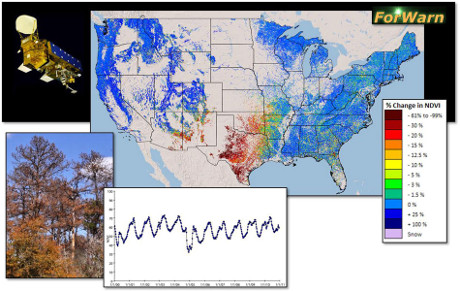
ForWarn: Satellite-Based Change Recognition and Tracking

From the introduction:

ForWarn is a vegetation change recognition and tracking system that uses high-frequency, moderate resolution satellite data. It provides near real-time change maps for the continental United States that are updated every eight days. These maps show the effects of disturbances such as wildfires, wind storms, insects, diseases, and human-induced disturbances in addition to departures from normal seasonal greenness caused by weather. Using this state of the art tracking system, it is also possible to monitor post-disturbance recovery and the cumulative effects of multiple disturbances over time.

This technology supports a broader cooperative management initiative known as the National Early Warning System (EWS). The EWS network brings together various organizations involved in mapping disturbances, climate stress, aerial and ground monitoring, and predictive efforts to achieve more efficient landscape planning and management across jurisdictions.

ForWarn consists of a set of inter-related products including near real time vegetation change maps, an archive of past change maps, an archive of seasonal vegetation phenology maps, and derived map products from these efforts. For a detailed discussion of these products, or to access these map products in the project’s Assessment Viewer or to explore these data using other GIS services, look through Data Access under the Products header.

  • ForWarn relies on daily eMODIS and MODIS satellite data
  • It tracks change in the Normalized Difference Vegetation Index (NDVI)
  • Coverage extends to all lands of the continental US
  • Products are at 232 meter resolution (13.3 acres or 5.4 hectares)
  • It has NDVI values for 46 periods per year (at 8-day intervals)
  • It uses a 24-day window with 8-day time steps to avoid clouds, etc.
  • The historical NDVI database used for certain baselines dates from 2000 to the present

Not everyone can be blocking pipeline construction and/or making DAPL the most-expensive non-operational (too many holes) pipeline in history.

Watching for leaks, discharges, and other environmental crimes as reflected in the surrounding environment is a valuable contribution as well.

All you need is a computer with an internet connection. Much of the heavy lifting has been done at no cost to you by ForWarn.

It occurs to me that surface mining operations and spoilage from them are likely to produce artifacts larger than 232 meter resolution. Yes?

Enjoy!

February 9, 2017

Turning Pixelated Faces Back Into Real Ones

Filed under: Image Processing,Image Recognition,Neural Networks — Patrick Durusau @ 1:32 pm

Google’s neural networks turn pixelated faces back into real ones by John E. Dunn.

From the post:

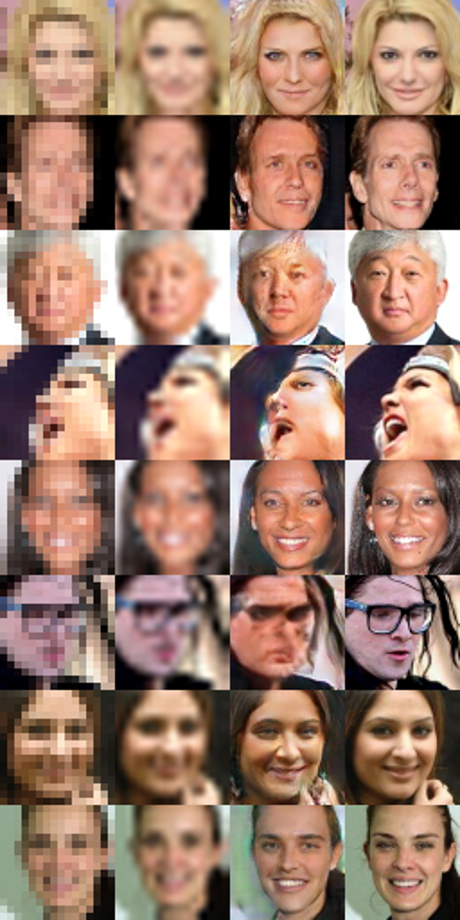
Researchers at Google Brain have come up with a way to turn heavily pixelated images of human faces into something that bears a usable resemblance to the original subject.

In a new paper, the company’s researchers describe using neural networks put to work at two different ends of what should, on the face of it, be an incredibly difficult problem to solve: how to resolve a blocky 8 x 8 pixel images of faces or indoor scenes containing almost no information?

It’s something scientists in the field of super resolution (SR) have been working on for years, using techniques such as de-blurring and interpolation that are often not successful for this type of image. As the researchers put it:

When some details do not exist in the source image, the challenge lies not only in “deblurring” an image, but also in generating new image details that appear plausible to a human observer.

Their method involves getting the first “conditioning” neural network to resize 32 x 32 pixel images down to 8 x 8 pixels to see if that process can find a point at which they start to match the test image.

John raises a practical objection:


The obvious practical application of this would be enhancing blurry CCTV images of suspects. But getting to grips with real faces at awkward angles depends on numerous small details. Emphasise the wrong ones and police could end up looking for the wrong person.

True but John presumes the “suspects” are unknown. That’s true for the typical convenience store robbery on the 10 PM news but not so for “suspects” under intentional surveillance.

In those cases, multiple ground truth images from a variety of angles are likely to be available.

November 13, 2016

Intro to Image Processing

Filed under: Image Processing,Image Recognition,Image Understanding,OpenCV — Patrick Durusau @ 5:03 pm

Intro to Image Processing by Eric Schles.

A short but useful introduction to some, emphasis on some, of the capabilities of OpenCV.

Understanding image processing will make you a better consumer and producer of digital imagery.

To its great surprise, the “press” recently re-discovered government isn’t to be trusted.

The same is true for the “press.”

Develop your capability to judge images offered by any source.

September 30, 2016

Introducing the Open Images Dataset

Filed under: Image Processing,Image Recognition,Image Understanding,Machine Learning — Patrick Durusau @ 8:10 pm

Introducing the Open Images Dataset by Ivan Krasin and Tom Duerig.

From the post:

In the last few years, advances in machine learning have enabled Computer Vision to progress rapidly, allowing for systems that can automatically caption images to apps that can create natural language replies in response to shared photos. Much of this progress can be attributed to publicly available image datasets, such as ImageNet and COCO for supervised learning, and YFCC100M for unsupervised learning.

Today, we introduce Open Images, a dataset consisting of ~9 million URLs to images that have been annotated with labels spanning over 6000 categories. We tried to make the dataset as practical as possible: the labels cover more real-life entities than the 1000 ImageNet classes, there are enough images to train a deep neural network from scratch and the images are listed as having a Creative Commons Attribution license*.

The image-level annotations have been populated automatically with a vision model similar to Google Cloud Vision API. For the validation set, we had human raters verify these automated labels to find and remove false positives. On average, each image has about 8 labels assigned. Here are some examples:

Impressive data set, if you want to recognize a muffin, gherkin, pebble, etc., see the full list at dict.csv.

Hopeful the techniques you develop with these images will lead to more focused image recognition. 😉

I lightly searched the list and no “non-safe” terms jumped out at me. Suitable for family image training.

August 28, 2016

srez: Image super-resolution through deep learning

Filed under: Deep Learning,Image Processing,Image Recognition — Patrick Durusau @ 3:46 pm

srez: Image super-resolution through deep learning. by David Garcia.

From the webpage:

Image super-resolution through deep learning. This project uses deep learning to upscale 16×16 images by a 4x factor. The resulting 64×64 images display sharp features that are plausible based on the dataset that was used to train the neural net.

Here’s an random, non cherry-picked, example of what this network can do. From left to right, the first column is the 16×16 input image, the second one is what you would get from a standard bicubic interpolation, the third is the output generated by the neural net, and on the right is the ground truth.

srez_sample_output-460

Once you have collected names, you are likely to need image processing.

Here’s an interesting technique using deep learning. Face on at the moment but you can expect that to improve.

July 19, 2016

Proofing Images Tool – GAIA

As I was writing on Alex Duner’s JuxtaposeJS, which creates a slider over two images of the same scene (think before/after), I thought of another tool for comparing photos, a blink comparator.

Blink comparators were invented to make searching photographs of sky images, taken on different nights, for novas, variable stars or planets/asteroids, more efficient. The comparator would show first one image and then the other, rapidly, and any change in the image would stand out to the user. Asteroids would appear to “jump” from one location to another. Variable stars would shrink and swell. Novas would blink in and out.

Originally complex mechanical devices using glass plates, blink comparators are now found in astronomical image processing software, such as:
GAIA – Graphical Astronomy and Image Analysis Tool.

From the webpage:

GAIA is an highly interactive image display tool but with the additional capability of being extendable to integrate other programs and to manipulate and display data-cubes. At present image analysis extensions are provided that cover the astronomically interesting areas of aperture & optimal photometry, automatic source detection, surface photometry, contouring, arbitrary region analysis, celestial coordinate readout, calibration and modification, grid overlays, blink comparison, image defect patching, polarization vector plotting and the ability to connect to resources available in Virtual Observatory catalogues and image archives, as well as the older Skycat formats.

GAIA also features tools for interactively displaying image planes from data-cubes and plotting spectra extracted from the third dimension. It can also display 3D visualisations of data-cubes using iso-surfaces and volume rendering.

It’s capabilities include:

  • Image Display Capabilities
    • Display of images in FITS and Starlink NDF formats.
    • Panning, zooming, data range and colour table changes.
    • Continuous display of the cursor position and image data value.
    • Display of many images.
    • Annotation, using text and line graphics (boxes, circles, polygons, lines with arrowheads, ellipses…).
    • Printing.
    • Real time pixel value table.
    • Display of image planes from data cubes.
    • Display of point and region spectra extracted from cubes.
    • Display of images and catalogues from SAMP-aware applications.
    • Selection of 2D or 3D regions using an integer mask.
  • Image Analysis Capabilities
    • Aperture photometry.
    • Optimal photometry.
    • Automated object detection.
    • Extended surface photometry.
    • Image patching.
    • Arbitrary shaped region analysis.
    • Contouring.
    • Polarization vector plotting and manipulation.
    • Blink comparison of displayed images.
    • Interactive position marking.
    • Celestial co-ordinates readout.
    • Astrometric calibration.
    • Astrometric grid overlay.
    • Celestial co-ordinate system selection.
    • Sky co-ordinate offsets.
    • Real time profiling.
    • Object parameterization.
  • Catalogue Capabilities
    • VO capabilities
      • Cone search queries
      • Simple image access queries
    • Skycat capabilities
      • Plot positions in your field from a range of on-line catalogues (various, including HST guide stars).
      • Query databases about objects in field (NED and SIMBAD).
      • Display images of any region of sky (Digital Sky Survey).
      • Query archives of any observations available for a region of sky (HST, NTT and CFHT).
      • Display positions from local catalogues (allows selection and fine control over appearance of positions).
  • 3D Cube Handling
    • Display of image slices from NDF and FITS cubes.
    • Continuous extraction and display of spectra.
    • Collapsing, animation, detrending, filtering.
    • 3D visualisation with iso-surfaces and volume rendering.
    • Celestial, spectral and time coordinate handling.
  • CUPID catalogues and masks
    • Display catalogues in 2 or 3D
    • Display selected regions of masks in 2 or 3D

(highlighting added)

With a blink comparator, when offered an image you can quickly “proof” it against an earlier image of the same scene, looking for any enhancements or changes.

Moreover, if you have drone-based photo-reconnaissance images, a tool like GAIA will give you the capability to quickly compare them to other images.

I am hopeful you will also use this as an opportunity to explore the processing of astronomical images, which is an innocent enough explanation for powerful image processing software on your computer.

April 2, 2016

2.95 Million Satellite Images (Did I mention free?)

Filed under: Cartography,Image Processing,Image Understanding,Maps — Patrick Durusau @ 8:40 pm

NASA just released 2.95 million satellite images to the public — here are 21 of the best by Rebecca Harrington.

From the post:

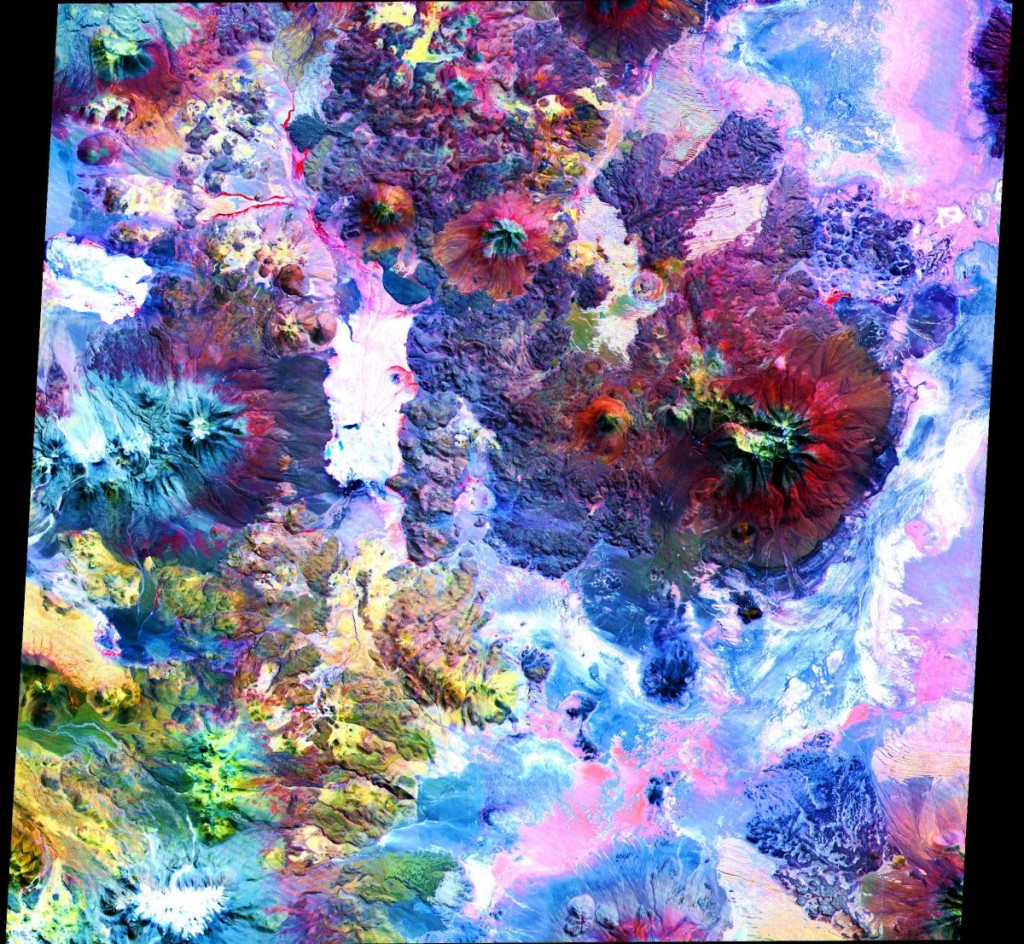
An instrument called the Advanced Spaceborne Thermal Emission and Reflection Radiometer — or ASTER, for short — has been taking pictures of the Earth since it launched into space in 1999.

In that time, it has photographed an incredible 99% of the planet’s surface.

Although it’s aboard NASA’s Terra spacecraft, ASTER is a Japanese instrument and most of its data and images weren’t free to the public — until now.

NASA announced April 1 that ASTER’s 2.95 million scenes of our planet are now ready-to-download and analyze for free.

With 16 years’ worth of images, there are a lot to sort through.

One of Rebecca’s favorites:

andes-mountains

You really need to select that image and view it at full size. I promise.

The Andes Mountains. Colors reflect changes in surface temperature, materials and elevation.

March 26, 2016

Revealing the Hidden Patterns of News Photos:… [Uncovers Anti-Sanders Bias]

Filed under: Deep Learning,GDELT,Image Processing,Politics — Patrick Durusau @ 8:52 pm

Revealing the Hidden Patterns of News Photos: Analysis of Millions of News Photos through GDELT and Deep Learning-based Vision APIs by Haewoon Kwak and Jisun An.

Abstract:

In this work, we analyze more than two million news photos published in January 2016. We demonstrate i) which objects appear the most in news photos; ii) what the sentiments of news photos are; iii) whether the sentiment of news photos is aligned with the tone of the text; iv) how gender is treated; and v) how differently political candidates are portrayed. To our best knowledge, this is the first large-scale study of news photo contents using deep learning-based vision APIs.

Not that bias-free news is possible, but deep learning appears to be useful in foregrounding bias against particular candidates:


We then conducted a case study of assessing the portrayal of Democratic and Republican party presidential candidates in news photos. We found that all the candidates but Sanders had a similar proportion of being labeled as an athlete, which is typically associates with a victory pose or a sharp focus on a face with blurred background. Pro-Clinton media recognized by their endorsements show the same tendency; their Sanders photos are not labeled as an athlete at all. Furthermore, we found that Clinton expresses joy more than Sanders does in the six popular news media. Similarly. pro-Clinton media shows a higher proportion of Clinton expressing joy than Sanders.

If the requirement is an “appearance” of lack of bias, the same techniques enable the monitoring/shaping of your content to prevent your bias from being discovered by others.

Data scientists who can successfully wield this framework will be in high demand for political campaigns.

February 16, 2016

Katia – rape screening in R

Filed under: Image Processing,Image Recognition,R — Patrick Durusau @ 8:54 pm

Katia – rape screening in R

From the webpage:

It’s Not Enough to Condemn Violence Against Women. We Need to End It.

All 12 innocent female victims above were atrociously killed, sexually assaulted, or registered missing after meeting strangers on mainstream dating, personals, classifieds, or social networking services.

INTRODUCTION TO THE KATIA RAPE SCREEN

Those 12 beautiful faces in the gallery above, are our sisters and daughters. Looking at their pictures is like looking through a tiny pinhole onto an unprecedented rape and domestic violence crisis that is destroying the American family unit.

Verified by science, the KATIA rape screen, coded in the computer programming language, R, can provably stop a woman from ever meeting her attacker.

The technology is named after a RAINN-counseled first degree aggravated rape survivor named Katia.

It is based on the work of a Google engineer from the Reverse Image Search project and a RAINN (Rape, Abuse & Incest National Network) counselor, with a clinical background in mathematical statistics, who has over a period of 15 years compiled a linguistic pattern analysis of the messages that rapists use to lure women online.

Learn more about the science behind Katia.

This project is taking concrete steps to reduce violence against women.

What more is there to say?

January 16, 2016

The Student, the Fish, and Agassiz [Viewing Is Not Seeing]

Filed under: Image Processing,Image Understanding,Journalism,News,Reporting — Patrick Durusau @ 8:02 pm

The Student, the Fish, and Agassiz by Samuel H. Scudder.

I was reminded of this story by Jenni Sargent’s Piecing together visual clues for verification.

Like Jenni, I assume that we can photograph, photo-copy or otherwise image anything of interest. Quickly.

But in quickly creating images, we also created the need to skim images, missing details that longer study would capture.

You should read the story in full but here’s enough to capture your interest:

It was more than fifteen years ago that I entered the laboratory of Professor Agassiz, and told him I had enrolled my name in the scientific school as a student of natural history. He asked me a few questions about my object in coming, my antecedents generally, the mode in which I afterwards proposed to use the knowledge I might acquire, and finally, whether I wished to study any special branch. To the latter I replied that while I wished to be well grounded in all departments of zoology, I purposed to devote myself specially to insects.

“When do you wish to begin?” he asked.

“Now,” I replied.

This seemed to please him, and with an energetic “Very well,” he reached from a shelf a huge jar of specimens in yellow alcohol.

“Take this fish,” he said, “and look at it; we call it a Haemulon; by and by I will ask what you have seen.”

In ten minutes I had seen all that could be seen in that fish, and started in search of the professor, who had, however, left the museum; and when I returned, after lingering over some of the odd animals stored in the upper apartment, my specimen was dry all over. I dashed the fluid over the fish as if to resuscitate it from a fainting-fit, and looked with anxiety for a return of a normal, sloppy appearance. This little excitement over, nothing was to be done but return to a steadfast gaze at my mute companion. Half an hour passed, an hour, another hour; the fish began to look loathsome. I turned it over and around; looked it in the face — ghastly; from behind, beneath, above, sideways, at a three-quarters view — just as ghastly. I was in despair; at an early hour, I concluded that lunch was necessary; so with infinite relief, the fish was carefully replaced in the jar, and for an hour I was free.

On my return, I learned that Professor Agassiz had been at the museum, but had gone and would not return for several hours. My fellow students were too busy to be disturbed by continued conversation. Slowly I drew forth that hideous fish, and with a feeling of desperation again looked at it. I might not use a magnifying glass; instruments of all kinds were interdicted. My two hands, my two eyes, and the fish; it seemed a most limited field. I pushed my fingers down its throat to see how sharp its teeth were. I began to count the scales in the different rows until I was convinced that that was nonsense. At last a happy thought struck me — I would draw the fish; and now with surprise I began to discover new features in the creature. Just then the professor returned.

“That is right said he, “a pencil is one of the best eyes. I am glad to notice, too, that you keep your specimen wet and your bottle corked.”

The student spends many more hours with the same fish but you need to read the account for yourself to fully appreciate it. There are other versions of the story which have been gathered here.

Two questions:

  • When was the last time you spent even ten minutes looking at a photograph or infographic?
  • When was the last time you tried drawing a copy of an image to make sure you are “seeing” all the detail an image has to offer?

I don’t offer myself as a model as “I can’t recall” is my answer to both questions.

In a world awash in images, shouldn’t we all be able to give a better answer than that?


Some addition resources on drawing versus photography.

Why We Should Draw More (and Photograph Less) – School of Life.

Why you should stop taking pictures on your phone – and learn to draw

The Elements of Drawing, in Three Letters to Beginners by John Ruskin

BTW, Ruskin was no Luddite of the mid-nineteenth century. He was an early adopter of photography to document the architecture of Venice.

How many images do you “view” in a day without really “seeing” them?

January 13, 2016

Automatically Finding Weapons…

Filed under: Image Processing,Image Recognition,Intelligence,Open Source Intelligence — Patrick Durusau @ 8:35 pm

Automatically Finding Weapons in Social Media Images Part 1 by Justin Seitz.

From the post:

As part of my previous post on gangs in Detroit, one thing had struck me: there are an awful lot of guns being waved around on social media. Shocker, I know. More importantly I began to wonder if there wasn’t a way to automatically identify when a social media post has guns or other weapons contained in them. This post will cover how to use a couple of techniques to send images to the Imagga API that will automatically tag pictures with keywords that it feels accurately describe some of the objects contained within the picture. As well, I will teach you how to use some slicing and dicing techniques in Python to help increase the accuracy of the tagging. Keep in mind that I am specifically looking for guns or firearm-related keywords, but you can easily just change the list of keywords you are interested in and try to find other things of interest like tanks, or rockets.

This blog post will cover how to handle the image tagging portion of this task. In a follow up post I will cover how to pull down all Tweets from an account and extract all the images that the user has posted (something my students do all the time!).

This rocks!

Whether you are trying to make contact with a weapon owner who isn’t in the “business” of selling guns or if you are looking for like-minded individuals, this is a great post.

Would make an interesting way to broadly tag images for inclusion in group subjects in a topic map, awaiting further refinement by algorithm or humans.

This is a great blog to follow: Automating OSINT.

January 8, 2016

Image Error Level Analyser [Read: Detects Fake Photos]

Filed under: Image Processing,News,Verification — Patrick Durusau @ 11:49 am

Image Error Level Analyser by Jonas Wagner.

From the webpage:

I created a new, better tool to analyze digital images. It’s also free and web based. It features error level analysis, clone detection and more. You should try it right now.

Image error level analysis is a technique that can help to identify manipulations to compressed (JPEG) images by detecting the distribution of error introduced after resaving the image at a specific compression rate. You can find some more information about this tequnique in my blog post about this experiment and in this presentation by Neal Krawetz which served as the inspiration for this project. He also has a nice tutorial on how to interpret the results. Please do not take the results of this tool to seriously. It’s more of a toy than anything else.

Doug Mahugh pointed me to this resource in response to a post on detecting fake photos.

Now you don’t have to wait for the National Enquirer to post a photo of the current president shaking hands with aliens. With a minimum of effort you can, and people do, flood the Internet with fake photos.

Some fakes you can spot without assistance, Donald Trump being polite for instance, but other images will be more challenging. That’s where tools such as this one will save you the embarrassment of passing on images everyone but you knows are fakes.

Enjoy!

November 24, 2015

20 Years of GIMP, release of GIMP 2.8.16 [Happy Anniversary GIMP!]

Filed under: GIMP,Image Processing — Patrick Durusau @ 4:51 pm

20 Years of GIMP, release of GIMP 2.8.16

From the post:

This week the GIMP project celebrates its 20th anniversary.

Back in 1995, University of California students, Peter Mattis and Kimball Spencer, were members of the eXperimental Computing Facility, a Berkeley campus organization of undergraduate students enthusiastic about computers and programming. In June of that year, the two hinted at their intentions to write a free graphical image manipulation program as a means of giving back to the free software community.

On November 21st, 20 years ago today, Peter Mattis announced the availability of the “General Image Manipulation Program” on Usenet (later on, the acronym would be redefined to stand for the “GNU Image Manipulation Program”).

Drop by the GIMP homepage and grab a copy of GIMP 2.8.16 to celebrate!

Enjoy!

November 12, 2015

Visualizing What Your Computer (and Science) Ignore (mostly)

Filed under: Computer Science,Geometry,Image Processing,Image Understanding,Physics — Patrick Durusau @ 8:01 pm

Deviation Magnification: Revealing Departures from Ideal Geometries by Neal Wadhwa, Tali Dekel, Donglai Wei, Frédo Durand, William T. Freeman.

Abstract:

Structures and objects are often supposed to have idealized geome- tries such as straight lines or circles. Although not always visible to the naked eye, in reality, these objects deviate from their idealized models. Our goal is to reveal and visualize such subtle geometric deviations, which can contain useful, surprising information about our world. Our framework, termed Deviation Magnification, takes a still image as input, fits parametric models to objects of interest, computes the geometric deviations, and renders an output image in which the departures from ideal geometries are exaggerated. We demonstrate the correctness and usefulness of our method through quantitative evaluation on a synthetic dataset and by application to challenging natural images.

The video for the paper is quite compelling:

Read the full paper here: http://people.csail.mit.edu/nwadhwa/deviation-magnification/DeviationMagnification.pdf

From the introduction to the paper:

Many phenomena are characterized by an idealized geometry. For example, in ideal conditions, a soap bubble will appear to be a perfect circle due to surface tension, buildings will be straight and planetary rings will form perfect elliptical orbits. In reality, however, such flawless behavior hardly exists, and even when invisible to the naked eye, objects depart from their idealized models. In the presence of gravity, the bubble may be slightly oval, the building may start to sag or tilt, and the rings may have slight perturbations due to interactions with nearby moons. We present Deviation Magnification, a tool to estimate and visualize such subtle geometric deviations, given only a single image as input. The output of our algorithm is a new image in which the deviations from ideal are magnified. Our algorithm can be used to reveal interesting and important information about the objects in the scene and their interaction with the environment. Figure 1 shows two independently processed images of the same house, in which our method automatically reveals the sagging of the house’s roof, by estimating its departure from a straight line.

Departures from “idealized geometry” make for captivating videos but there is a more subtle point that Deviation Magnification will help bring to the fore.

“Idealized geometry,” just like discrete metrics for attitude measurement or metrics of meaning, etc. are all myths. Useful myths as houses don’t (usually) fall down, marketing campaigns have a high degree of success, and engineering successfully relies on approximations that depart from the “real world.”

Science and computers have a degree of precision that has no counterpart in the “real world.”

Watch the video again if you doubt that last statement.

Whether you are using science and/or a computer, always remember that your results are approximations based upon approximations.

I first saw this in Four Short Links: 12 November 2015 by Nat Torkington.

October 25, 2015

What a Deep Neural Network thinks about your #selfie

Filed under: Image Processing,Image Recognition,Machine Learning,Neural Networks — Patrick Durusau @ 8:02 pm

What a Deep Neural Network thinks about your #selfie by Andrej Karpathy.

From the post:

Convolutional Neural Networks are great: they recognize things, places and people in your personal photos, signs, people and lights in self-driving cars, crops, forests and traffic in aerial imagery, various anomalies in medical images and all kinds of other useful things. But once in a while these powerful visual recognition models can also be warped for distraction, fun and amusement. In this fun experiment we’re going to do just that: We’ll take a powerful, 140-million-parameter state-of-the-art Convolutional Neural Network, feed it 2 million selfies from the internet, and train it to classify good selfies from bad ones. Just because it’s easy and because we can. And in the process we might learn how to take better selfies 🙂

A must read for anyone interested in deep neural networks and image recognition!

Selfies provide abundant and amusing data to illustrate neural network techniques that are being used every day.

Andrej provides numerous pointers to additional materials and references on neural networks. Good think considering how much interest his post is going to generate!

October 22, 2015

“The first casualty, when war comes, is truth”

Filed under: Government,Image Processing,Image Recognition — Patrick Durusau @ 7:47 pm

The quote, “The first casualty, when war comes, is truth,” is commonly attributed to Hiram Johnson a Republican politician from California in 1917. Johnson died on August 6, 1945, the day the United States dropped an atomic bomb on Hiroshima.

The ARCADE: Artillery Crater Analysis and Detection Engine is an effort to make it possible for anyone to rescue bits of the truth, even during war, at least with regard to the use of military ordinance.

From the post:

Destroyed buildings and infrastructure, temporary settlements, terrain disturbances and other signs of conflict can be seen in freely available satellite imagery. The ARtillery Crater Analysis and Detection Engine (ARCADE) is experimental computer vision software developed by Rudiment and the Centre for Visual Computing at the University of Bradford. ARCADE examines satellite imagery for signs of artillery bombardment, calculates the location of artillery craters, the inbound trajectory of projectiles to aid identification of their possible origins of fire. An early version of the tool that demonstrates the core capabilities is available here.

The software currently runs on Windows with MATLAB, but if there is enough interest, it could be ported to an open toolset built around OpenCV.

Everyone who is interested in military actions anywhere in the world should be a supporter of this project.

Given the poverty of Western reporting on bombings by the United States government around the world, I am very interested in the success of this project.

The post is a great introduction to the difficulties and potential uses of satellite data to uncover truths governments would prefer to remain hidden. That alone should be enough justification for supporting this project.

August 21, 2015

Images for Social Media

Filed under: Graphics,Image Processing,Social Media — Patrick Durusau @ 8:02 pm

23 Tools and Resources to Create Images for Social Media

From the post:

Through experimentation and iteration, we’ve found that including images when sharing to social media increases engagement across the board — more clicks, reshares, replies, and favorites.

Using images in social media posts is well worth trying with your profiles.

As a small business owner or a one-man marketing team, is this something you can pull off by yourself?

At Buffer, we create all the images for our blogposts and social media sharing without any outside design help. We rely on a handful of amazing tools and resources to get the job done, and I’ll be happy to share with you the ones we use and the extras that we’ve found helpful or interesting.

If you tend to scroll down numbered lists (like I do), you will be left thinking the creators of the post don’t know how to count:

23-tools

because:

15-app

the end of the numbered list, isn’t 23.

If you look closely, there are several lists of unnumbered resources. So, you’re thinking that they do know how to count, but some of the items are unnumbered.

Should be, but it’s not. There are thirteen (13) unnumbered items, which added to fifteen (15), makes twenty-eight (28).

So, I suspect the title should read: 28 Tools and Resources to Create Images for Social Media.

In any event, its a fair collection of tools that with some effort on your part, can increase your social media presence.

Enjoy!

June 14, 2015

CVPR 2015 Papers

CVPR [Computer Vision and Pattern Recognition] 2015 Papers by @karpathy.

This is very cool!

From the webpage:

Below every paper are TOP 100 most-occuring words in that paper and their color is based on LDA topic model with k = 7.
(It looks like 0 = datasets?, 1 = deep learning, 2 = videos , 3 = 3D Computer Vision , 4 = optimization?, 5 = low-level Computer Vision?, 6 = descriptors?)

You can sort by LDA topics, view the PDFs, rank the other papers by tf-idf similarity to a particular paper.

Very impressive and suggestive of other refinements for viewing a large number of papers in a given area.

Enjoy!

May 22, 2015

Project Naptha

Filed under: Image Processing,OCR — Patrick Durusau @ 10:18 am

Project Naptha – highlight, copy, and translate text from any image by Kevin Kwok.

From the webpage:

Project Naptha automatically applies state-of-the-art computer vision algorithms on every image you see while browsing the web. The result is a seamless and intuitive experience, where you can highlight as well as copy and paste and even edit and translate the text formerly trapped within an image.

The homepage has examples of Project Naptha being used on comics, scans, photos, diagrams, Internet memes, screenshots, along with sneak peeks at beta features, such as translation, erase text (from images) and change text. (You can select multiple regions with the shift key.)

This should be especially useful for journalists, bloggers, researchers, basically anyone who spends a lot of time looking for content on the Web.

If the project needs a slogan, I would suggest:

Naptha Frees Information From Image Prisons!

April 21, 2015

Imagery Processing Pipeline Launches!

Filed under: Geographic Data,Geography,Geophysical,Image Processing,Maps — Patrick Durusau @ 7:37 pm

Imagery Processing Pipeline Launches!

From the post:

Our imagery processing pipeline is live! You can search the Landsat 8 imagery catalog, filter by date and cloud coverage, then select any image. The image is instantly processed, assembling bands and correcting colors, and loaded into our API. Within minutes you will have an email with a link to the API end point that can be loaded into any web or mobile application.

Our goal is to make it fast for anyone to find imagery for a news story after a disaster, easy for any planner to get the the most recent view of their city, and any developer to pull in thousands of square KM of processed imagery for their precision agriculture app. All directly using our API

There are two ways to get started: via the imagery browser fetch.astrodigital.com, or directly via the the Search and Publish APIs. All API documentation is on astrodigital.com/api. You can either use the API to programmatically pull imagery though the pipeline or build your own UI on top of the API, just like we did.

The API provides direct access to more than 300TB of satellite imagery from Landsat 8. Early next year we’ll make our own imagery available once our own Landmapper constellation is fully commissioned.

Hit us up @astrodigitalgeo or sign up at astrodigital.com to follow as we build. Huge thanks to our partners at Development Seed who is leading our development and for the infinitively scalable API from Mapbox.

If you are interested in Earth images, you really need to check this out!

I haven’t tried the API but did get a link to an image of my city and surrounding area.

Definitely worth a long look!

March 7, 2015

RawTherapee

Filed under: Image Processing,Topic Maps,Visualization — Patrick Durusau @ 4:41 pm

RawTherapee

From the RawPedia (Getting Started)

RawTherapee is a cross-platform raw image processing program, released under the GNU General Public License Version 3. It was originally written by Gábor Horváth of Budapest. Rather than being a raster graphics editor such as Photoshop or GIMP, it is specifically aimed at raw photo post-production. And it does it very well – at a minimum, RawTherapee is one of the most powerful raw processing programs available. Many of us would make bigger claims…

At intervals of more than a month but not much more than two months, there is a Play Raw competition with an image and voting (plus commentary along the way).

Very impressive!

Thoughts on topic map competitions?

I first saw this in a tweet by Neil Saunders.

December 9, 2014

The Coming Era of Egocentric Video Analysis

Filed under: Identifiers,Identity,Image Processing,Privacy — Patrick Durusau @ 3:58 pm

The Coming Era of Egocentric Video Analysis

From the post:

Head-mounted cameras are becoming de rigueur for certain groups—extreme sportsters, cyclists, law enforcement officers, and so on. It’s not hard to find content generated in this way on the Web.

So it doesn’t take a crystal ball to predict that egocentric recording is set to become ubiquitous as devices such as Go-Pros and Google Glass become more popular. An obvious corollary to this will be an explosion of software for distilling the huge volumes of data this kind of device generates into interesting and relevant content.

Today, Yedid Hoshen and Shmuel Peleg at the Hebrew University of Jerusalem in Israel reveal one of the first applications. Their goal: to identify the filmmaker from biometric signatures in egocentric videos.

A tidbit that I was unaware of:

Some of these are unique, such as the gait of the filmmaker as he or she walks, which researchers have long known is a remarkably robust biometric indicator.”Although usually a nuisance, we show that this information can be useful for biometric feature extraction and consequently for identifying the user,” say Hoshen and Peleg.

Makes me wonder if I should wear a prosthetic device to alter my gait when I do appear in range of cameras. 😉

Works great with topic maps. All you may know about an actor is that they have some gait with X characteristics. And a perchance for not getting caught planting explosive devices. With a topic map we can keep their gait as a subject identifier and record all the other information we have on such an individual.

If we ever match the gait to a known individual, then the information from both records, both as the anonymous gait owner and the known known individual will be merged together.

It works with other characteristics as well, which enables you to work from “I was attacked…,” to more granular information that narrows the pool of suspects down to a manageable size.

Traditionally the job of veterans on the police force who know their communities and who are the usual suspects but a topic map enhances their value by capturing their observations for use by the department long after a veterans retirement.

From arXiv: Egocentric Video Biometrics

Abstract:

Egocentric cameras are being worn by an increasing number of users, among them many security forces worldwide. GoPro cameras already penetrated the mass market, and Google Glass may follow soon. As head-worn cameras do not capture the face and body of the wearer, it may seem that the anonymity of the wearer can be preserved even when the video is publicly distributed.
We show that motion features in egocentric video provide biometric information, and the identity of the user can be determined quite reliably from a few seconds of video. Biometrics are extracted by training Convolutional Neural Network (CNN) architectures on coarse optical flow.

Egocentric video biometrics can prevent theft of wearable cameras by locking the camera when worn by people other than the owner. In video sharing services, this Biometric measure can help to locate automatically all videos shot by the same user. An important message in this paper is that people should be aware that sharing egocentric video will compromise their anonymity.

Now if we could just get members of Congress to always carry their cellphones and wear body cameras.

November 23, 2014

Show and Tell: A Neural Image Caption Generator

Filed under: Image Processing,Image Recognition,Image Understanding — Patrick Durusau @ 10:53 am

Show and Tell: A Neural Image Caption Generator by Oriol Vinyals, Alexander Toshev, Samy Bengio, Dumitru Erhan.

Abstract:

Automatically describing the content of an image is a fundamental problem in artificial intelligence that connects computer vision and natural language processing. In this paper, we present a generative model based on a deep recurrent architecture that combines recent advances in computer vision and machine translation and that can be used to generate natural sentences describing an image. The model is trained to maximize the likelihood of the target description sentence given the training image. Experiments on several datasets show the accuracy of the model and the fluency of the language it learns solely from image descriptions. Our model is often quite accurate, which we verify both qualitatively and quantitatively. For instance, while the current state-of-the-art BLEU score (the higher the better) on the Pascal dataset is 25, our approach yields 59, to be compared to human performance around 69. We also show BLEU score improvements on Flickr30k, from 55 to 66, and on SBU, from 19 to 27.

Another caption generating program for images. (see also, Deep Visual-Semantic Alignments for Generating Image Descriptions) Not quite to the performance of a human observer but quite respectable. The near misses are amusing enough for crowd correction to be an element in a full blown system.

Perhaps “rough recognition” is close enough for some purposes. Searching images for people who match a partial description and producing a much smaller set for additional processing.

I first saw this in Nat Torkington’s Four short links: 18 November 2014.

Older Posts »

Powered by WordPress