Another Word For It Patrick Durusau on Topic Maps and Semantic Diversity

October 7, 2019

TLP:GREEN Leak to Lossen Your Bowels

Filed under: Classification,Government,Security — Patrick Durusau @ 4:45 pm

Zak Doffman in FBI Issues Surprise New Cyber Attack Warning posted a link to: Cyber Criminals Use Social Engineering and Technical Attacks to Circumvent Multi-Factor Authentication, which is clearly marked:

TLP:GREEN:

This PIN has been released TLP:GREEN: The information in this product is useful for the awareness of all participating organizations within their sector or community, but should not be shared via publicly accessible channels.

Do you think Forbes.com qualifies as a “publicly accessible channel?”

I ask just to highlight the absurdity of information restriction that has taken over government and cybersecurity in general. Notice that the evils doers in this scenario are already informed and the only people left uninformed, are members of the public.

I’m sure someone at the FBI has the authority to assign TPL:GREEN classification, but not anything lower or higher, plus they have auditing routines to check their work, monthly reports, etc. Now imagine all the turf protection and routines that must go on for other security classifications. All to hide information from the voting public.

Ask your 2020 candidates to sweep away all but launch code and location of nuclear submarine secrecy. It’s not like a modern army can conceal its intentions to invade. Think of all the classification staff that will become availabe to fill the front ranks.

November 5, 2015

Hopping on the Deep Learning Bandwagon

Filed under: Classification,Deep Learning,Machine Learning,Music — Patrick Durusau @ 3:51 pm

Hopping on the Deep Learning Bandwagon by Yanir Seroussi.

From the post:

I’ve been meaning to get into deep learning for the last few years. Now, the stars having finally aligned and I have the time and motivation to work on a small project that will hopefully improve my understanding of the field. This is the first in a series of posts that will document my progress on this project.

As mentioned in a previous post on getting started as a data scientist, I believe that the best way of becoming proficient at solving data science problems is by getting your hands dirty. Despite being familiar with high-level terminology and having some understanding of how it all works, I don’t have any practical experience applying deep learning. The purpose of this project is to fix this experience gap by working on a real problem.

The problem: Inferring genre from album covers

Deep learning has been very successful at image classification. Therefore, it makes sense to work on an image classification problem for this project. Rather than using an existing dataset, I decided to make things a bit more interesting by building my own dataset. Over the last year, I’ve been running BCRecommender – a recommendation system for Bandcamp music. I’ve noticed that album covers vary by genre, though it’s hard to quantify exactly how they vary. So the question I’ll be trying to answer with this project is how accurately can genre be inferred from Bandcamp album covers?

As the goal of this project is to learn about deep learning rather than make a novel contribution, I didn’t do a comprehensive search to see whether this problem has been addressed before. However, I did find a recent post by Alexandre Passant that describes his use of Clarifai’s API to tag the content of Spotify album covers (identifying elements such as men, night, dark, etc.), and then using these tags to infer the album’s genre. Another related project is Karayev et al.’s Recognizing image style paper, in which the authors classified datasets of images from Flickr and Wikipedia by style and art genre, respectively. In all these cases, the results are pretty good, supporting my intuition that the genre inference task is feasible.

Yanir continues this adventure into deep learning with: Learning About Deep Learning Through Album Cover Classification. And you will want to look over his list of Deep Learning Resources.

Yanir’s observation that the goal of the project was “…to learn about deep learning rather than make a novel contribution…” is an important one.

The techniques and lessons you learn may be known to others but they will be new to you.

June 30, 2015

Perceptual feature-based song genre classification using RANSAC [Published?]

Filed under: Classification,Classifier,Music,Music Retrieval — Patrick Durusau @ 1:59 pm

Perceptual feature-based song genre classification using RANSAC by Arijit Ghosal; Rudrasis Chakraborty; Bibhas Chandra Dhara; Sanjoy Kumar Saha. International Journal of Computational Intelligence Studies (IJCISTUDIES), Vol. 4, No. 1, 2015.

Abstract:

In the context of a content-based music retrieval system or archiving digital audio data, genre-based classification of song may serve as a fundamental step. In the earlier attempts, researchers have described the song content by a combination of different types of features. Such features include various frequency and time domain descriptors depicting the signal aspects. Perceptual aspects also have been combined along with. A listener perceives a song mostly in terms of its tempo (rhythm), periodicity, pitch and their variation and based on those recognises the genre of the song. Motivated by this observation, in this work, instead of dealing with wide range of features we have focused only on the perceptual aspect like melody and rhythm. In order to do so audio content is described based on pitch, tempo, amplitude variation pattern and periodicity. Dimensionality of descriptor vector is reduced and finally, random sample and consensus (RANSAC) is used as the classifier. Experimental result indicates the effectiveness of the proposed scheme.

A new approach to classification of music, but that’s all I can say since the content is behind a pay-wall.

One way to increase the accessibility of texts would be for tenure committees to not consider publications as “published” until they are freely available for the author’s webpage.

That one change could encourage authors to press for the right to post their own materials and to follow through with posting them as soon as possible.

Feel free to forward this post to members of your local tenure committee.

March 6, 2015

Linear SVM Classifier on Twitter User Recognition

Filed under: Classification,Machine Learning,Python,Support Vector Machines — Patrick Durusau @ 6:52 pm

Linear SVM Classifier on Twitter User Recognition by Leon van Bokhorst.

From the post:

Support Vector Machines (SVM) are very useful and popular in data classification, regression and outlier detection. This advanced supervised machine learning algorithm can quickly become very complex and hard to understand, but can lead to great results. In the example we train a linear SVM to detect and predict who’s the writer of a tweet.

Nice weekend type project, Python, iPython notebook, 400 tweets (I think Leon is right, the sample is too small), but an opportunity to “arm up the switches and dial in the mils.”

Enjoy!

While you are there, you should look around Leon’s blog. A number of interesting posts on statistics using Python.

January 26, 2015

Machine Learning Etudes in Astrophysics: Selection Functions for Mock Cluster Catalogs

Filed under: Astroinformatics,Classification,Machine Learning — Patrick Durusau @ 3:24 pm

Machine Learning Etudes in Astrophysics: Selection Functions for Mock Cluster Catalogs by Amir Hajian, Marcelo Alvarez, J. Richard Bond.

Abstract:

Making mock simulated catalogs is an important component of astrophysical data analysis. Selection criteria for observed astronomical objects are often too complicated to be derived from first principles. However the existence of an observed group of objects is a well-suited problem for machine learning classification. In this paper we use one-class classifiers to learn the properties of an observed catalog of clusters of galaxies from ROSAT and to pick clusters from mock simulations that resemble the observed ROSAT catalog. We show how this method can be used to study the cross-correlations of thermal Sunya’ev-Zeldovich signals with number density maps of X-ray selected cluster catalogs. The method reduces the bias due to hand-tuning the selection function and is readily scalable to large catalogs with a high-dimensional space of astrophysical features.

From the introduction:

In many cases the number of unknown parameters is so large that explicit rules for deriving the selection function do not exist. A sample of the objects does exist (the very objects in the observed catalog) however, and the observed sample can be used to express the rules for the selection function. This “learning from examples” is the main idea behind classi cation algorithms in machine learning. The problem of selection functions can be re-stated in the statistical machine learning language as: given a set of samples, we would like to detect the soft boundary of that set so as to classify new points as belonging to that set or not. (emphasis added)

Does the sentence:

In many cases the number of unknown parameters is so large that explicit rules for deriving the selection function do not exist.

sound like they could be describing people?

I mention this as a reason why you should be read broadly in machine learning in particular and IR in general.

What if all the known data about known terrorists, sans all the idle speculation by intelligence analysts, were gathered into a data set. Machine learning on that data set could then be tested against a simulation of potential terrorists, to help avoid the biases of intelligence analysts.

Lest the undeserved fixation on Muslims blind security services to other potential threats, such as governments bent on devouring their own populations.

I first saw this in a tweet by Stat.ML.

December 21, 2014

$175K to Identify Plankton

Filed under: Classification,Data Science,Machine Learning — Patrick Durusau @ 10:20 am

Oregon marine researchers offer $175,000 reward for ‘big data’ solution to identifying plankton by Kelly House.

From the post:

The marine scientists at Oregon State University need to catalog tens of millions of plankton photos, and they’re willing to pay good money to anyone willing to do the job.

The university’s Hatfield Marine Science Center on Monday announced the launch of the National Data Science Bowl, a competition that comes with a $175,000 reward for the best “big data” approach to sorting through the photos.

It’s a job that, done by human hands, would take two lifetimes to finish.

Data crunchers have 90 days to complete their task. Authors of the top three algorithms will share the $175,000 purse and Hatfield will gain ownership of their algorithms.

From the competition description:

The 2014/2015 National Data Science Bowl challenges you to create an image classification algorithm to automatically classify plankton species. This challenge is not easy— there are 100 classes of plankton, the images may contain non-plankton organisms and particles, and the plankton can appear in any orientation within three-dimensional space. The winning algorithms will be used by Hatfield Marine Science Center for simpler, faster population assessment. They represent a $1 million in-kind donation by the data science community!

There is a comprehensive tutorial to get you started and weekly blog posts on the contest.

You may also see this billed as the first National Data Science Bowl.

The contest runs from December 15, 2014 until March 16, 2015.

Competing is free and even if you don’t win the big prize, you will have gained valuable experience from the tutorials and discussions during the contest.

I first saw this in a tweet by Gregory Piatetsky

December 11, 2014

Do we Need Hundreds of Classi fiers to Solve Real World Classi fication Problems?

Filed under: Classification,Classifier,Machine Learning — Patrick Durusau @ 10:07 am

Do we Need Hundreds of Classi fiers to Solve Real World Classification Problems? by Manuel Fernández-Delgado, Eva Cernadas, Senén Barro, and Dinani Amorim. (Journal of Machine Learning Research 15 (2014) 3133-3181)

Abstract:

We evaluate 179 classifiers arising from 17 families (discriminant analysis, Bayesian, neural networks, support vector machines, decision trees, rule-based classifiers, boosting, bagging, stacking, random forests and other ensembles, generalized linear models, nearest-neighbors, partial least squares and principal component regression, logistic and multinomial regression, multiple adaptive regression splines and other methods), implemented in Weka, R (with and without the caret package), C and Matlab, including all the relevant classifiers available today. We use 121 data sets, which represent the whole UCI data base (excluding the large-scale problems) and other own real problems, in order to achieve significant conclusions about the classifier behavior, not dependent on the data set collection. The classifiers most likely to be the bests are the random forest (RF) versions, the best of which (implemented in R and accessed via caret) achieves 94.1% of the maximum accuracy overcoming 90% in the 84.3% of the data sets. However, the difference is not statistically significant with the second best, the SVM with Gaussian kernel implemented in C using LibSVM, which achieves 92.3% of the maximum accuracy. A few models are clearly better than the remaining ones: random forest, SVM with Gaussian and polynomial kernels, extreme learning machine with Gaussian kernel, C5.0 and avNNet (a committee of multi-layer perceptrons implemented in R with the caret package). The random forest is clearly the best family of classifiers (3 out of 5 bests classifiers are RF), followed by SVM (4 classifiers in the top-10), neural networks and boosting ensembles (5 and 3 members in the top-20, respectively).

Keywords: classifi cation, UCI data base, random forest, support vector machine, neural networks, decision trees, ensembles, rule-based classi fiers, discriminant analysis, Bayesian classifi ers, generalized linear models, partial least squares and principal component regression, multiple adaptive regression splines, nearest-neighbors, logistic and multinomial regression

Deeply impressive work but I can hear in the distance the girding of loins and sharpening of tools of scholarly disagreement. 😉

If you are looking for a very comprehensive reference of current classifiers, this is the paper for you.

For the practicing data scientist I think the lesson is to learn a small number of the better classifiers and to not fret overmuch about the lesser ones. If a major breakthrough in classification techniques does happen, it will be in the major tools with great fanfare.

I first saw this in a tweet by Jason Baldridge.

November 23, 2014

Visual Classification Simplified

Filed under: Classification,Merging,Visualization — Patrick Durusau @ 3:41 pm

Visual Classification Simplified

From the post:

Virtually all information governance initiatives depend on being able to accurately and consistently classify the electronic files and scanned documents being managed. Visual classification is the only technology that classifies both types of documents regardless of the amount or quality of text associated with them.

From the user perspective, visual classification is extremely easy to understand and work with. Once documents are collected, visual classification clusters or groups documents based on their appearance. This normalizes documents regardless of the types of files holding the content. The Word document that was saved to PDF will be grouped with that PDF and with the TIF that was made from scanning a paper copy of either document.

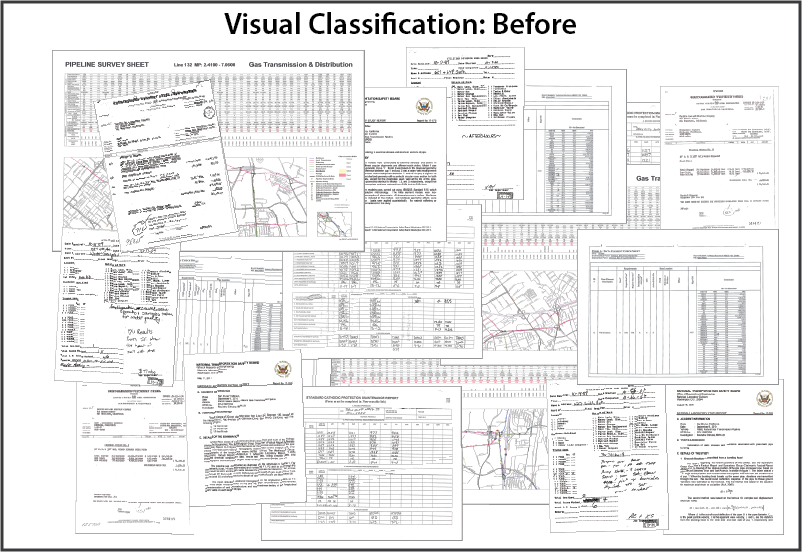
The clustering is automatic, there are no rules to write up front, no exemplars to select, no seed sets to try to tune. This is what a collection of documents might look like before visual classification is applied – no order and no way to classify the documents:

visual classification before

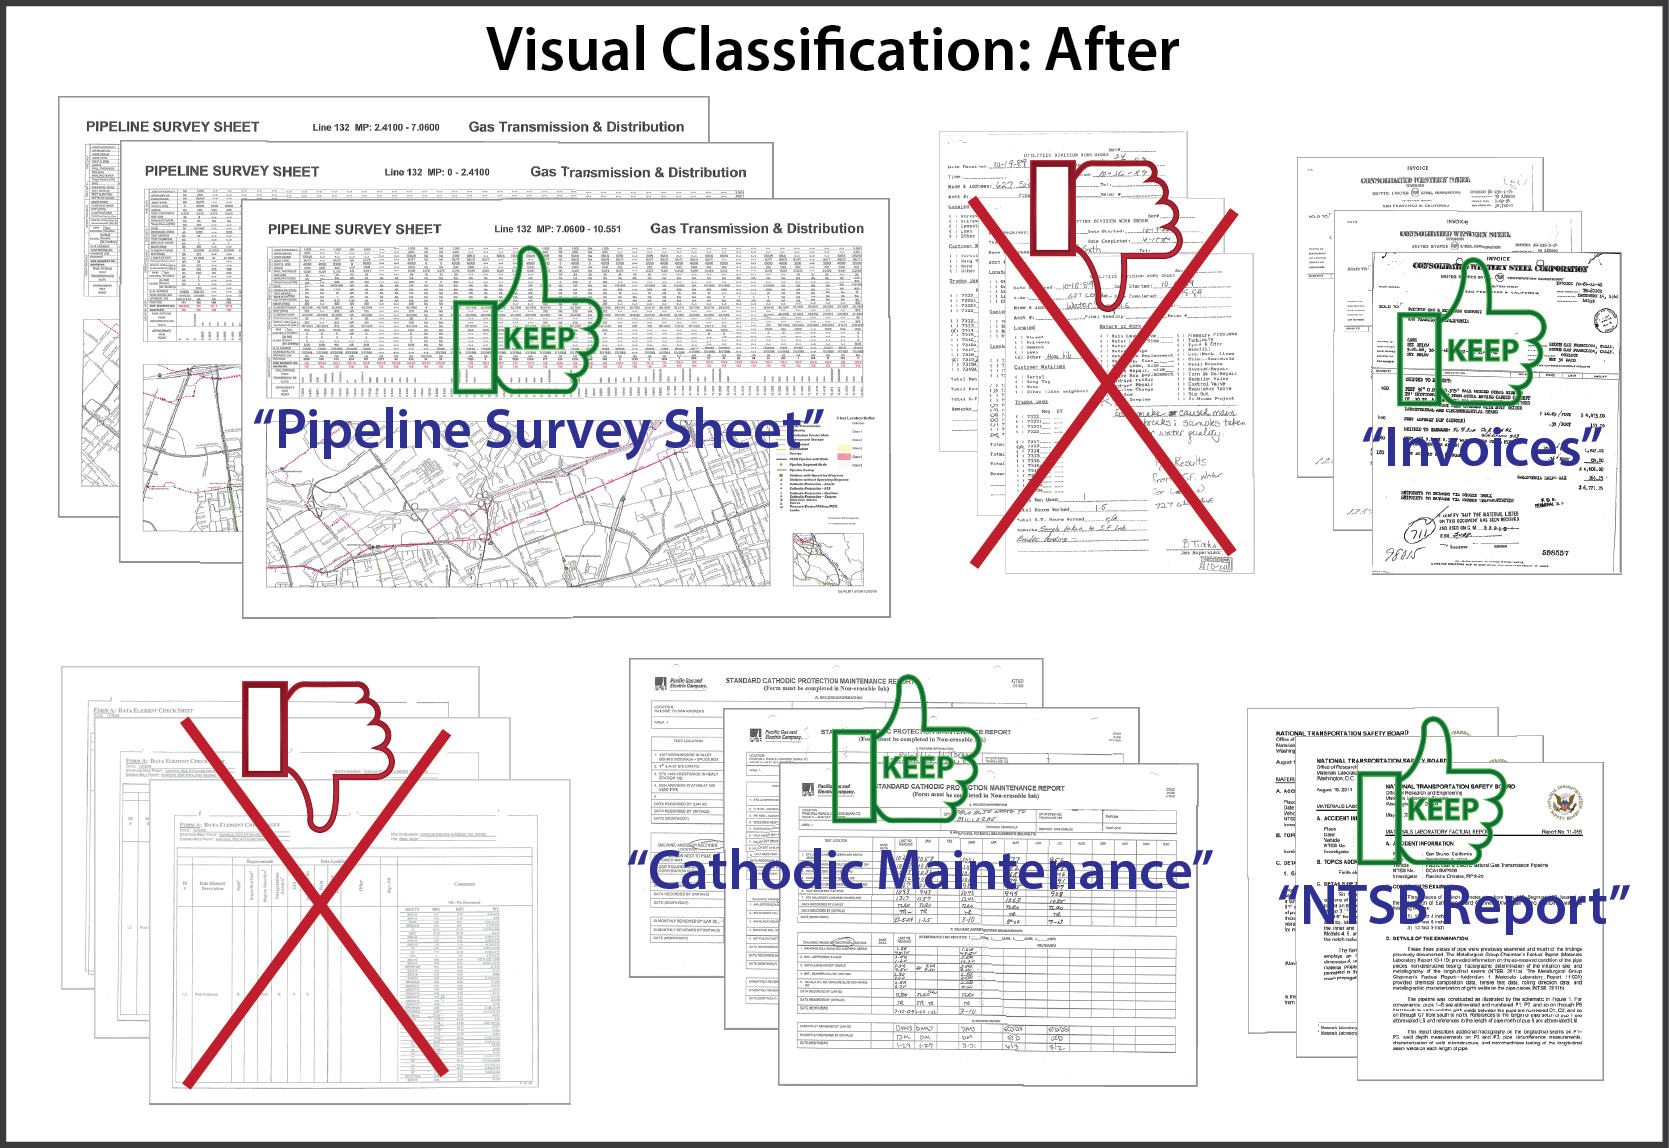
When the initial results of visual classification are presented to the client, the clusters are arranged according to the number of documents in each cluster. Reviewing the first clusters impacts the most documents. Based on reviewing one or two documents per cluster, the reviewer is able to determine (a) should the documents in the cluster be retained, and (b) if they should be retained, what document-type label to associate with the cluster.

visual classification after

By easily eliminating clusters that have no business or regulatory value, content collections can be dramatically reduced. Clusters that remain can have granular retention policies applied, be kept under appropriate access restrictions, and can be assigned business unit owners. Plus of course, the document-type labels can greatly assist users trying to find specific documents. (emphasis in original)

I suspect that BeyondRecognition, the host of this post, really means classification at the document level. A granularity that has plagued information retrieval for decades. Better than no retrieval at all but only just.

However, the graphics of visualization were just too good to pass up! Imagine that you are selecting merging criteria for a set of topics that represent subjects at a far lower granularity than document level.

With the results of those selections being returned to you as part of an interactive process.

If most topic map authoring is for aggregation, that is you author so that topics will merge, this would be aggregation by selection.

Hard to say for sure but I suspect that aggregation (merging) by selection would be far easier than authoring for aggregation.

Suggestions on how to test that premise?

October 8, 2014

Incremental Classification, concept drift and Novelty detection (IClaNov)

Filed under: Classification,Concept Drift,Novelty — Patrick Durusau @ 10:51 am

Incremental Classification, concept drift and Novelty detection (IClaNov)

From the post:

The development of dynamic information analysis methods, like incremental clustering, concept drift management and novelty detection techniques, is becoming a central concern in a bunch of applications whose main goal is to deal with information which is varying over time. These applications relate themselves to very various and highly strategic domains, including web mining, social network analysis, adaptive information retrieval, anomaly or intrusion detection, process control and management recommender systems, technological and scientific survey, and even genomic information analysis, in bioinformatics. The term “incremental” is often associated to the terms dynamics, adaptive, interactive, on-line, or batch. The majority of the learning methods were initially defined in a non-incremental way. However, in each of these families, were initiated incremental methods making it possible to take into account the temporal component of a data stream. In a more general way incremental clustering algorithms and novelty detection approaches are subjected to the following constraints:

  • Possibility to be applied without knowing as a preliminary all the data to be analyzed;
  • Taking into account of a new data must be carried out without making intensive use of the already considered data;
  • Result must but available after insertion of all new data;
  • Potential changes in the data description space must be taken into consideration.

This workshop aims to offer a meeting opportunity for academics and industry-related researchers, belonging to the various communities of Computational Intelligence, Machine Learning, Experimental Design and Data Mining to discuss new areas of incremental clustering, concept drift management and novelty detection and on their application to analysis of time varying information of various natures. Another important aim of the workshop is to bridge the gap between data acquisition or experimentation and model building.

ICDM 2014 Conference: December 14, 2014

The agenda for this workshop has been posted.

Does your ontology support incremental classification, concept drift and novelty detection? All of those exist in the ongoing data stream of experience if not within some more limited data stream from a source.

You can work from a dated snapshot of the world as it was, but over time will that best serve your needs?

Remember that for less than $250,000 (est.) the attacks on 9/11 provoked the United States into spending $trillions based on a Cold War snapshot of the world. Probably the highest return on investment for an attack in history.

The world is constantly changing and your data view of it should be changing as well.

September 9, 2014

A document classifier for medicinal chemistry publications trained on the ChEMBL corpus

A document classifier for medicinal chemistry publications trained on the ChEMBL corpus by George Papadatos, et al. (Journal of Cheminformatics 2014, 6:40)

Abstract:

Background

The large increase in the number of scientific publications has fuelled a need for semi- and fully automated text mining approaches in order to assist in the triage process, both for individual scientists and also for larger-scale data extraction and curation into public databases. Here, we introduce a document classifier, which is able to successfully distinguish between publications that are ‘ChEMBL-like’ (i.e. related to small molecule drug discovery and likely to contain quantitative bioactivity data) and those that are not. The unprecedented size of the medicinal chemistry literature collection, coupled with the advantage of manual curation and mapping to chemistry and biology make the ChEMBL corpus a unique resource for text mining.

Results

The method has been implemented as a data protocol/workflow for both Pipeline Pilot (version 8.5) and KNIME (version 2.9) respectively. Both workflows and models are freely available at: ftp://ftp.ebi.ac.uk/pub/databases/chembl/text-mining webcite. These can be readily modified to include additional keyword constraints to further focus searches.

Conclusions

Large-scale machine learning document classification was shown to be very robust and flexible for this particular application, as illustrated in four distinct text-mining-based use cases. The models are readily available on two data workflow platforms, which we believe will allow the majority of the scientific community to apply them to their own data.

While the abstract mentions “the triage process,” it fails to capture the main goal of this paper:

…the main goal of our project diverges from the goal of the tools mentioned. We aim to meet the following criteria: ranking and prioritising the relevant literature using a fast and high performance algorithm, with a generic methodology applicable to other domains and not necessarily related to chemistry and drug discovery. In this regard, we present a method that builds upon the manually collated and curated ChEMBL document corpus, in order to train a Bag-of-Words (BoW) document classifier.

In more detail, we have employed two established classification methods, namely Naïve Bayesian (NB) and Random Forest (RF) approaches [12]-[14]. The resulting classification score, henceforth referred to as ‘ChEMBL-likeness’, is used to prioritise relevant documents for data extraction and curation during the triage process.

In other words, the focus of this paper is a classifier to help prioritize curation of papers. I take that as being different from classifiers used at other stages or for other purposes in the curation process.

I first saw this in a tweet by ChemConnector.

August 23, 2014

Large-Scale Object Classification…

Filed under: Classification,Image Recognition,Image Understanding,Topic Maps — Patrick Durusau @ 3:37 pm

Large-Scale Object Classi cation using Label Relation Graphs by Jia Deng, et al.

Abstract:

In this paper we study how to perform object classi cation in a principled way that exploits the rich structure of real world labels. We develop a new model that allows encoding of flexible relations between labels. We introduce Hierarchy and Exclusion (HEX) graphs, a new formalism that captures semantic relations between any two labels applied to the same object: mutual exclusion, overlap and subsumption. We then provide rigorous theoretical analysis that illustrates properties of HEX graphs such as consistency, equivalence, and computational implications of the graph structure. Next, we propose a probabilistic classifi cation model based on HEX graphs and show that it enjoys a number of desirable properties. Finally, we evaluate our method using a large-scale benchmark. Empirical results demonstrate that our model can signifi cantly improve object classifi cation by exploiting the label relations.

Let’s hear it for “real world labels!”

By which the authors mean:

  • An object can have more than one label.
  • There are relationships between labels.

From the introduction:

We first introduce Hierarchy and Exclusion (HEX) graphs, a new formalism allowing flexible specifi cation of relations between labels applied to the same object: (1) mutual exclusion (e.g. an object cannot be dog and cat), (2) overlapping (e.g. a husky may or may not be a puppy and vice versa), and (3) subsumption (e.g. all huskies are dogs). We provide theoretical analysis on properties of HEX graphs such as consistency, equivalence, and computational implications.

Next, we propose a probabilistic classi fication model leveraging HEX graphs. In particular, it is a special type of Conditional Random Field (CRF) that encodes the label relations as pairwise potentials. We show that this model enjoys
a number of desirable properties, including flexible encoding of label relations, predictions consistent with label relations, efficient exact inference for typical graphs, learning labels with varying specifi city, knowledge transfer, and uni fication of existing models.

Having more than one label is trivially possible in topic maps. The more interesting case is the authors choosing to treat semantic labels as subjects and to define permitted associations between those subjects.

A world of possibilities opens up when you can treat something as a subject that can have relationships defined to other subjects. Noting that those relationships can also be treated as subjects should someone desire to do so.

I first saw this at: Is that husky a puppy?

July 15, 2014

Classification and regression trees

Filed under: Classification,Machine Learning,Regression,Trees — Patrick Durusau @ 3:47 pm

Classification and regression trees by Wei-Yin Loh.

Abstract:

Classification and regression trees are machine-learningmethods for constructing prediction models from data. The models are obtained by recursively partitioning the data space and fitting a simple prediction model within each partition. As a result, the partitioning can be represented graphically as a decision tree. Classification trees are designed for dependent variables that take a finite number of unordered values, with prediction error measured in terms of misclassification cost. Regression trees are for dependent variables that take continuous or ordered discrete values, with prediction error typically measured by the squared difference between the observed and predicted values. This article gives an introduction to the subject by reviewing some widely available algorithms and comparing their capabilities, strengths, and weakness in two examples. 2011 John Wiley & Sons, Inc. WIREs Data Mining Knowl Discov 2011 1 14–23 DOI: 10.1002/widm.8.

A bit more challenging that CSV formats but also very useful.

I heard a joke many years ago but a then U.S. Assistant Attorney General who said:

To create a suspect list for a truck hijacking in New York, you choose files with certain name characteristics, delete the ones that are currently in prison and those that remain are your suspect list. (paraphrase)

If topic maps can represent any “subject” then they should be able to represent “group subjects” as well. We may know that our particular suspect is the member of a group, but we just don’t know which member of the group is our suspect.

Think of it as a topic map that evolves as more data/analysis is brought to the map and members of a group subject can be broken out into smaller groups or even individuals.

In fact, displaying summaries of characteristics of members of a group in response to classification/regression could well help with the subject analysis process. An interactive construction/mining of the topic map as it were.

Great paper whether you use it for topic map subject analysis or more traditional purposes.

April 4, 2014

Making Data Classification Work

Filed under: Authoring Topic Maps,Classification,Interface Research/Design — Patrick Durusau @ 7:06 pm

Making Data Classification Work by James H. Sawyer.

From the post:

The topic of data classification is one that can quickly polarize a crowd. The one side believes there is absolutely no way to make the classification of data and the requisite protection work — probably the same group that doesn’t believe in security awareness and training for employees. The other side believes in data classification as they are making it work within their environments, primarily because their businesses require it. The difficulty in choosing a side lies in the fact that both are correct.

Apologies, my quoting of James is mis-leading.

James is addressing the issue of “classification” of data in the sense of keeping information secret.

What is amazing is that the solution James proposes for “classification” in terms of what is kept secret, has a lot of resonance for “classification” in the sense of getting users to manage categories of data or documents.

One hint:

Remember how poorly even librarians use the Library of Congress subject listings? Contrast that with nearly everyone using aisle categories at the local grocery store.

You can design a topic map where experts use it poorly, or so nearly everyone be able to use it.

Your call.

January 15, 2014

What’s Hiding In Your Classification System?

Filed under: Classification,Graphics,Patents,Visualization — Patrick Durusau @ 5:10 pm

Patent Overlay Mapping: Visualizing Technological Distance by Luciano Kay, Nils Newman, Jan Youtie, Alan L. Porter, Ismael Rafols.

Abstract:

This paper presents a new global patent map that represents all technological categories, and a method to locate patent data of individual organizations and technological fields on the global map. This overlay map technique may support competitive intelligence and policy decision-making. The global patent map is based on similarities in citing-to-cited relationships between categories of theInternational Patent Classification (IPC) of European Patent Office (EPO) patents from 2000 to 2006. This patent dataset, extracted from the PATSTAT database, includes 760,000 patent records in 466 IPC-based categories. We compare the global patent maps derived from this categorization to related efforts of other global patent maps. The paper overlays nanotechnology-related patenting activities of two companies and two different nanotechnology subfields on the global patent map. The exercise shows the potential of patent overlay maps to visualize technological areas and potentially support decision-making. Furthermore, this study shows that IPC categories that are similar to one another based on citing-to-cited patterns (and thus are close in the global patent map) are not necessarily in the same hierarchical IPC branch, thus revealing new relationships between technologies that are classified as pertaining to different (and sometimes distant) subject areas in the IPC scheme.

The most interesting discovery in the paper was summarized as follows:

One of the most interesting findings is that IPC categories that are close to one another in the patent map are not necessarily in the same hierarchical IPC branch. This finding reveals new patterns of relationships among technologies that pertain to different (and sometimes distant) subject areas in the IPC classification. The finding suggests that technological distance is not always well proxied by relying on the IPC administrative structure, for example, by assuming that a set of patents represents substantial technological distance because the set references different IPC sections. This paper shows that patents in certain technology areas tend to cite multiple and diverse IPC sections.

That being the case, what is being hidden in other classification systems?

For example, how does the ACM Computing Classification System compare when the citations used by authors are taken into account?

Perhaps this is a method to compare classifications as seen by experts versus a community of users.

BTW, the authors have posted supplemental materials online:

Supplementary File 1 is an MS Excel file containing the labels of IPC categories, citation and similarity matrices, factor analysis of IPC categories. It can be found at: http://www.sussex.ac.uk/Users/ir28/patmap/KaySupplementary1.xls

Supplementary File 2 is an MS PowerPoint file with examples of overlay maps of firms and research topics. It can be found at: http://www.sussex.ac.uk/Users/ir28/patmap/KaySupplementary2.ppt

Supplementary File 3 is an interactive version of map in Figure 1visualized with the freeware VOSviewer. It can be found at: http://www.vosviewer.com/vosviewer.php?map=http://www.sussex.ac.uk/Users/ir28/patmap/KaySupplementary3.txt

December 30, 2013

Pattern recognition toolbox

Filed under: Classification,Classifier,Pattern Recognition — Patrick Durusau @ 5:34 pm

Pattern recognition toolbox by Thomas W. Rauber.

From the webpage:

TOOLDIAG is a collection of methods for statistical pattern recognition. The main area of application is classification. The application area is limited to multidimensional continuous features, without any missing values. No symbolic features (attributes) are allowed. The program in implemented in the ‘C’ programming language and was tested in several computing environments. The user interface is simple, command-line oriented, but the methods behind it are efficient and fast. You can customize your own methods on the application programming level with relatively little effort. If you wish a presentation of the theory behind the program at your university, feel free to contact me.

Command line classification. A higher learning curve that some but expect greater flexibility as well.

I thought the requirement of “no missing values” was curious.

If you have a data set with some legitimately missing values, how are you going to replace them in a neutral way?

December 14, 2013

JITA Classification System of Library and Information Science

Filed under: Classification,Library,Linked Data — Patrick Durusau @ 5:00 pm

JITA Classification System of Library and Information Science

From the post:

JITA is a classification schema of Library and Information Science (LIS). It is used by E-LIS, an international open repository for scientific papers in Library and Information Science, for indexing and searching. Currently JITA is available in English and has been translated into 14 languages (tr, el, nl, cs, fr, it, ro, ca, pt, pl, es, ar, sv, ru). JITA is also accessible as Linked Open Data, containing 3500 triples.

You had better enjoy triples before link rot overtakes them.

Today CSV, tomorrow JSON?

How long do you think the longest lived triple will last?

November 15, 2013

BARTOC launched : A register for vocabularies

Filed under: Classification,EU,Ontology,Thesaurus — Patrick Durusau @ 2:49 pm

BARTOC launched : A register for vocabularies by Sarah Dister

From the post:

Looking for a classification system, controlled vocabulary, ontology, taxonomy, thesaurus that covers the field you are working in? The University Library of Basel in Switzerland recently launched a register containing the metadata of 600 controlled and structured vocabularies in 65 languages. Its official name: the Basel Register of Thesauri, Ontologies and Classifications (BARTOC).

High quality search

All items in BARTOC are indexed with Eurovoc, EU’s multilingual thesaurus, and classified using Dewey Decimal Classification (DDC) numbers down to the third level, allowing a high quality subject search. Other search characteristics are:

  • The search interface is available in 20 languages.
  • A Boolean operators field is integrated into the search box.
  • The advanced search allows you to refine your search by Field type, Language, DDC, Format and Access.
  • In the results page you can refine your search further by using the facets on the right side.

A great step towards bridging vocabularies but at a much higher (more general) level than any enterprise or government department.

November 12, 2013

Advantages of Different Classification Algorithms

Filed under: Classification,Machine Learning — Patrick Durusau @ 4:18 pm

What are the advantages of different classification algorithms? (Question on Quora.)

Useful answers follow.

Not a bad starting place for a set of algorithms you are likely to encounter on a regular basis. Either to become familiar with them and/or to work out stock criticisms of their use.

Enjoy!

I first saw this link at myNoSQL by Alex Popescu.

November 6, 2013

Introduction to Information Retrieval

Filed under: Classification,Indexing,Information Retrieval,Probalistic Models,Searching — Patrick Durusau @ 5:10 pm

Introduction to Information Retrieval by Christopher D. Manning, Prabhakar Raghavan and Hinrich Schütze.

A bit dated now (2008) but the underlying principles of information retrieval remain the same.

I have a hard copy but the additional materials and ability to cut-n-paste will make this a welcome resource!

We’d be pleased to get feedback about how this book works out as a textbook, what is missing, or covered in too much detail, or what is simply wrong. Please send any feedback or comments to: informationretrieval (at) yahoogroups (dot) com

Online resources

Apart from small differences (mainly concerning copy editing and figures), the online editions should have the same content as the print edition.

The following materials are available online. The date of last update is given in parentheses.

Information retrieval resources

A list of information retrieval resources is also available.

Introduction to Information Retrieval: Table of Contents

Front matter (incl. table of notations) pdf

01   Boolean retrieval pdf html

02 The term vocabulary & postings lists pdf html

03 Dictionaries and tolerant retrieval pdf html

04 Index construction pdf html

05 Index compression pdf html

06 Scoring, term weighting & the vector space model pdf html

07 Computing scores in a complete search system pdf html

08 Evaluation in information retrieval pdf html

09 Relevance feedback & query expansion pdf html

10 XML retrieval pdf html

11 Probabilistic information retrieval pdf html

12 Language models for information retrieval pdf html

13 Text classification & Naive Bayes pdf html

14 Vector space classification pdf html

15 Support vector machines & machine learning on documents pdf html

16 Flat clustering pdf html Resources.

17 Hierarchical clustering pdf html

18 Matrix decompositions & latent semantic indexing pdf html

19 Web search basics pdf html

20 Web crawling and indexes pdf html

21 Link analysis pdf html

Bibliography & Index pdf

bibtex file bib

September 30, 2013

Classifying Non-Patent Literature…

Filed under: Classification,Natural Language Processing,Patents,Solr — Patrick Durusau @ 6:29 pm

Classifying Non-Patent Literature To Aid In Prior Art Searches by John Berryman.

From the post:

Before a patent can be granted, it must be proven beyond a reasonable doubt that the innovation outlined by the patent application is indeed novel. Similarly, when defending one’s own intellectual property against a non-practicing entity (NPE – also known as a patent troll) one often attempts to prove that the patent held by the accuser is invalid by showing that relevant prior art already exists and that their patent is actual not that novel.

Finding Prior Art

So where does one get ahold of pertinent prior art? The most obvious place to look is in the text of earlier patents grants. If you can identify a set of reasonably related grants that covers the claims of the patent in question, then the patent may not be valid. In fact, if you are considering the validity of a patent application, then reviewing existing patents is certainly the first approach you should take. However, if you’re using this route to identify prior art for a patent held by an NPE, then you may be fighting an uphill battle. Consider that a very bright patent examiner has already taken this approach, and after an in-depth examination process, having found no relevant prior art, the patent office granted the very patent that you seek to invalidate.

But there is hope. For a patent to be granted, it must not only be novel among the roughly 10Million US Patents that currently exist, but it must also be novel among all published media prior to the application date – so called non-patent literature (NPL). This includes conference proceeding, academic articles, weblogs, or even YouTube videos. And if anyone – including the applicant themselves – publicly discloses information critical to their patent’s claims, then the patent may be rendered invalid. As a corollary, if you are looking to invalidate a patent, then looking for prior art in non-patent literature is a good idea! While tools are available to systematically search through patent grants, it is much more difficult to search through NPL. And if the patent in question truly is not novel, then evidence must surely exists – if only you knew where to look.

More suggestions than solutions but good suggestions, such as these, are hard to come by.

John suggests using existing patents and their classifications as a learning set to classify non-patent literature.

Interesting but patent language is highly stylized and quite unlike the descriptions you encounter in non-patent literature.

It would be an interesting experiment to take some subset of patents and their classifications along with a set of non-patent literature, known to describe the same “inventions” covered by the patents.

Suggestions for subject areas?

September 23, 2013

…Crowd-Sourcing to Classify Strange Oceanic Creatures

Filed under: Classification,Crowd Sourcing — Patrick Durusau @ 3:48 pm

Plankton Portal Uses Crowd-Sourcing to Classify Strange Oceanic Creatures

From the post:

Today, an online citizen-science project launches called “Plankton Portal” was created by researchers at the University of Miami Rosenstiel School of Marine and Atmospheric Sciences (RSMAS) in collaboration with the National Oceanic and Atmospheric Administration (NOAA) and the National Science Foundation (NSF) and developers at Zooniverse.org Plankton Portal allows you to explore the open ocean from the comfort of your own home. You can dive hundreds of feet deep, and observe the unperturbed ocean and the myriad animals that inhabit Earth’s last frontier.

The goal of the site is to enlist volunteers to classify millions of underwater images to study plankton diversity, distribution and behavior in the open ocean. It was developed under the leadership of Dr. Robert K. Cowen, UM RSMAS Emeritus Professor in Marine Biology and Fisheries (MBF) and now the Director of Oregon State University’s Hatfield Marine Science Center, and by Research Associate Cedric Guigand and MBF graduate students Jessica Luo and Adam Greer.

Millions of plankton images are taken by the In Situ Ichthyoplankton Imaging System (ISIIS), a unique underwater robot engineered at the University of Miami in collaboration with Charles Cousin at Bellamare LLC and funded by NOAA and NSF. ISIIS operates as an ocean scanner that casts the shadow of tiny and transparent oceanic creatures onto a very high resolution digital sensor at very high frequency. So far, ISIIS has been used in several oceans around the world to detect the presence of larval fish, small crustaceans and jellyfish in ways never before possible. This new technology can help answer important questions ranging from how do plankton disperse, interact and survive in the marine environment, to predicting the physical and biological factors could influence the plankton community.

You can go to Zoniverse.org or jump directly to the Plankton Portal.

If plankton don’t excite you all that much, consider one of the other projects at Zoniverse:

Galaxy Zoo
How do galaxies form?
NASA’s Hubble Space Telescope archive provides hundreds of thousands of galaxy images.
Ancient Lives
Study the lives of ancient Greeks
The data gathered by Ancient Lives helps scholars study the Oxyrhynchus collection.
Moon Zoo
Explore the surface of the Moon
We hope to study the lunar surface in unprecedented detail.
WhaleFM
Hear Whales communicate
You can help marine researchers understand what whales are saying
Solar Stormwatch
Study explosions on the Sun
Explore interactive diagrams to learn about the Sun and the spacecraft monitoring it.
Seafloor Explorer
Help explore the ocean floor
The HabCam team and the Woods Hole Oceanographic Institution need your help!
PlanetHunters.org
Find planets around stars
Lightcurve changes from the Kepler spacecraft can indicate transiting planets.
Bat Detective
You’re hot on the trail of bats!
Help scientists characterise bat calls recorded by citizen scientists.
The Milky Way Project
How do stars form?
We’re asking you to help us find and draw circles on infrared image data from the Spitzer Space Telescope.
Snapshot Serengeti
Go wild in the Serengeti!
We need your help to classify all the different animals caught in millions of camera trap images.
Planet Four
Explore the Red Planet
Planetary scientists need your help to discover what the weather is like on Mars.
Notes from Nature
Take Notes from Nature
Transcribe museum records to take notes from nature, contribute to science.
SpaceWarps
Help us find gravitational lenses
Imagine a galaxy, behind another galaxy. Think you won’t see it? Think again.
Plankton Portal
No plankton means no life in the ocean
Plankton are a critically important food source for our oceans.
oldWeather
Model Earth’s climate using historic ship logs
Help scientists recover Arctic and worldwide weather observations made by US Navy and Coast Guard ships.
Cell Slider
Analyse real life cancer data.
You can help scientists from the world’s largest cancer research institution find cures for cancer.
CycloneCenter
Classify over 30 years of tropical cyclone data.
Scientists at NOAA’s National Climatic Data Center need your help.
Worm Watch Lab
Track genetic mysteries
We can better understand how our genes work by spotting the worms laying eggs.

I count eighteen (18) projects and this is just one of the many crowd source project collections.

Question: We overcome semantic impedance to work cooperatively on these projects, what is it that creates semantic impedance in other projects?

Or perhaps better: How do we or others benefit from the presence of semantic impedance?

The second question might lead to a strategy that replaces that benefit with a bigger one from using topic maps.

July 30, 2013

RTextTools: A Supervised Learning Package for Text Classification

Filed under: Classification,Machine Learning,R — Patrick Durusau @ 2:17 pm

RTextTools: A Supervised Learning Package for Text Classification by Timothy P. Jurka, Loren Collingwood, Amber E. Boydstun, Emiliano Grossman, and Wouter van Atteveldt.

Abstract:

Social scientists have long hand-labeled texts to create datasets useful for studying topics from congressional policymaking to media reporting. Many social scientists have begun to incorporate machine learning into their toolkits. RTextTools was designed to make machine learning accessible by providing a start-to-finish product in less than 10 steps. After installing RTextTools, the initial step is to generate a document term matrix. Second, a container object is created, which holds all the objects needed for further analysis. Third, users can use up to nine algorithms to train their data. Fourth, the data are classified. Fifth, the classification is summarized. Sixth, functions are available for performance evaluation. Seventh, ensemble agreement is conducted. Eighth, users can cross-validate their data. Finally, users write their data to a spreadsheet, allowing for further manual coding if required.

Another software package that comes with a sample data set!

The congressional bills example reminds me of a comment by Trey Grainger in Building a Real-time, Big Data Analytics Platform with Solr.

Trey makes the point that “document” in Solr depends on how you define document. Which enables processing/retrieval at a much lower level than a traditional “document.”

If the congressional bills were broken down at a clause level, would the results be different?

Not something I am going to pursue today but will appreciate comments and suggestions if you have seen that tried in other contexts.

July 25, 2013

Classification accuracy is not enough

Filed under: Classification,Machine Learning,Music — Patrick Durusau @ 4:41 pm

Classification accuracy is not enough by Bob L. Sturm.

From the post:

Finally published is my article, Classification accuracy is not enough: On the evaluation of music genre recognition systems. I made it completely open access and free for anyone.

Some background: In my paper Two Systems for Automatic Music Genre Recognition: What Are They Really Recognizing?, I perform three different experiments to determine how well two state-of-the-art systems for music genre recognition are recognizing genre. In the first experiment, I find the two systems are consistently making extremely bad misclassifications. In the second experiment, I find the two systems can be fooled by such simple transformations that they cannot possibly be listening to the music. In the third experiment, I find their internal models of the genres do not match how humans think the genres sound. Hence, it appears that the systems are not recognizing genre in the least. However, this seems to contradict the fact that they achieve extremely good classification accuracies, and have been touted as superior solutions in the literature. Turns out, Classification accuracy is not enough!

(…)

I look closely at what kinds of mistakes the systems make, and find they all make very poor yet “confident” mistakes. I demonstrate the latter by looking at the decision statistics of the systems. There is little difference for a system between making a correct classification, and an incorrect one. To judge how poor the mistakes are, I test with humans whether the labels selected by the classifiers describe the music. Test subjects listen to a music excerpt and select between two labels which they think was given by a human. Not one of the systems fooled anyone. Hence, while all the systems had good classification accuracies, good precisions, recalls, and F-scores, and confusion matrices that appeared to make sense, a deeper evaluation shows that none of them are recognizing genre, and thus that none of them are even addressing the problem. (They are all horses, making decisions based on irrelevant but confounded factors.)

(…)

If you have ever wondered what a detailed review of classification efforts would look like, you need wonder no longer!

Bob’s Two Systems for Automatic Music Genre Recognition: What Are They Really Recognizing? is thirty-six (36) pages that examines efforts at music genre recognition (MGR) in detail.

I would highly recommend this paper as a demonstration of good research technique.

April 13, 2013

Law Classification Added to Library of Congress Linked Data Service

Filed under: Classification,Law,Linked Data — Patrick Durusau @ 4:39 am

Law Classification Added to Library of Congress Linked Data Service by Kevin Ford.

From the post:

The Library of Congress is pleased to make the K ClassLaw Classification – and all its subclasses available as linked data from the LC Linked Data Service, ID.LOC.GOV. K Class joins the B, N, M, and Z Classes, which have been in beta release since June 2012. With about 2.2 million new resources added to ID.LOC.GOV, K Class is nearly eight times larger than the B, M, N, and Z Classes combined. It is four times larger than the Library of Congress Subject Headings (LCSH). If it is not the largest class, it is second only to the P Class (Literature) in the Library of Congress Classification (LCC) system.

We have also taken the opportunity to re-compute and reload the B, M, N, and Z classes in response to a few reported errors. Our gratitude to Caroline Arms for her work crawling through B, M, N, and Z and identifying a number of these issues.

Please explore the K Class for yourself at http://id.loc.gov/authorities/classification/K or all of the classes at http://id.loc.gov/authorities/classification.

The classification section of ID.LOC.GOV remains a beta offering. More work is needed not only to add the additional classes to the system but also to continue to work out issues with the data.

As always, your feedback is important and welcomed. Your contributions directly inform service enhancements. We are interested in all forms of constructive commentary on all topics related to ID. But we are particularly interested in how the data available from ID.LOC.GOV is used and continue to encourage the submission of use cases describing how the community would like to apply or repurpose the LCC data.

You can send comments or report any problems via the ID feedback form or ID listserv.

Not leisure reading for everyone but if you are interested, this is fascinating source material.

And an important source of information for potential associations between subjects.

I first saw this at: Ford: Law Classification Added to Library of Congress Linked Data Service.

January 30, 2013

Graph Based Classification Methods Using Inaccurate External Classifier Information

Filed under: Classification,Classifier,Graphs — Patrick Durusau @ 8:43 pm

Graph Based Classification Methods Using Inaccurate External Classifier Information by Sundararajan Sellamanickam and Sathiya Keerthi Selvaraj.

Abstract:

In this paper we consider the problem of collectively classifying entities where relational information is available across the entities. In practice inaccurate class distribution for each entity is often available from another (external) classifier. For example this distribution could come from a classifier built using content features or a simple dictionary. Given the relational and inaccurate external classifier information, we consider two graph based settings in which the problem of collective classification can be solved. In the first setting the class distribution is used to fix labels to a subset of nodes and the labels for the remaining nodes are obtained like in a transductive setting. In the other setting the class distributions of all nodes are used to define the fitting function part of a graph regularized objective function. We define a generalized objective function that handles both the settings. Methods like harmonic Gaussian field and local-global consistency (LGC) reported in the literature can be seen as special cases. We extend the LGC and weighted vote relational neighbor classification (WvRN) methods to support usage of external classifier information. We also propose an efficient least squares regularization (LSR) based method and relate it to information regularization methods. All the methods are evaluated on several benchmark and real world datasets. Considering together speed, robustness and accuracy, experimental results indicate that the LSR and WvRN-extension methods perform better than other methods.

Doesn’t read like a page-turner does it? 😉

An example from the paper will help illustrate why this is an important paper:

In this paper we consider a related relational learning problem where, instead of a subset of labeled nodes, we have inaccurate external label/class distribution information for each node. This problem arises in many web applications. Consider, for example, the problem of identifying pages about Public works, Court, Health, Community development, Library etc. within the web site of a particular city. The link and directory relations contain useful signals for solving such a classifi cation problem. Note that this relational structure will be diff erent for di fferent city web sites. If we are only interested in a small number of cities then we can a fford to label a number of pages in each site and then apply transductive learning using the labeled nodes. But, if we want to do the classifi cation on hundreds of thousands of city sites, labeling on all sites is expensive and we need to take a diff erent approach. One possibility is to use a selected set of content dictionary features together with the labeling of a small random sample of pages from a number of sites to learn an inaccurate probabilistic classifi er, e.g., logistic regression. Now, for any one city web site, the output of this initial classifi er can be used to generate class distributions for the pages in the site, which can then be used together with the relational information in the site to get accurate classifi cation.

In topic map parlance, we would say identity was being established by the associations in which a topic participates but that is a matter of terminology and not substantive difference.

December 29, 2012

My Intro to Multiple Classification…

Filed under: Classification,Inference,Latent Dirichlet Allocation (LDA),Random Forests — Patrick Durusau @ 5:40 am

My Intro to Multiple Classification with Random Forests, Conditional Inference Trees, and Linear Discriminant Analysis

From the post:

After the work I did for my last post, I wanted to practice doing multiple classification. I first thought of using the famous iris dataset, but felt that was a little boring. Ideally, I wanted to look for a practice dataset where I could successfully classify data using both categorical and numeric predictors. Unfortunately it was tough for me to find such a dataset that was easy enough for me to understand.

The dataset I use in this post comes from a textbook called Analyzing Categorical Data by Jeffrey S Simonoff, and lends itself to basically the same kind of analysis done by blogger “Wingfeet” in his post predicting authorship of Wheel of Time books. In this case, the dataset contains counts of stop words (function words in English, such as “as”, “also, “even”, etc.) in chapters, or scenes, from books or plays written by Jane Austen, Jack London (I’m not sure if “London” in the dataset might actually refer to another author), John Milton, and William Shakespeare. Being a textbook example, you just know there’s something worth analyzing in it!! The following table describes the numerical breakdown of books and chapters from each author:

Introduction to authorship studies as they were known (may still be) in the academic circles of my youth.

I wonder if the same techniques are as viable today as on the Federalist Papers?

The Wheel of Time example demonstrates the technique remains viable for novel authors.

But what about authorship more broadly?

Can we reliably distinguish between news commentary from multiple sources?

Or between statements by elected officials?

How would your topic map represent purported authorship versus attributed authorship?

Or even a common authorship for multiple purported authors? (speech writers)

December 28, 2012

LIBOL 0.1.0

Filed under: Algorithms,Classification,Machine Learning — Patrick Durusau @ 7:44 pm

LIBOL 0.1.0

From the webpage:

LIBOL is an open-source library for large-scale online classification, which consists of a large family of efficient and scalable state-of-the-art online learning algorithms for large-scale online classification tasks. We have offered easy-to-use command-line tools and examples for users and developers. We also have made documents available for both beginners and advanced users. LIBOL is not only a machine learning tool, but also a comprehensive experimental platform for conducting online learning research.

In general, the existing online learning algorithms for linear classication tasks can be grouped into two major categories: (i) first order learning (Rosenblatt, 1958; Crammer et al., 2006), and (ii) second order learning (Dredze et al., 2008; Wang et al., 2012; Yang et al., 2009).

Example online learning algorithms in the first order learning category implemented in this library include:

• Perceptron: the classical online learning algorithm (Rosenblatt, 1958);

• ALMA: A New ApproximateMaximal Margin Classification Algorithm (Gentile, 2001);

• ROMMA: the relaxed online maxiumu margin algorithms (Li and Long, 2002);

• OGD: the Online Gradient Descent (OGD) algorithms (Zinkevich, 2003);

• PA: Passive Aggressive (PA) algorithms (Crammer et al., 2006), one of state-of-the-art first order online learning algorithms;

Example algorithms in the second order online learning category implemented in this library include the following:

• SOP: the Second Order Perceptron (SOP) algorithm (Cesa-Bianchi et al., 2005);

• CW: the Confidence-Weighted (CW) learning algorithm (Dredze et al., 2008);

• IELLIP: online learning algorithms by improved ellipsoid method (Yang et al., 2009);

• AROW: the Adaptive Regularization of Weight Vectors (Crammer et al., 2009);

• NAROW: New variant of Adaptive Regularization (Orabona and Crammer, 2010);

• NHERD: the Normal Herding method via Gaussian Herding (Crammer and Lee, 2010)

• SCW: the recently proposed Soft ConfidenceWeighted algorithms (Wang et al., 2012).

LIBOL is still being improved by improvements from practical users and new research results.

More information can be found in our project website: http://libol.stevenhoi.org/

Consider this an early New Year’s present!

December 26, 2012

EOL Classification Providers [Encyclopedia of Life]

Filed under: Bioinformatics,Biomedical,Classification — Patrick Durusau @ 7:17 pm

EOL Classification Providers

From the webpage:

The information on EOL is organized using hierarchical classifications of taxa (groups of organisms) from a number of different classification providers. You can explore these hierarchies in the Names tab of EOL taxon pages. Many visitors would expect to see a single classification of life on EOL. However, we are still far from having a classification scheme that is universally accepted.

Biologists all over the world are studying the genetic relationships between organisms in order to determine each species’ place in the hierarchy of life. While this research is underway, there will be differences in opinion on how to best classify each group. Therefore, we present our visitors with a number of alternatives. Each of these hierarchies is supported by a community of scientists, and all of them feature relationships that are controversial or unresolved.

How far from universally accepted?

Consider the sources for classification:

AntWeb
AntWeb is generally recognized as the most advanced biodiversity information system at species level dedicated to ants. Altogether, its acceptance by the ant research community, the number of participating remote curators that maintain the site, number of pictures, simplicity of web interface, and completeness of species, make AntWeb the premier reference for dissemination of data, information, and knowledge on ants. AntWeb is serving information on tens of thousands of ant species through the EOL.

Avibase
Avibase is an extensive database information system about all birds of the world, containing over 6 million records about 10,000 species and 22,000 subspecies of birds, including distribution information, taxonomy, synonyms in several languages and more. This site is managed by Denis Lepage and hosted by Bird Studies Canada, the Canadian copartner of Birdlife International. Avibase has been a work in progress since 1992 and it is offered as a free service to the bird-watching and scientific community. In addition to links, Avibase helped us install Gill, F & D Donsker (Eds). 2012. IOC World Bird Names (v 3.1). Available at http://www.worldbirdnames.org as of 2 May 2012.  More bird classifications are likely to follow

CoL
The Catalogue of Life Partnership (CoLP) is an informal partnership dedicated to creating an index of the world’s organisms, called the Catalogue of Life (CoL). The CoL provides different forms of access to an integrated, quality, maintained, comprehensive consensus species checklist and taxonomic hierarchy, presently covering more than one million species, and intended to cover all know species in the near future. The Annual Checklist EOL uses contains substantial contributions of taxonomic expertise from more than fifty organizations around the world, integrated into a single work by the ongoing work of the CoLP partners. 

FishBase
FishBase is a global information system with all you ever wanted to know about fishes. FishBase is a relational database with information to cater to different professionals such as research scientists, fisheries managers, zoologists and many more. The FishBase Website contains data on practically every fish species known to science. The project was developed at the WorldFish Center in collaboration with the Food and Agriculture Organization of the United Nations and many other partners, and with support from the European Commission. FishBase is serving information on more than 30,000 fish species through EOL.

Index Fungorum
The Index Fungorum, the global fungal nomenclator coordinated and supported by the Index Fungorum Partnership (CABI, CBS, Landcare Research-NZ), contains names of fungi (including yeasts, lichens, chromistan fungal analogues, protozoan fungal analogues and fossil forms) at all ranks.

ITIS
The Integrated Taxonomic Information System (ITIS) is a partnership of federal agencies and other organizations from the United States, Canada, and Mexico, with data stewards and experts from around the world (see http://www.itis.gov). The ITIS database is an automated reference of scientific and common names of biota of interest to North America . It contains more than 600,000 scientific and common names in all kingdoms, and is accessible via the World Wide Web in English, French, Spanish, and Portuguese (http://itis.gbif.net). ITIS is part of the US National Biological Information Infrastructure (http://www.nbii.gov).

IUCN
International Union for Conservation of Nature (IUCN) helps the world find pragmatic solutions to our most pressing environment and development challenges. IUCN supports scientific research; manages field projects all over the world; and brings governments, non-government organizations, United Nations agencies, companies and local communities together to develop and implement policy, laws and best practice. EOL partnered with the IUCN to indicate status of each species according to the Red List of Threatened Species.

Metalmark Moths of the World
Metalmark moths (Lepidoptera: Choreutidae) are a poorly known, mostly tropical family of microlepidopterans. The Metalmark Moths of the World LifeDesk provides species pages and an updated classification for the group.

NCBI
As a U.S. national resource for molecular biology information, NCBI’s mission is to develop new information technologies to aid in the understanding of fundamental molecular and genetic processes that control health and disease. The NCBI taxonomy database contains the names of all organisms that are represented in the genetic databases with at least one nucleotide or protein sequence.

The Paleobiology Database
The Paleobiology Database is a public resource for the global scientific community. It has been organized and operated by a multi-disciplinary, multi-institutional, international group of paleobiological researchers. Its purpose is to provide global, collection-based occurrence and taxonomic data for marine and terrestrial animals and plants of any geological age, as well as web-based software for statistical analysis of the data. The project’s wider, long-term goal is to encourage collaborative efforts to answer large-scale paleobiological questions by developing a useful database infrastructure and bringing together large data sets.

The Reptile Database 
This database provides information on the classification of all living reptiles by listing all species and their pertinent higher taxa. The database therefore covers all living snakes, lizards, turtles, amphisbaenians, tuataras, and crocodiles. It is a source of taxonomic data, thus providing primarily (scientific) names, synonyms, distributions and related data. The database is currently supported by the Systematics working group of the German Herpetological Society (DGHT)

WoRMS
The aim of a World Register of Marine Species (WoRMS) is to provide an authoritative and comprehensive list of names of marine organisms, including information on synonymy. While highest priority goes to valid names, other names in use are included so that this register can serve as a guide to interpret taxonomic literature.

Those are “current” classifications, which don’t reflect historical classifications (used by our ancestors), nor future classifications.

The four states of matter becoming > 500 states of matter for example.

Instead of “universal acceptance,” how does “working agreement for a specific purpose” sound?
November 25, 2012

Fast rule-based bioactivity prediction using associative classification mining

Filed under: Associations,Associative Classification Mining,Classification,Data Mining — Patrick Durusau @ 1:24 pm

Fast rule-based bioactivity prediction using associative classification mining by Pulan Yu and David J Wild. (Journal of Cheminformatics 2012, 4:29 )

Who moved my acronym? continues: ACM = Association for Computing Machinery or associative classification mining.

Abstract:

Relating chemical features to bioactivities is critical in molecular design and is used extensively in lead discovery and optimization process. A variety of techniques from statistics, data mining and machine learning have been applied to this process. In this study, we utilize a collection of methods, called associative classification mining (ACM), which are popular in the data mining community, but so far have not been applied widely in cheminformatics. More specifically, the classification based on predictive association rules (CPAR), classification based on multiple association rules (CMAR) and classification based on association rules (CBA) are employed on three datasets using various descriptor sets. Experimental evaluations on anti-tuberculosis (antiTB), mutagenicity and hERG (the human Ether-a-go-go-Related Gene) blocker datasets show that these three methods are computationally scalable and appropriate for high speed mining. Additionally, they provide comparable accuracy and efficiency to the commonly used Bayesian and support vector machines (SVM) method, and produce highly interpretable models.

An interesting lead on investigation of associations in large data sets. Pass on those meeting a threshold on for further evaluation?

November 19, 2012

Constructing a true LCSH tree of a science and engineering collection

Filed under: Cataloging,Classification,Classification Trees,Hierarchy,LCSH,Library,Trees — Patrick Durusau @ 5:49 am

Constructing a true LCSH tree of a science and engineering collection by Charles-Antoine Julien, Pierre Tirilly, John E. Leide and Catherine Guastavino.

Abstract:

The Library of Congress Subject Headings (LCSH) is a subject structure used to index large library collections throughout the world. Browsing a collection through LCSH is difficult using current online tools in part because users cannot explore the structure using their existing experience navigating file hierarchies on their hard drives. This is due to inconsistencies in the LCSH structure, which does not adhere to the specific rules defining tree structures. This article proposes a method to adapt the LCSH structure to reflect a real-world collection from the domain of science and engineering. This structure is transformed into a valid tree structure using an automatic process. The analysis of the resulting LCSH tree shows a large and complex structure. The analysis of the distribution of information within the LCSH tree reveals a power law distribution where the vast majority of subjects contain few information items and a few subjects contain the vast majority of the collection.

After a detailed analysis of records from the McGill University Libraries (204,430 topical authority records) and 130,940 bibliographic records (Schulich Science and Engineering Library), the authors conclude in part:

This revealed that the structure was large, highly redundant due to multiple inheritances, very deep, and unbalanced. The complexity of the LCSH tree is a likely usability barrier for subject browsing and navigation of the information collection.

For me the most compelling part of this research was the focus on LCSH as used and not as it imagines itself. Very interesting reading. A slow walk through the bibliography will interest those researching LCSH or classification more generally.

Demonstration of the power law with the use of LCSH makes one wonder about other classification systems as used.

Older Posts »

Powered by WordPress