Another Word For It Patrick Durusau on Topic Maps and Semantic Diversity

August 5, 2016

Node XL (641 Pins)

Filed under: Graphs,NodeXL,Visualization — Patrick Durusau @ 8:17 pm

Node XL

Just a quick sample:

node-xl-pins-460

That’s only a sample, another 629 await your viewing (perhaps more by the time you read this post).

I have a Pineterest account but this is the first set of pins I have chosen to follow.

Suggestions of similar visualization boards at Pinterest?

Enjoy!

January 29, 2016

Twitter Graph Analytics From NodeXL (With Questions)

Filed under: Graphics,Graphs,NodeXL,Twitter — Patrick Durusau @ 4:35 pm

I’m sure you have seen this rather impressive Twitter graphic:

node-js-graph

And you can see a larger version, with a link to the interactive version here: https://nodexlgraphgallery.org/Pages/Graph.aspx?graphID=61591

Impressive visualization but…, tell me, what can you learn from these tweets about big data?

I mean, visualization is a great tool but if I am not better informed after using the visualization than before, what’s the point?

If you go to the interactive version, you will find lists derived from the data, such as “top 10 vertices, ranked by Betweeness Centrality,” top 10 URLs in the graph and groups in the graph, top domains in the graph and groups in the graph, etc.

None of which is evident from casual inspection of the graph. (Top influencers might be if I could get the interactive version to resize but difficult unless the step between #11 and #10 was fairly large.

Nothing wrong with eye candy but for touting the usefulness of visualization, let’s look for more intuitive visualizations.

I saw this particular version in a tweet by Kirk D. Borne.

November 9, 2013

Analyzing Social Media Networks using NodeXL [D.C., Nov. 13th]

Filed under: Graphs,Microsoft,Networks,NodeXL,Visualization — Patrick Durusau @ 8:22 pm

Analyzing Social Media Networks using NodeXL by Marc Smith.

From the post:

I am excited to have the opportunity to present a NodeXL workshop with Data Community DC on November 13th at 6pm in Washington, D.C.

In this session I will describe the ways NodeXL can simplify the process of collecting, storing, analyzing, visualizing and publishing reports about connected structures. NodeXL supports the exploration of social media with import features that pull data from personal email indexes on the desktop, Twitter, Flickr, Youtube, Facebook and WWW hyperlinks.

NodeXL allows non-programmers to quickly generate useful network statistics and metrics and create visualizations of network graphs. Filtering and display attributes can be used to highlight important structures in the network. Innovative automated layouts make creating quality network visualizations simple and quick.

Apologies for the short notice but I just saw the workshop announcement today.

If you are in the D.C. area and have any interest in graphs or visualization at all, you need to catch this presentation.

If you don’t believe me, take a look at the NodeXL gallery that Marc mentions in his post:

http://nodexlgraphgallery.org/Pages/Default.aspx

Putting graph visualization into the hands of users?

April 20, 2013

NodeXL HowTo

Filed under: Excel,Graphics,NodeXL,Visualization — Patrick Durusau @ 1:18 pm

Rolling out a “How-To” Software Series

A long preface that ends with a list of posts on “how to” use NodeXL.

Looks very good!

Enjoy!

February 1, 2013

REVIEW: Crawling social media and depicting social networks with NodeXL [in 3 parts]

Filed under: NodeXL,Social Graphs,Social Media,Social Networks — Patrick Durusau @ 8:08 pm

REVIEW: Crawling social media and depicting social networks with NodeXL by Eruditio Loginquitas.appears in three parts: Part 1 of 3, Part 2 of 3 and Part 3 of 3.

From part 1:

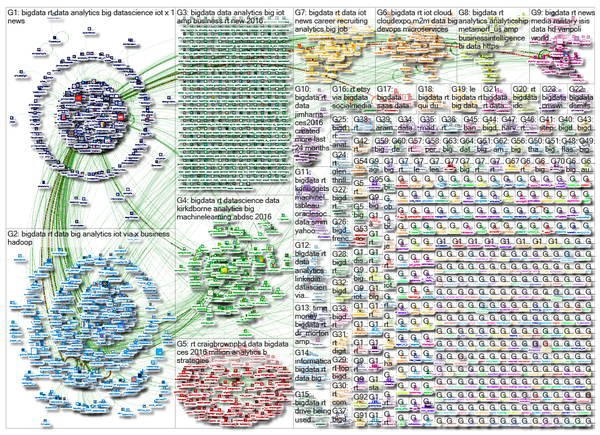
Surprisingly, given the complexity of the subject matter and the various potential uses by researchers from a range of fields, “Analyzing…” is a very coherent and highly readable text. The ideas are well illustrated throughout with full-color screenshots.

In the introduction, the authors explain that this is a spatially organized book—in the form of an organic tree. The early chapters are the roots which lay the groundwork of social media and social network analysis. Then, there is a mid-section that deals with how to use the NodeXL add-on to Excel. Finally, there are chapters that address particular social media platforms and how data is extracted and analyzed from each type. These descriptors include email, thread networks, Twitter, Facebook, WWW hyperlink networks, Flickr, YouTube, and wiki networks. The work is surprisingly succinct, clear, and practical.

Further, it is written with such range that it can serve as an introductory text for newcomers to social network analysis (me included) as well as those who have been using this approach for a while (but may need to review the social media and data crawling aspects). Taken in total, this work is highly informative, with clear depictions of the social and technical sides of social media platforms.

From part 2:

One of the strengths of “Analyzing Social Media Networks with NodeXL” is that it introduces a powerful research method and a tool that helps tap electronic media and non-electronic social network information intelligently, in a way that does not over-state what is knowable. The authors, Derek Hansen, Ben Schneiderman, and Marc A. Smith, are no strangers to research or academic publishing, and theirs is a fairly conservative approach in terms of what may be asserted.

To frame what may be researched, the authors use a range of resources: some generalized research questions, examples from real-world research, and step-by-step techniques for data extraction, analysis, visualization, and then further analysis.

From part 3:

What is most memorable about “Analyzing Social Media Networks with NodeXL” is the depth of information about the various social network sites that may be crawled using NodeXL. With so many evolving social network platforms, and each capturing and storing information differently, it helps to know what an actual data extractions mean.

I haven’t seen the book personally, but from this review it sounds like a good model for technical writing for a lay audience.

For that matter, a good model for writing about topic maps for a lay audience. (Many of the issues being similar.)

March 30, 2012

NodeXL: Network Overview, Discovery and Exploration for Excel

Filed under: Excel,Graphs,Networks,NodeXL — Patrick Durusau @ 4:37 pm

NodeXL: Network Overview, Discovery and Exploration for Excel

From the webpage:

NodeXL is a free, open-source template for Microsoft® Excel® 2007 and 2010 that makes it easy to explore network graphs. With NodeXL, you can enter a network edge list in a worksheet, click a button and see your graph, all in the familiar environment of the Excel window.

NodeXL Features

  • Flexible Import and Export Import and export graphs in GraphML, Pajek, UCINet, and matrix formats.
  • Direct Connections to Social Networks Import social networks directly from Twitter, YouTube, Flickr and email, or use one of several available plug-ins to get networks from Facebook, Exchange and WWW hyperlinks.
  • Zoom and Scale Zoom into areas of interest, and scale the graph’s vertices to reduce clutter.
  • Flexible Layout Use one of several “force-directed” algorithms to lay out the graph, or drag vertices around with the mouse. Have NodeXL move all of the graph’s smaller connected components to the bottom of the graph to focus on what’s important.
  • Easily Adjusted Appearance Set the color, shape, size, label, and opacity of individual vertices by filling in worksheet cells, or let NodeXL do it for you based on vertex attributes such as degree, betweenness centrality or PageRank.
  • Dynamic Filtering Instantly hide vertices and edges using a set of sliders—hide all vertices with degree less than five, for example.
  • Powerful Vertex Grouping Group the graph’s vertices by common attributes, or have NodeXL analyze their connectedness and automatically group them into clusters. Make groups distinguishable using shapes and color, collapse them with a few clicks, or put each group in its own box within the graph. “Bundle” intergroup edges to make them more manageable.
  • Graph Metric Calculations Easily calculate degree, betweenness centrality, closeness centrality, eigenvector centrality, PageRank, clustering coefficient, graph density and more.
  • Task Automation Perform a set of repeated tasks with a single click.

Homepage for NodeXL, which uses Excel as the framework for display and exploration of graphs.

There is something to be said about software that ties itself to other successful software. I think that is “increased chances of success.” Don’t you?

NodeGL: An online interactive viewer for NodeXL graphs uploaded to Google Spreadsheet

Filed under: Gephi,Graphs,NodeGL,NodeXL — Patrick Durusau @ 4:36 pm

NodeGL: An online interactive viewer for NodeXL graphs uploaded to Google Spreadsheet.

Martin Hawksey writes:

Recently Tony (Hirst) tipped me off about a new viewer for Gephi graphs. Developed by Raphaël Velt it uses JavaScript to parse Gephi .gefx files and output the result on a HTML5 canvas. The code for the viewer is on github available under a MIT license if you want to download and remash, I’ve also put an instance here if you want to play. Looking for a solution to render NodeXL data from a Google Spreadsheet in a similar way here is some background in the development of NodeGL – an online viewer of NodeXL graphs hosted on Google Spreadsheets

Introduction to NodeGL.

Powered by WordPress