Another Word For It Patrick Durusau on Topic Maps and Semantic Diversity

December 29, 2016

Flashing/Mooning Data Collection Worksheet Instructions

Filed under: Data Collection,Politics,Protests — Patrick Durusau @ 4:56 pm

President-elect Trump’s inauguration will be like no other. To assist with collecting data on flashing/mooning of Donald Trump on January 20, 2017, I created:

Trump Inauguration 2017: Flashing/Mooning Worksheet Instructions

It captures:

  1. Location
  2. Time Period
  3. Flash/Moon Count
  4. Gender (M/F) Count (if known)

I’ve tried to keep it simple because at most locations, it will be hard to open your eyes not see flashing/mooning.

You’ve seen photo-flashes are almost stroboscopic? That’s close the anticipated rate of flashing/mooning at the Trump inauguration.

The Trump inauguration may turn into an informal competition between rival blocks of flashing/mooning.

Without flashing/mooning data, how can Bob Costas do color commentary at the 2021 inauguration?

Let’s help Bob out and collect that flashing/mooning data in 2017!

Thanks! Please circulate the worksheet and references to this post.

February 24, 2016

Import Table Into Google Spreadsheet – Worked Example – Baby Blue’s

Filed under: Data Collection,Data Conversion — Patrick Durusau @ 4:05 pm

I encountered a post by Zach Klein with the title: You can automatically scrape and import any table or list from any URL into Google Spreadsheets.

As an image of his post:

zach-klein

Despite it having 1,844 likes and 753 retweets, I had to test it before posting it here. 😉

An old habit born of not cited anything I haven’t personally checked. It means more reading but you get to commit your own mistakes and are not limited to the mistakes made by others.

Anyway, I thought of the HTML version of Baby Blue’s Manual of Legal Citation as an example.

After loading that URL, view the source of the page because we want to search for table elements in the text. There are display artifacts that look like tables but are lists, etc.

The table I chose was #11, which appears in Baby Blue’s as:

bb-court

So I opened up a blank Google Spreadsheet and entered:

=ImportHTML("https://law.resource.org/pub/us/code/blue/
BabyBlue.20160205.html", "table", 11)

in the top left cell.

The results:

bb-court-gs

I’m speculating but Google Spreadsheets appears to have choked on the entities used around “name” in the entry for Borough court.

If you’re not fluent with XSLT or XQuery, importing tables and lists into Google Spreadsheets is an easy way to capture information.

May 8, 2015

Hubble Ultra Deep Field

Filed under: Astroinformatics,Data Collection — Patrick Durusau @ 8:34 pm

Hubble Ultra Deep Field: UVUDF: Ultraviolet Imaging of the HUDF with WFC3

From the webpage:

HST Program 12534 (Principal Investigator: Dr. Harry Teplitz)

Project Overview Paper: Teplitz, H. et al. (2013), AJ 146, 159

Science Project Home Page: http://uvudf.ipac.caltech.edu/

The Hubble UltraDeep Field (UDF) previously had deep observations at Far-UV, optical (B-z), and NIR wavelengths (Beckwith et al. 2006; Siana et al. 2007, Bouwens et al. 2011; Ellis et al. 2013; Koekemoer et al. 2013; Illingworth et al. 2013), but only comparatively shallow near-UV (u-band) imaging from WFPC2. With this new UVUDF project (Teplitz et al. 2013), we fill this gap in UDF coverage with deep near-ultraviolet imaging with WFC3-UVIS in F225W, F275W, and F336W. In the spirit of the UDF, we increase the legacy value of the UDF by providing science quality mosaics, photometric catalogs, and improved photometric redshifts to enable a wide range of research by the community. The scientific emphasis of this project is to investigate the episode of peak star formation activity in galaxies at 1 < z < 2.5. The UV data are intended to enable identification of galaxies in this epoch via the Lyman break and can allow us to trace the rest-frame FUV luminosity function and the internal color structure of galaxies, as well as measuring the star formation properties of moderate redshift starburst galaxies including the UV slope. The high spatial resolution of UVIS (a physical scale of about 700 pc at 0.5 < z < 1.5) enable the investigation of the evolution of massive galaxies by resolving sub-galactic units (clumps). We will measure (or set strict limits on) the escape fraction of ionizing radiation from galaxies at z~2-3 to better understand how star-forming galaxies reionized the Universe. Data were obtained in three observing Epochs, each using one of two observing modes (as described in Teplitz et al. 2013). Epochs 1 and 2 together obtained about 15 orbits of data per filter, and Epoch 3 obtained another 15 orbits per filter. In the second release, we include Epoch 3, which includes all the data that were obtained using post-flash (the UVIS capability to add internal background light), to mitigate the effects of degradation of the charge transfer efficiency of the detectors (Mackenty & Smith 2012). The data were reduced using a combination of standard and custom calibration scripts (see Rafelski et al. 2015), including the use of software to correct for charge transfer inefficiency and custom super dark files. The individual reduced exposures were then registered and combined using a modified version of the MosaicDrizzle pipeline (see Koekemoer et al. 2011 and Rafelski et al. 2015 for further details) and are all made available here. In addition to the image mosaics, an aperture matched PSF corrected photometric catalog is made available, including photometric and spectroscopic redshifts in the UDF. The details of the catalog and redshifts are described in Rafelski et al. (2015). If you use these mosaics or catalog, please cite Teplitz et al. (2013) and Rafelski et al. (2015).

Open but also challenging data.

This is an example of how to document the collection and processing of data sets.

Enjoy!

April 22, 2015

Gathering, Extracting, Analyzing Chemistry Datasets

Filed under: Cheminformatics,Chemistry,Curation,Data Aggregation,Data Collection — Patrick Durusau @ 7:38 pm

Activities at the Royal Society of Chemistry to gather, extract and analyze big datasets in chemistry by Antony Williams.

If you are looking for a quick summary of efforts to combine existing knowledge resources in chemistry, you can do far worse than Antony’s 118 slides on the subject (2015).

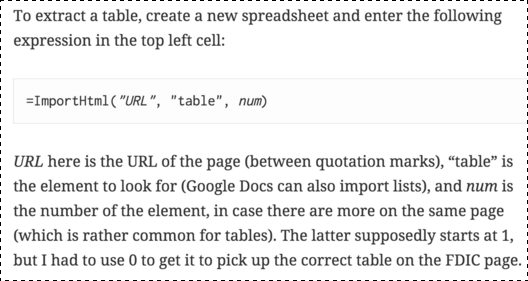
I want to call special attention to Slide 107 in his slide deck:

chemistry-antony-22April2015

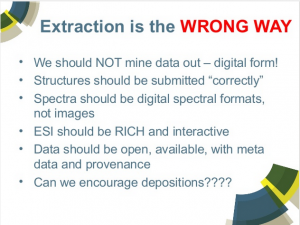
True enough, extraction is problematic, expensive, inaccurate, etc., all the things Antony describes. And I would strongly second all of what he implies is the better practice.

However, extraction isn’t just a necessity for today or for a few years, extraction is going to be necessary so long as we keep records about chemistry or any other subject.

Think about all the legacy materials on chemistry that exist in hard copy format just for the past two centuries. To say nothing of all of still older materials. It is more than unfortunate to abandon all that information simply because “modern” digital formats are easier to manipulate.

That was’t what Antony meant to imply but even after all materials have been extracted and exist in some form of digital format, that doesn’t mean the era of “extraction” will have ended.

You may not remember when atomic chemistry used “punch cards” to record isotopes:

isotope-punch-card

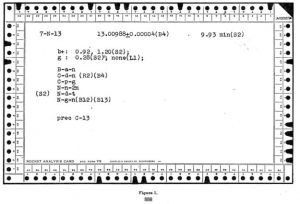
An isotope file on punched cards. George M. Murphy J. Chem. Educ., 1947, 24 (11), p 556 DOI: 10.1021/ed024p556 Publication Date: November 1947.

Today we would represent that record in…NoSQL?

Are you confident that in another sixty-eight (68) years we will still be using NoSQL?

We have to choose from the choices available to us today, but we should not deceive ourselves into thinking our solution will be seen as the “best” solution in the future. New data will be discovered, new processes invented, new requirements will emerge, all of which will be clamoring for a “new” solution.

Extraction will persist as long as we keep recording information in the face of changing formats and requirements. We can improve that process but I don’t think we will ever completely avoid it.

November 23, 2014

October 16, 2013

Research Methodology [How Good Is Your Data?]

Filed under: Data Collection,Data Quality,Data Science — Patrick Durusau @ 3:42 pm

The presenters in a recent webinar took great pains to point out all the questions a user should be asking about data.

Questions like how representative a population was surveyed or how representative is the data, how were survey questions tested, selection biases, etc., it was like a flash back to empirical methodology in a political science course I took years ago.

It hadn’t occurred to me that some users of data (or “big data” if you prefer) might not have empirical methodology reflexes.

That would account for people who use Survey Monkey and think the results aren’t a reflection of themselves.

Doesn’t have to be. A professional survey person could use the same technology and possibly get valid results.

But the ability to hold a violin doesn’t mean you can play one.

Resources that you may find useful:

Political Science Scope and Methods

Description:

This course is designed to provide an introduction to a variety of empirical research methods used by political scientists. The primary aims of the course are to make you a more sophisticated consumer of diverse empirical research and to allow you to conduct advanced independent work in your junior and senior years. This is not a course in data analysis. Rather, it is a course on how to approach political science research.

Berinsky, Adam. 17.869 Political Science Scope and Methods, Fall 2010. (MIT OpenCourseWare: Massachusetts Institute of Technology), http://ocw.mit.edu/courses/political-science/17-869-political-science-scope-and-methods-fall-2010 (Accessed 16 Oct, 2013). License: Creative Commons BY-NC-SA

Qualitative Research: Design and Methods

Description:

This course is intended for graduate students planning to conduct qualitative research in a variety of different settings. Its topics include: Case studies, interviews, documentary evidence, participant observation, and survey research. The primary goal of this course is to assist students in preparing their (Masters and PhD) dissertation proposals.

Locke, Richard. 17.878 Qualitative Research: Design and Methods, Fall 2007. (MIT OpenCourseWare: Massachusetts Institute of Technology), http://ocw.mit.edu/courses/political-science/17-878-qualitative-research-design-and-methods-fall-2007 (Accessed 16 Oct, 2013). License: Creative Commons BY-NC-SA

Introduction to Statistical Method in Economics

Description:

This course is a self-contained introduction to statistics with economic applications. Elements of probability theory, sampling theory, statistical estimation, regression analysis, and hypothesis testing. It uses elementary econometrics and other applications of statistical tools to economic data. It also provides a solid foundation in probability and statistics for economists and other social scientists. We will emphasize topics needed in the further study of econometrics and provide basic preparation for 14.32. No prior preparation in probability and statistics is required, but familiarity with basic algebra and calculus is assumed.

Bennett, Herman. 14.30 Introduction to Statistical Method in Economics, Spring 2006. (MIT OpenCourseWare: Massachusetts Institute of Technology), http://ocw.mit.edu/courses/economics/14-30-introduction-to-statistical-method-in-economics-spring-2006 (Accessed 16 Oct, 2013). License: Creative Commons BY-NC-SA

Every science program, social or otherwise, will offer some type of research methods course. The ones I have listed are only the tip of a very large iceberg of courses and literature.

With a little effort you can acquire an awareness of what wasn’t said about data collection, processing or analysis.

September 1, 2013

Sane Data Updates Are Harder Than You Think

Filed under: Data,Data Collection,Data Quality,News — Patrick Durusau @ 6:35 pm

Sane Data Updates Are Harder Than You Think by Adrian Holovaty.

From the post:

This is the first in a series of three case studies about data-parsing problems from a journalist’s perspective. This will be meaty, this will be hairy, this will be firmly in the weeds.

We’re in the middle of an open-data renaissance. It’s easier than ever for somebody with basic tech skills to find a bunch of government data, explore it, combine it with other sources, and republish it. See, for instance, the City of Chicago Data Portal, which has hundreds of data sets available for immediate download.

But the simplicity can be deceptive. Sure, the mechanics of getting data are easy, but once you start working with it, you’ll likely face a variety of rather subtle problems revolving around data correctness, completeness, and freshness.

Here I’ll examine some of the most deceptively simple problems you may face, based on my eight years’ experience dealing with government data in a journalistic setting —most recently as founder of EveryBlock, and before that as creator of chicagocrime.org and web developer at washingtonpost.com. EveryBlock, which was shut down by its parent company NBC News in February 2013, was a site that gathered and sorted dozens of civic data sets geographically. It gave you a “news feed for your block”—a frequently updated feed of news and discussions relevant to your home address. In building this huge public-data-parsing machine, we dealt with many different data situations and problems, from a wide variety of sources.

My goal here is to raise your awareness of various problems that may not be immediately obvious and give you reasonable solutions. My first theme in this series is getting new or changed records.

A great introduction to deep problems that are lurking just below the surface of any available data set.

Not only do data sets change but reactions to and criticisms of data sets change.

What would you offer as an example of “stable” data?

I tried to think of one for this post and came up empty.

You could claim the text of the King Jame Bible is “stable” data.

But only from a very narrow point of view.

The printed text is stable but the opinions, criticisms, commentaries, all on the King James Bible have been anything but stable.

Imagine that you have a stock price ticker application and all it reports are the current prices for some stock X.

Is that sufficient or would it be more useful if it reported the price over the last four hours as a percentage of change?

Perhaps we need a modern data Heraclitus to proclaim:

“No one ever reads the same data twice”

May 16, 2013

Powered by WordPress