Another Word For It Patrick Durusau on Topic Maps and Semantic Diversity

May 5, 2020

Six Degrees of Corona – McConnell Edition

Filed under: Politics,Social Networks,Weaponize Data,Weaponized Open Data — Patrick Durusau @ 7:08 pm

This post is an extension of Six Degrees of Corona (New OSINT Game) which you should read first.

Six Degrees of Corona – Mitch McConnell Edition

You know the gist of the game from its similarity to six degrees of Kevin Bacon, but where would you find information for McConnell? He has no known movie credits for constructing degrees of separation.

That’s easy enough to fix. Let’s do a short list and see what others add to it:

  1. Mitch McConnell, U.S. Senator from Kentucky – McConnell’s official website. Lots of data on him and people around him. Could do a lot worse as a starting point.
  2. Federal Election Commission – You are looking for major donors, the larger the better. $20 will get you a seat to see McConnell walking away from you. I’d discard anything less than $1K.
  3. Kentucky newspapers (by circulation): The Courier-Journal, Lexington Herald-Leader, Owensboro Messenger-Inquirer, Bowling Green Daily News, and, Ashland Independent. All of these will carry news about who met with McConnell, where McConnell appears at during campaigns, fund raisers, etc. (Think co-occurrence searches.)
  4. Campaign events, photograph everyone on stage but also support personnel, who come and go without even being seen. Run image recognition on your photos.

Other sources? Put your thinking hats on!

BTW, I should mention that completing your Six Degrees of Corona – Mitch McConnell edition by reducing the degrees of separation, say by becoming a waiter or busser is cheating. Complete the six degrees of separation.

May 4, 2020

Six Degrees of Corona (New OSINT Game)

Most of you have heard of “six degrees of Kevin Bacon,”

The game, which celebrates its 20th anniversary this year, requires players to link celebrities to Bacon, in as few steps as possible, via the movies they have in common. The more odd or random the celebrity, the better. For example, O.J. Simpson was in “The Naked Gun 33⅓” with Olympia Dukakis, who was in “Picture Perfect” with Kevin Bacon.

Kevin Bacon on ‘Six Degrees’ game: ‘I was horrified’ by Brandon Griggs. March 12, 2014.

The more general case, “six degrees of separation” between any two people in the world is usually shown as:

Generic Six Degress of Separation Diagram

Kevin Bacon is interesting for trivia purposes but he returns only 49K mentions on Twitter today. Compare President Trump grosses ~3.2 million and Joe Biden at ~2.6 million (both exact phrases so didn’t capture nicknames or obcenities).

To make an OSINT game, who are the people you can identify with either Donald Trump or Joe Biden? Those go between #5 and #6, then proceeding from them, who should go between #4 and #5? As you proceed right to left, it requires more digging to fish up people who can provide the bridge.

You will need all your OSINT skills as you compete against others to find the best path to people more popular, or should I say more notorious than Kevin Bacon?

Here are two templates, depending upon your political persuasion to get you started with the Six Degrees of Corona:

Six Degrees of Corona – Trump version.

Six Degrees of Corona – Biden version

Some wag is going to gift us with their deep legal knowledge to proclaim that intentional transmission of a disease is illegal. It’s also a violation of the Biological Weapons Convention. It’s also likely a battery (civil and criminal) in most jurisdictions. None of which is relevant to an OSINT game to sharpen your skills. The choices of images (you can supply your own) is only a matter of motivation.

Feel free to circulate these images or to create your own Six Degrees of Corona OSINT game, substituting other images as you deem appropriate.

PS: My money is on Jared being #5 for Trump. No data science for that opinion but he reeks of the closeness that would transmit most diseases.

September 27, 2019

Weaponizing Your Information?

Filed under: Advertising,Fake News,Social Media,Social Networks — Patrick Durusau @ 8:29 pm

Study: Weaponized misinformation from political parties is now a global problem by Cara Curtis.

Social media, a tool created to guard freedom of speech and democracy, has increasingly been used in more sinister ways.

Memory check! Memory check! Is that how you remember the rise of social media? Have you ever thought of usenet as guarding freedom of speech (maybe) and democracy (unlikely)?

The Global Information Disorder report, the basis for Curtis’ report, treats techniques and tactics at a high level view, leaving you to file in the details for an information campaign. I prefer information as “disinformation” is in the eye of the reader.

I don’t have cites (apologies) to advertising literature on the shaping of information content for ads. Techniques known to work for advertisers, who have spent decades and $billions sharpening their techniques, should work for spreading information as well. Suggested literature?

June 30, 2018

What’s Your Viral Spread Score?

Filed under: Fake News,News,Social Media,Social Networks — Patrick Durusau @ 4:13 pm

The Hoaxy homepage reports:

Visualize the spread of claims and fact checking.

Of course, when you get into the details, out of the box, Hoaxy isn’t setup to measure your ability to spread virally.

From the FAQ:


How does Hoaxy search work?

The Hoaxy corpus tracks the social sharing of links to stories published by two types of websites: (1) Low-credibility sources that often publish inaccurate, unverified, or satirical claims according to lists compiled and published by reputable news and fact-checking organizations. (2) Independent fact-checking organizations, such as snopes.com, politifact.com, and factcheck.org, that routinely fact check unverified claims.

What does the visualization show?

Hoaxy visualizes two aspects of the spread of claims and fact checking: temporal trends and diffusion networks. Temporal trends plot the cumulative number of Twitter shares over time. The user can zoom in on any time interval. Diffusion networks display how claims spread from person to person. Each node is a Twitter account and two nodes are connected if a link to a story is passed between those two accounts via retweets, replies, quotes, or mentions. The color of a connection indicates the type of information: claims and fact checks. Clicking on an edge reveals the tweet(s) and the link to the shared story; clicking on a node reveals claims shared by the corresponding user. The network may be pruned for performance.

(emphasis in original)

Bottom line is you won’t be able to ask someone for their Hoaxy score. Sorry.

On the bright side, the Hoaxy frontend and backend source code is available, so you can create a customized version (not using the Hoaxy name) with different capabilities.

The other good news is that you can study the techniques of messages that do spread virally, so you can get better at creating messages that go viral.

April 25, 2018

Breaking Non-News: Twitter Has Echo Chambers (Co-Occupancy of Echo Chambers)

Filed under: Politics,Social Media,Social Networks — Patrick Durusau @ 9:55 am

Political Discourse on Social Media: Echo Chambers, Gatekeepers, and the Price of Bipartisanship by Kiran Garimella, Gianmarco De Francisci Morales, Aristides Gionis, Michael Mathioudakis.

Abstract:

Echo chambers, i.e., situations where one is exposed only to opinions that agree with their own, are an increasing concern for the political discourse in many democratic countries. This paper studies the phenomenon of political echo chambers on social media. We identify the two components in the phenomenon: the opinion that is shared (‘echo’), and the place that allows its exposure (‘chamber’ — the social network), and examine closely at how these two components interact. We define a production and consumption measure for social-media users, which captures the political leaning of the content shared and received by them. By comparing the two, we find that Twitter users are, to a large degree, exposed to political opinions that agree with their own. We also find that users who try to bridge the echo chambers, by sharing content with diverse leaning, have to pay a ‘price of bipartisanship’ in terms of their network centrality and content appreciation. In addition, we study the role of ‘gatekeepers’, users who consume content with diverse leaning but produce partisan content (with a single-sided leaning), in the formation of echo chambers. Finally, we apply these findings to the task of predicting partisans and gatekeepers from social and content features. While partisan users turn out relatively easy to identify, gatekeepers prove to be more challenging.

This is an interesting paper from a technical perspective, especially their findings on gatekeepers, but political echo chambers in Twitter is hardly surprising. Nor are political echo chambers new.

SourceWatch has a limited (time wise) history of echo chambers and attributes the creation of echo chambers to conservatives:

…conservatives pioneered the “echo chamber” technique,…

Amusing but I would not give conservatives that much credit.

Consider the echo chambers created by the Wall Street Journal (WSJ) versus the Guardian (formerly National Guardian, published in New York City), a Marxist publication, in the 1960’s.

Or the differing content read by pro verus anti-war activists in the same time period. Or racists versus pro-integration advocates. Or pro versus anti Row v. Wade 410 U.S. 113 (more) 93 S. Ct. 705, 35 L. Ed. 2d 147, 1973 U.S. LEXIS 159) supporters.

Echo chambers existed before the examples I have listed but those are sufficient to show echo chambers are not new, despite claims by those who missed secondary education history classes.

The charge of “echo chamber” by SourceWatch, for example, carries with it an assumption that information delivered via an “echo chamber” is false, harmful, etc., versus their information, which leads to the truth, light and the American way. (Substitute whatever false totems you have for “the American way.”)

I don’t doubt the sincerity SourceWatch. I doubt approaching others saying “…you need to crawl out from under your rock so I can enlighten you with the truth” leads to a reduction in echo chambers.

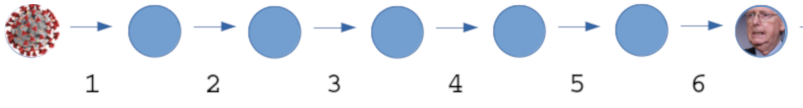
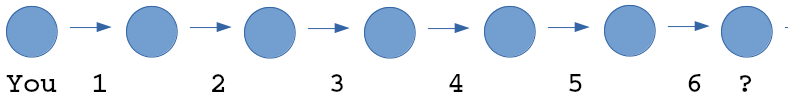
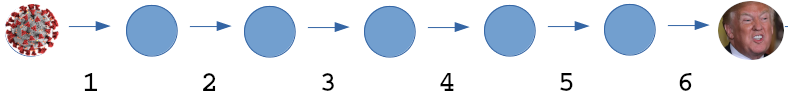
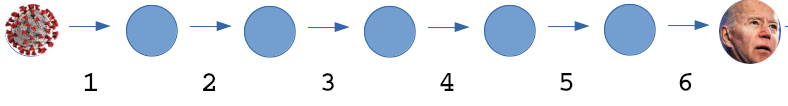
Becoming a gatekeeper, with a foot in two or more echo chambers won’t reduce the number of echo chambers either. But that does have the potential to have gateways between echo chambers.

You’ve tried beating on occupants of other echo chambers with little or no success. Why not try co-occupying their echo chambers for a while?

February 28, 2018

Liberals Amping Right Wing Conspiracies

Filed under: Fake News,News,Social Media,Social Networks — Patrick Durusau @ 9:19 pm

You read the headline correctly: Liberals Amping Right Wing Conspiracies.

It’s the only reasonable conclusion after reading Molly McKew‘s post: How Liberals Amped up a Paranoid Shooting Conspiracy Theory.

From the post:


This terminology camouflages the war for minds that is underway on social media platforms, the impact that this has on our cognitive capabilities over time, and the extent to which automation is being engaged to gain advantage. The assumption, for example, that other would-be participants in social media information wars who choose to use these same tactics will gain the same capabilities or advantage is not necessarily true. This is a playing field that is hard to level: Amplification networks have data-driven, machine learning components that work better with refinement over time. You can’t just turn one on and expect it to work perfectly.

The vast amounts of content being uploaded every minute cannot possibly be reviewed by human beings. Algorithms, and the poets who sculpt them, are thus given an increasingly outsized role in the shape of our information environment. Human minds are on a battlefield between warring AIs—caught in the crossfire between forces we can’t see, sometimes as collateral damage and sometimes as unwitting participants. In this blackbox algorithmic wonderland, we don’t know if we are picking up a gun or a shield.

McKew has a great description of the amplification in the Parkland shooting conspiracy case, but it’s after the fact and not a basis for predicting the next amplification event.

Any number of research projects suggest themselves:

  • Observing and testing social media algorithms against content
  • Discerning patterns in amplified content
  • Testing refinement of content
  • Building automated tools to apply lessons in amplification

No doubt all those are underway in various guises for any number of reasons. But are you going to share in those results to protect your causes?

September 18, 2017

Game of Thrones, Murder Network Analysis

Filed under: Games,Graphs,Networks,Social Graphs,Social Networks,Visualization — Patrick Durusau @ 1:03 pm

Game of Thrones, Murder Network Analysis by George McIntire.

From the post:

Everybody’s favorite show about bloody power struggles and dragons, Game of Thrones, is back for its seventh season. And since we’re such big GoT fans here, we just had to do a project on analyzing data from the hit HBO show. You might not expect it, but the show is rife with data and has been the subject of various data projects from data scientists, who we all know love to combine their data powers with the hobbies and interests.

Milan Janosov of the Central European University devised a machine learning algorithm to predict the death of certain characters. A handy tool, for any fan tired of being surprised by the shock murders of the show. Dr. Allen Downey, author of the popular ThinkStats textbooks conducted a Bayesian analysis of the characters’ survival rate in the show. Data Scientist and biologist Shirin Glander applied social network analysis tools to analyze and visualize the family and house relationships of the characters.

The project we did is quite similar to that of Glander’s, we’ll be playing around with network analysis, but with data on the murderers and their victims. We constructed a giant network that maps out every murder of character’s with minor, recurring, and major roles.

The data comes courtesy of Ændrew Rininsland of The Financial Times, who’s done a great of collecting, cleaning, and formatting the data. For the purposes of this project, I had to do a whole lot of wrangling and cleaning of my own and in addition to my subjective decisions about which characters to include as well and what constitutes a murder. My finalized dataset produced a total of of 240 murders from 79 killers. For my network graph, the data produced a total of 225 nodes and 173 edges.

I prefer the Game of Thrones (GoT) books over the TV series. The text exercises a reader’s imagination in ways that aren’t matched by visual media.

That said, the TV series murder data set (Ændrew Rininsland of The Financial Times) is a great resource to demonstrate the power of network analysis.

After some searching, it appears that sometime in 2018 is the earliest date for the next volume in the GoT series. Sorry.

February 25, 2017

Availability Cascades [Activists Take Note, Big Data Project?]

Filed under: Cascading,Chaos,Government,Social Media,Social Networks — Patrick Durusau @ 8:37 pm

Availability Cascades and Risk Regulation by Timur Kuran and Cass R. Sunstein, Stanford Law Review, Vol. 51, No. 4, 1999, U of Chicago, Public Law Working Paper No. 181, U of Chicago Law & Economics, Olin Working Paper No. 384.

Abstract:

An availability cascade is a self-reinforcing process of collective belief formation by which an expressed perception triggers a chain reaction that gives the perception of increasing plausibility through its rising availability in public discourse. The driving mechanism involves a combination of informational and reputational motives: Individuals endorse the perception partly by learning from the apparent beliefs of others and partly by distorting their public responses in the interest of maintaining social acceptance. Availability entrepreneurs – activists who manipulate the content of public discourse – strive to trigger availability cascades likely to advance their agendas. Their availability campaigns may yield social benefits, but sometimes they bring harm, which suggests a need for safeguards. Focusing on the role of mass pressures in the regulation of risks associated with production, consumption, and the environment, Professor Timur Kuran and Cass R. Sunstein analyze availability cascades and suggest reforms to alleviate their potential hazards. Their proposals include new governmental structures designed to give civil servants better insulation against mass demands for regulatory change and an easily accessible scientific database to reduce people’s dependence on popular (mis)perceptions.

Not recent, 1999, but a useful starting point for the study of availability cascades.

The authors want to insulate civil servants where I want to exploit availability cascades to drive their responses but that’a question of perspective and not practice.

Google Scholar reports 928 citations of Availability Cascades and Risk Regulation, so it has had an impact on the literature.

However, availability cascades are not a recipe science but Networks, Crowds, and Markets: Reasoning About a Highly Connected World by David Easley and Jon Kleinberg, especially chapters 16 and 17, provide a background for developing such insights.

I started to suggest this would make a great big data project but big data projects are limited to where you have, well, big data. Certainly have that with Facebook, Twitter, etc., but that leaves a lot of the world’s population and social activity on the table.

That is to avoid junk results, you would need survey instruments to track any chain reactions outside of the bots that dominate social media.

Very high end advertising, which still misses with alarming regularity, would be a good place to look for tips on availability cascades. They have a profit motive to keep them interested.

February 23, 2017

Building an Online Profile:… [Toot Your Own Horn]

Filed under: Marketing,Social Media,Social Networks — Patrick Durusau @ 9:50 am

Building an Online Profile: Social Networking and Amplification Tools for Scientists by Antony Williams.

Seventy-seven slides from a February 22, 2017 presentation at NC State University on building an online profile.

Pure gold, whether you are building your profile or one for alternate identity. 😉

I like this slide in particular:

Take the “toot your own horn” advice to heart.

Your posts/work will never be perfect so don’t wait for that before posting.

Any errors you make are likely to go unnoticed until you correct them.

May 4, 2016

Network structure and resilience of Mafia syndicates

Filed under: Networks,Social Networks — Patrick Durusau @ 7:11 pm

Network structure and resilience of Mafia syndicates by Santa Agrestea, Salvatore Catanesea, Pasquale De Meoc, Emilio Ferrara, Giacomo Fiumaraa.

Abstract:

In this paper we present the results of our study of Sicilian Mafia organizations using social network analysis. The study investigates the network structure of a Mafia syndicate, describing its evolution and highlighting its plasticity to membership-targeting interventions and its resilience to disruption caused by police operations. We analyze two different datasets dealing with Mafia gangs that were built by examining different digital trails and judicial documents that span a period of ten years. The first dataset includes the phone contacts among suspected individuals, and the second captures the relationships among individuals actively involved in various criminal offenses. Our report illustrates the limits of traditional investigative methods like wiretapping. Criminals high up in the organization hierarchy do not occupy the most central positions in the criminal network, and oftentimes do not appear in the reconstructed criminal network at all. However, we also suggest possible strategies of intervention. We show that, although criminal networks (i.e., the network encoding mobsters and crime relationships) are extremely resilient to different kinds of attacks, contact networks (i.e., the network reporting suspects and reciprocated phone calls) are much more vulnerable, and their analysis can yield extremely valuable insights.

Studying the vulnerabilities identified here may help you strengthen your own networks against similar analysis.

To give you the perspective of the authors:

Due to its normative structure as well as strong ties with finance, entrepreneurs and politicians, Mafia has now risen to prominence as a worldwide criminal organization by controlling many illegal activities like the trade of cocaine, money laundering or illegal military weapon trafficking [4].

They say that as though it is a bad thing. As Neal Stephenson says in Snow Crash, the Mafia is just another franchise. 😉

Understanding the model others expect enables you to expose a model that doesn’t match their expectations.

Think of it as hiding in plain sight.

April 5, 2016

NSA-grade surveillance software: IBM i2 Analyst’s Notebook (Really?)

Filed under: Government,Graphs,Neo4j,NSA,Privacy,Social Networks — Patrick Durusau @ 8:20 pm

I stumbled across Revealed: Denver Police Using NSA-Grade Surveillance Software which had this description of “NSA-grade surveillance software…:”


Intelligence gathered through Analyst’s Notebook is also used in a more active way to guide decision making, including with deliberate targeting of “networks” which could include loose groupings of friends and associates, as well as more explicit social organizations such as gangs, businesses, and potentially political organizations or protest groups. The social mapping done with Analyst’s Notebook is used to select leads, targets or points of intervention for future actions by the user. According to IBM, the i2 software allows the analyst to “use integrated social network analysis capabilities to help identify key individuals and relationships within networks” and “aid the decision-making process and optimize resource utilization for operational activities in network disruption, surveillance or influencing.” Product literature also boasts that Analyst’s Notebook “includes Social Network Analysis capabilities that are designed to deliver increased comprehension of social relationships and structures within networks of interest.”

Analyst’s Notebook is also used to conduct “call chaining” (show who is talking to who) and analyze telephone metadata. A software extension called Pattern Tracer can be used for “quickly identifying potential targets”. In the same vein, the Esri Edition of Analyst’s Notebook integrates powerful geo-spatial mapping, and allows the analyst to conduct “Pattern-of-Life Analysis” against a target. A training video for Analyst’s Notebook Esri Edition demonstrates the deployment of Pattern of Life Analysis in a military setting against an example target who appears appears to be a stereotyped generic Muslim terrorism suspect:

Perhaps I’m overly immune to IBM marketing pitches but I didn’t see anything in this post that could not be done with Python, R and standard visualization techniques.

I understand that IBM markets the i2 Analyst’s Notebook (and training too) as:

…deliver[ing] timely, actionable intelligence to help identify, predict, prevent and disrupt criminal, terrorist and fraudulent activities.

to a reported tune of over 2,500 organizations worldwide.

However, you have to bear in mind the software isn’t delivering that value-add but rather the analyst plus the right data and the IBM software. That is the software is at best only one third of what is required for meaningful results.

That insight seems to have gotten lost in IBM’s marketing pitch for the i2 Analyst’s Notebook and its use by the Denver police.

But to be fair, I have included below the horizontal bar, the complete list of features for the i2 Analyst’s Notebook.

Do you see any that can’t be duplicated with standard software?

I don’t.

That’s another reason to object to the Denver Police falling into the clutches of maintenance agreements/training on software that is likely irrelevant to their day to day tasks.


IBM® i2® Analyst’s Notebook® is a visual intelligence analysis environment that can optimize the value of massive amounts of information collected by government agencies and businesses. With an intuitive and contextual design it allows analysts to quickly collate, analyze and visualize data from disparate sources while reducing the time required to discover key information in complex data. IBM i2 Analyst’s Notebook delivers timely, actionable intelligence to help identify, predict, prevent and disrupt criminal, terrorist and fraudulent activities.

i2 Analyst’s Notebook helps organizations to:

Rapidly piece together disparate data

Identify key people, events, connections and patterns

Increase understanding of the structure, hierarchy and method of operation

Simplify the communication of complex data

Capitalize on rapid deployment that delivers productivity gains quickly

Be sure to leave a comment if you see “NSA-grade” capabilities. We would all like to know what those are.

December 25, 2015

The Social-Network Illusion That Tricks Your Mind – (Terrorism As Majority Illusion)

Filed under: Networks,Social Media,Social Networks — Patrick Durusau @ 5:19 pm

The Social-Network Illusion That Tricks Your Mind

From the post:

One of the curious things about social networks is the way that some messages, pictures, or ideas can spread like wildfire while others that seem just as catchy or interesting barely register at all. The content itself cannot be the source of this difference. Instead, there must be some property of the network that changes to allow some ideas to spread but not others.

Today, we get an insight into why this happens thanks to the work of Kristina Lerman and pals at the University of Southern California. These people have discovered an extraordinary illusion associated with social networks which can play tricks on the mind and explain everything from why some ideas become popular quickly to how risky or antisocial behavior can spread so easily.

Network scientists have known about the paradoxical nature of social networks for some time. The most famous example is the friendship paradox: on average your friends will have more friends than you do.

This comes about because the distribution of friends on social networks follows a power law. So while most people will have a small number of friends, a few individuals have huge numbers of friends. And these people skew the average.

Here’s an analogy. If you measure the height of all your male friends. you’ll find that the average is about 170 centimeters. If you are male, on average, your friends will be about the same height as you are. Indeed, the mathematical notion of “average” is a good way to capture the nature of this data.

But imagine that one of your friends was much taller than you—say, one kilometer or 10 kilometers tall. This person would dramatically skew the average, which would make your friends taller than you, on average. In this case, the “average” is a poor way to capture this data set.

If that has you interested, see:

The Majority Illusion in Social Networks by Kristina Lerman, Xiaoran Yan, Xin-Zeng Wu.

Abstract:

Social behaviors are often contagious, spreading through a population as individuals imitate the decisions and choices of others. A variety of global phenomena, from innovation adoption to the emergence of social norms and political movements, arise as a result of people following a simple local rule, such as copy what others are doing. However, individuals often lack global knowledge of the behaviors of others and must estimate them from the observations of their friends’ behaviors. In some cases, the structure of the underlying social network can dramatically skew an individual’s local observations, making a behavior appear far more common locally than it is globally. We trace the origins of this phenomenon, which we call “the majority illusion,” to the friendship paradox in social networks. As a result of this paradox, a behavior that is globally rare may be systematically overrepresented in the local neighborhoods of many people, i.e., among their friends. Thus, the “majority illusion” may facilitate the spread of social contagions in networks and also explain why systematic biases in social perceptions, for example, of risky behavior, arise. Using synthetic and real-world networks, we explore how the “majority illusion” depends on network structure and develop a statistical model to calculate its magnitude in a network.

Research has not reached the stage of enabling the manipulation of public opinion to reflect the true rarity of terrorist activity in the West.

That being the case, being factually correct that Western fear of terrorism is a majority illusion isn’t as profitable as product tying to that illusion.

May 21, 2015

Twitter As Investment Tool

Filed under: Social Media,Social Networks,Social Sciences,Twitter — Patrick Durusau @ 12:44 pm

Social Media, Financial Algorithms and the Hack Crash by Tero Karppi and Kate Crawford.

Abstract:

@AP: Breaking: Two Explosions in the White House and Barack Obama is injured’. So read a tweet sent from a hacked Associated Press Twitter account @AP, which affected financial markets, wiping out $136.5 billion of the Standard & Poor’s 500 Index’s value. While the speed of the Associated Press hack crash event and the proprietary nature of the algorithms involved make it difficult to make causal claims about the relationship between social media and trading algorithms, we argue that it helps us to critically examine the volatile connections between social media, financial markets, and third parties offering human and algorithmic analysis. By analyzing the commentaries of this event, we highlight two particular currents: one formed by computational processes that mine and analyze Twitter data, and the other being financial algorithms that make automated trades and steer the stock market. We build on sociology of finance together with media theory and focus on the work of Christian Marazzi, Gabriel Tarde and Tony Sampson to analyze the relationship between social media and financial markets. We argue that Twitter and social media are becoming more powerful forces, not just because they connect people or generate new modes of participation, but because they are connecting human communicative spaces to automated computational spaces in ways that are affectively contagious and highly volatile.

Social sciences lag behind the computer sciences in making their publications publicly accessible as well as publishing behind firewalls so I can report on is the abstract.

On the other hand, I’m not sure how much practical advice you could gain from the article as opposed to the volumes of commentary following the incident itself.

The research reminds me of Malcolm Gladwell, author of The Tipping Point and similar works.

While I have greatly enjoyed several of Gladwell’s books, including the Tipping Point, it is one thing to look back and say: “Look, there was a tipping point.” It is quite another to be in the present and successfully say: “Look, there is a tipping point and we can make it tip this way or that.”

In retrospect, we all credit ourselves with near omniscience when our plans succeed and we invent fanciful explanations about what we knew or realized at the time. Others, equally skilled, dedicated and competent, who started at the same time, did not succeed. Of course, the conservative media (and ourselves if we are honest), invent narratives to explain those outcomes as well.

Of course, deliberate manipulation of the market with false information, via Twitter or not, is illegal. The best you can do is look for a pattern of news and/or tweets that result in downward changes in a particular stock, which then recovers and then apply that pattern more broadly. You won’t make $millions off of any one transaction but that is the sort of thing that draws regulatory attention.

May 9, 2015

Exposure to Diverse Information on Facebook [Skepticism]

Filed under: Facebook,News,Opinions,Social Media,Social Networks,Social Sciences — Patrick Durusau @ 3:06 pm

Exposure to Diverse Information on Facebook by Eytan Bakshy, Solomon Messing, Lada Adamicon.

From the post:

As people increasingly turn to social networks for news and civic information, questions have been raised about whether this practice leads to the creation of “echo chambers,” in which people are exposed only to information from like-minded individuals [2]. Other speculation has focused on whether algorithms used to rank search results and social media posts could create “filter bubbles,” in which only ideologically appealing content is surfaced [3].

Research we have conducted to date, however, runs counter to this picture. A previous 2012 research paper concluded that much of the information we are exposed to and share comes from weak ties: those friends we interact with less often and are more likely to be dissimilar to us than our close friends [4]. Separate research suggests that individuals are more likely to engage with content contrary to their own views when it is presented along with social information [5].

Our latest research, released today in Science, quantifies, for the first time, exactly how much individuals could be and are exposed to ideologically diverse news and information in social media [1].

We found that people have friends who claim an opposing political ideology, and that the content in peoples’ News Feeds reflect those diverse views. While News Feed surfaces content that is slightly more aligned with an individual’s own ideology (based on that person’s actions on Facebook), who they friend and what content they click on are more consequential than the News Feed ranking in terms of how much diverse content they encounter.

The Science paper: Exposure to Ideologically Diverse News and Opinion

The definition of an “echo chamber” is implied in the authors’ conclusion:


By showing that people are exposed to a substantial amount of content from friends with opposing viewpoints, our findings contrast concerns that people might “list and speak only to the like-minded” while online [2].

The racism of the Deep South existed in spite of interaction between whites and blacks. So “echo chamber” should not be defined as association of like with like, at least not entirely. The Deep South was a echo chamber of racism but not for a lack of diversity in social networks.

Besides lacking a useful definition of “echo chamber,” the author’s ignore the role of confirmation bias (aka “backfire effect”) when confronted with contrary thoughts or evidence. To some readers seeing a New York Times editorial disagreeing with their position, can make them feel better about being on the “right side.”

That people are exposed to diverse information on Facebook is interesting, but until there is a meaningful definition of “echo chambers,” the role Facebook plays in the maintenance of “echo chambers” remains unknown.

April 14, 2015

₳ustral Blog

Filed under: Sentiment Analysis,Social Graphs,Social Networks,Topic Models (LDA) — Patrick Durusau @ 4:14 pm

₳ustral Blog

From the post:

We’re software developers and entrepreneurs who wondered what Reddit might be able to tell us about our society.

Social network data have revolutionized advertising, brand management, political campaigns, and more. They have also enabled and inspired vast new areas of research in the social and natural sciences.

Traditional social networks like Facebook focus on mostly-private interactions between personal acquaintances, family members, and friends. Broadcast-style social networks like Twitter enable users at “hubs” in the social graph (those with many followers) to disseminate their ideas widely and interact directly with their “followers”. Both traditional and broadcast networks result in explicit social networks as users choose to associate themselves with other users.

Reddit and similar services such as Hacker News are a bit different. On Reddit, users vote for, and comment on, content. The social network that evolves as a result is implied based on interactions rather than explicit.

Another important difference is that, on Reddit, communication between users largely revolves around external topics or issues such as world news, sports teams, or local events. Instead of discussing their own lives, or topics randomly selected by the community, Redditors discuss specific topics (as determined by community voting) in a structured manner.

This is what we’re trying to harness with Project Austral. By combining Reddit stories, comments, and users with technologies like sentiment analysis and topic identification (more to come soon!) we’re hoping to reveal interesting trends and patterns that would otherwise remain hidden.

Please, check it out and let us know what you think!

Bad assumption on my part! Since ₳ustral uses Neo4j to store the Reddit graph, I was expecting a graph-type visualization. If that was intended, that isn’t what I found. 😉

Most of my searching is content oriented and not so much concerned with trends or patterns. An upsurge in hypergraph queries could happen in Reddit, but aside from references to publications and projects, the upsurge itself would be a curiosity to me.

Nothing against trending, patterns, etc. but just not my use case. May be yours.

March 7, 2015

The ISIS Twitter Census

Filed under: Social Media,Social Networks,Twitter — Patrick Durusau @ 8:38 pm

The ISIS Twitter Census: Defining and describing the population of ISIS supporters on Twitter by J.M. Berger and Jonathon Morgan.

This is the Brookings Institute report that I said was forthcoming in: Losing Your Right To Decide, Needlessly.

From the Executive Summary:

The Islamic State, known as ISIS or ISIL, has exploited social media, most notoriously Twitter, to send its propaganda and messaging out to the world and to draw in people vulnerable to radicalization.

By virtue of its large number of supporters and highly organized tactics, ISIS has been able to exert an outsized impact on how the world perceives it, by disseminating images of graphic violence (including the beheading of Western journalists and aid workers and more recently, the immolation of a Jordanian air force pilot), while using social media to attract new recruits and inspire lone actor attacks.

Although much ink has been spilled on the topic of ISIS activity on Twitter, very basic questions remain unanswered, including such fundamental issues as how many Twitter users support ISIS, who they are, and how many of those supporters take part in its highly organized online activities.

Previous efforts to answer these questions have relied on very small segments of the overall ISIS social network. Because of the small, cellular nature of that network, the examination of particular subsets such as foreign fighters in relatively small numbers, may create misleading conclusions.

My suggestion is that you skim the “group think” sections on ISIS and move quickly to Section 3, Methodology. That will put you into a position to evaluate the various and sundry claims about ISIS and what may or may not be supported by their methodology.

I am still looking for a metric for “successful” use of social media. So far, no luck.

January 1, 2015

How Do Others See You Online?

Filed under: Social Media,Social Networks — Patrick Durusau @ 5:27 pm

The question isn’t “how do you see yourself online?” but “How to others see you online?”

Allowing for the vagaries of memory, selective unconscious editing, self-justification, etc., I quite confident that how others see us online isn’t the same thing as how we see ourselves.

The saying “know thyself” is often repeated and for practical purposes, is about as effective as a poke with a sharp stick. It hurts but there’s not much other benefit to be had.

Farhad Manjoo writes in ThinkUp Helps the Social Network User See the Online Self about the startup Thinkup.com, which offers an analytical service of your participation in social networks.

Unlike your “selective” memory, Thinkup gives you a report based on all your tweets, posts, etc., and breaks them down in ways you probably would not anticipate. The service creates enough distance between you and the report that you get a glimpse of yourself as others may be seeing you.

Beyond whatever value self-knowledge has for you, Thinkup, as Farhad learns from experience, can make you a more effective user of social media. You are already spending time on social media, why not spend it more effectively?

December 14, 2014

Inheritance Patterns in Citation Networks Reveal Scientific Memes

Filed under: Citation Analysis,Language,Linguistics,Meme,Social Networks — Patrick Durusau @ 8:37 pm

Inheritance Patterns in Citation Networks Reveal Scientific Memes by Tobias Kuhn, Matjaž Perc, and Dirk Helbing. (Phys. Rev. X 4, 041036 – Published 21 November 2014.)

Abstract:

Memes are the cultural equivalent of genes that spread across human culture by means of imitation. What makes a meme and what distinguishes it from other forms of information, however, is still poorly understood. Our analysis of memes in the scientific literature reveals that they are governed by a surprisingly simple relationship between frequency of occurrence and the degree to which they propagate along the citation graph. We propose a simple formalization of this pattern and validate it with data from close to 50 million publication records from the Web of Science, PubMed Central, and the American Physical Society. Evaluations relying on human annotators, citation network randomizations, and comparisons with several alternative approaches confirm that our formula is accurate and effective, without a dependence on linguistic or ontological knowledge and without the application of arbitrary thresholds or filters.

Popular Summary:

It is widely known that certain cultural entities—known as “memes”—in a sense behave and evolve like genes, replicating by means of human imitation. A new scientific concept, for example, spreads and mutates when other scientists start using and refining the concept and cite it in their publications. Unlike genes, however, little is known about the characteristic properties of memes and their specific effects, despite their central importance in science and human culture in general. We show that memes in the form of words and phrases in scientific publications can be characterized and identified by a simple mathematical regularity.

We define a scientific meme as a short unit of text that is replicated in citing publications (“graphene” and “self-organized criticality” are two examples). We employ nearly 50 million digital publication records from the American Physical Society, PubMed Central, and the Web of Science in our analysis. To identify and characterize scientific memes, we define a meme score that consists of a propagation score—quantifying the degree to which a meme aligns with the citation graph—multiplied by the frequency of occurrence of the word or phrase. Our method does not require arbitrary thresholds or filters and does not depend on any linguistic or ontological knowledge. We show that the results of the meme score are consistent with expert opinion and align well with the scientific concepts described on Wikipedia. The top-ranking memes, furthermore, have interesting bursty time dynamics, illustrating that memes are continuously developing, propagating, and, in a sense, fighting for the attention of scientists.

Our results open up future research directions for studying memes in a comprehensive fashion, which could lead to new insights in fields as disparate as cultural evolution, innovation, information diffusion, and social media.

You definitely should grab the PDF version of this article for printing and a slow read.

From Section III Discussion:


We show that the meme score can be calculated exactly and exhaustively without the introduction of arbitrary thresholds or filters and without relying on any kind of linguistic or ontological knowledge. The method is fast and reliable, and it can be applied to massive databases.

Fair enough but “black,” “inflation,” and, “traffic flow,” all appear in the top fifty memes in physics. I don’t know that I would consider any of them to be “memes.”

There is much left to be discovered about memes. Such as who is good at propagating memes? Would not hurt if your research paper is the origin of a very popular meme.

I first saw this in a tweet by Max Fisher.

December 9, 2014

Parable of the Polygons

Filed under: Politics,Simulations,Social Networks,Socioeconomic Data — Patrick Durusau @ 7:26 pm

Parable of the Polygons – A Playable Post on the Shape of Society by VI Hart and Nicky Case.

From the post:

This is a story of how harmless choices can make a harmful world.

A must play post!

Deeply impressive simulation of how segregation comes into being. Moreover, how small choices may not create the society you are trying to achieve.

Bear in mind that these simulations, despite being very instructive, are orders of magnitudes less complex than the social aspects of de jure segregation I grew up under as a child.

That complexity is one of the reasons the ham-handed social engineering projects of government, be they domestic or foreign rarely reach happy results. Some people profit, mostly the architects of such programs and the people they intended to help, well, decades later things haven’t changed all that much.

If you think you have the magic touch to engineer a group, locality, nation or the world, please try your hand at these simulations first. Bearing in mind that we have no working simulations of society that supports social engineering on the scale attempted by various nation states that come to mind.

Highly recommended!

PS: Creating alternatives to show the impacts of variations in data analysis would be quite instructive as well.

October 1, 2014

Uncovering Community Structures with Initialized Bayesian Nonnegative Matrix Factorization

Filed under: Bayesian Data Analysis,Matrix,Social Graphs,Social Networks,Subgraphs — Patrick Durusau @ 3:28 pm

Uncovering Community Structures with Initialized Bayesian Nonnegative Matrix Factorization by Xianchao Tang, Tao Xu, Xia Feng, and, Guoqing Yang.

Abstract:

Uncovering community structures is important for understanding networks. Currently, several nonnegative matrix factorization algorithms have been proposed for discovering community structure in complex networks. However, these algorithms exhibit some drawbacks, such as unstable results and inefficient running times. In view of the problems, a novel approach that utilizes an initialized Bayesian nonnegative matrix factorization model for determining community membership is proposed. First, based on singular value decomposition, we obtain simple initialized matrix factorizations from approximate decompositions of the complex network’s adjacency matrix. Then, within a few iterations, the final matrix factorizations are achieved by the Bayesian nonnegative matrix factorization method with the initialized matrix factorizations. Thus, the network’s community structure can be determined by judging the classification of nodes with a final matrix factor. Experimental results show that the proposed method is highly accurate and offers competitive performance to that of the state-of-the-art methods even though it is not designed for the purpose of modularity maximization.

Some titles grab you by the lapels and say, “READ ME!,” don’t they? 😉

I found the first paragraph a much friendlier summary of why you should read this paper (footnotes omitted):

Many complex systems in the real world have the form of networks whose edges are linked by nodes or vertices. Examples include social systems such as personal relationships, collaborative networks of scientists, and networks that model the spread of epidemics; ecosystems such as neuron networks, genetic regulatory networks, and protein-protein interactions; and technology systems such as telephone networks, the Internet and the World Wide Web [1]. In these networks, there are many sub-graphs, called communities or modules, which have a high density of internal links. In contrast, the links between these sub-graphs have a fairly lower density [2]. In community networks, sub-graphs have their own functions and social roles. Furthermore, a community can be thought of as a general description of the whole network to gain more facile visualization and a better understanding of the complex systems. In some cases, a community can reveal the real world network’s properties without releasing the group membership or compromising the members’ privacy. Therefore, community detection has become a fundamental and important research topic in complex networks.

If you think of “the real world network’s properties” as potential properties for identification of a network as a subject or as properties of the network as a subject, the importance of this article becomes clearer.

Being able to speak of sub-graphs as subjects with properties can only improve our ability to compare sub-graphs across complex networks.

BTW, all the data used in this article is available for downloading: http://dx.doi.org/10.6084/m9.figshare.1149965

I first saw this in a tweet by Brian Keegan.

June 21, 2014

Storing and visualizing LinkedIn…

Filed under: Intelligence,Neo4j,Social Networks,Visualization — Patrick Durusau @ 4:42 pm

Storing and visualizing LinkedIn with Neo4j and sigma.js by Bob Briody.

From the post:

In this post I am going to present a way to:

  • load a linkedin networkvia the linkedIn developer API into neo4j using python
  • serve the network from neo4j using node.js, express.js, and cypher
  • display the network in the browser using sigma.js

Great post but it means one (1) down and two hundred and five (205) more to go, if you are a member of the social networks listed on List of social networking websites at Wikipedia, and that excludes dating sites and includes only “notable, well-known sites.”

I would be willing to bet that your social network of friends, members of your religious organization, people where you work, etc. would start to swell the number of other social networks that number you as a member.

Hmmm, so one off social network visualizations are just that, one off social network visualizations. You can been seen as part of one group and not say two or three intersecting groups.

Moreover, an update to one visualized network isn’t going to percolate into another visualized network.

There is the “normalize your graph” solution to integrate such resources but what if you aren’t the one to realize the need for “normalization?”

You have two separate actors in your graph visualization after doing the best you can. Another person encounters information indicating these “two” people are in fact one person. They update their data. But that updated knowledge has no impact on your visualization, unless you simply happen across it.

Seems like a poor way to run intelligence gathering doesn’t it?

May 31, 2014

Conference on Weblogs and Social Media (Proceedings)

Filed under: Blogs,Social Media,Social Networks,Text Mining — Patrick Durusau @ 1:53 pm

Proceedings of the Eighth International Conference on Weblogs and Social Media

A great collection of fifty-eight papers and thirty-one posters on weblogs and social media.

Not directly applicable to topic maps but social media messages are as confused, ambiguous, etc., as any area could be. Perhaps more so but there isn’t a reliable measure for semantic confusion that I am aware of to compare different media.

These papers may give you some insight into social media and useful ways for processing its messages.

I first saw this in a tweet by Ben Hachey.

May 27, 2014

Nonlinear Dynamics and Chaos

Filed under: Chaos,Nonlinear Models,Science,Social Networks — Patrick Durusau @ 3:35 pm

Nonlinear Dynamics and Chaos – Steven Strogatz, Cornell University.

From the description:

This course of 25 lectures, filmed at Cornell University in Spring 2014, is intended for newcomers to nonlinear dynamics and chaos. It closely follows Prof. Strogatz’s book, “Nonlinear Dynamics and Chaos: With Applications to Physics, Biology, Chemistry, and Engineering.” The mathematical treatment is friendly and informal, but still careful. Analytical methods, concrete examples, and geometric intuition are stressed. The theory is developed systematically, starting with first-order differential equations and their bifurcations, followed by phase plane analysis, limit cycles and their bifurcations, and culminating with the Lorenz equations, chaos, iterated maps, period doubling, renormalization, fractals, and strange attractors. A unique feature of the course is its emphasis on applications. These include airplane wing vibrations, biological rhythms, insect outbreaks, chemical oscillators, chaotic waterwheels, and even a technique for using chaos to send secret messages. In each case, the scientific background is explained at an elementary level and closely integrated with the mathematical theory. The theoretical work is enlivened by frequent use of computer graphics, simulations, and videotaped demonstrations of nonlinear phenomena. The essential prerequisite is single-variable calculus, including curve sketching, Taylor series, and separable differential equations. In a few places, multivariable calculus (partial derivatives, Jacobian matrix, divergence theorem) and linear algebra (eigenvalues and eigenvectors) are used. Fourier analysis is not assumed, and is developed where needed. Introductory physics is used throughout. Other scientific prerequisites would depend on the applications considered, but in all cases, a first course should be adequate preparation.

Storgatz’s book “Nonlinear Dynamics and Chaos: With Applications to Physics, Biology, Chemistry, and Engineering,” is due out in a second edition in July of 2014. First edition was 2001.

Mastering the class and Stogatz’s book will enable you to call BS on projects with authority. Social groups are one example of chaotic systems. As a consequence, the near religious certainly of policy wonks on outcomes of particular policies is mis-guided.

Be cautious with those who response to social dynamics being chaotic by saying: “…yes, but …(here follows their method of controlling the chaotic system).” Chaotic systems by definition cannot be controlled nor can we account for all the influences and variables in such systems.

The best you can do is what seems to work, most of the time.

May 20, 2014

Community Detection in Graphs — a Casual Tour

Filed under: Graphs,Networks,Social Networks — Patrick Durusau @ 4:43 pm

Community Detection in Graphs — a Casual Tour by Jeremy Kun.

From the post:

Graphs are among the most interesting and useful objects in mathematics. Any situation or idea that can be described by objects with connections is a graph, and one of the most prominent examples of a real-world graph that one can come up with is a social network.

Recall, if you aren’t already familiar with this blog’s gentle introduction to graphs, that a graph G is defined by a set of vertices V, and a set of edges E, each of which connects two vertices. For this post the edges will be undirected, meaning connections between vertices are symmetric.

One of the most common topics to talk about for graphs is the notion of a community. But what does one actually mean by that word? It’s easy to give an informal definition: a subset of vertices C such that there are many more edges between vertices in C than from vertices in C to vertices in V - C (the complement of C). Try to make this notion precise, however, and you open a door to a world of difficult problems and open research questions. Indeed, nobody has yet come to a conclusive and useful definition of what it means to be a community. In this post we’ll see why this is such a hard problem, and we’ll see that it mostly has to do with the word “useful.” In future posts we plan to cover some techniques that have found widespread success in practice, but this post is intended to impress upon the reader how difficult the problem is.

Thinking that for some purposes, communities of nodes could well be a subject in a topic map. But we would have to be able to find them. And Jeremy says that’s a hard problem.

Looking forward to more posts on communities in graphs from Jeremy.

February 8, 2014

News Genius

Filed under: Annotation,Interface Research/Design,News,Social Networks — Patrick Durusau @ 3:52 pm

News Genius (about page)

From the webpage:

What is News Genius?

http://news.rapgenius.com/General-dwight-d-eisenhower-d-day-message-sent-just-prior-to-invasion-annotated

News Genius helps you make sense of the news by putting stories in context, breaking down subtext and bias, and crowdsourcing knowledge from around the world!

You can find speeches, interviews, articles, recipes, and even sports news, from yesterday and today, all annotated by the community and verified experts. With everything from Eisenhower speeches to reports on marijuana arrest horrors, you can learn about politics, current events, the world stage, and even meatballs!

Who writes the annotations?

Anyone can! Just create an account and start annotating. You can highlight any line to annotate it yourself, suggest changes to existing annotations, and even put up your favorite texts. Getting started is very easy. If you make good contributions, you’ll earn News IQ™, and if you share true knowledge, eventually you’ll be able to edit and annotate anything on the site.

How do I make verified annotations on my own work?

Verified users are experts in the news community. This includes journalists, like Spencer Ackerman, groups like the ACLU and Smart Chicago Collaborative, and even U.S. Geological Survey. Interested in getting you or your group verified? Sign up and request your verified account!

Sam Hunting forwarded this to my attention.

Interesting interface.

Assuming that you created associations between the text and annotator without bothering the author, this would work well for some aspects of a topic map interface.

I did run into the problem that who gets to be the “annotation” depends on who gets there first. If you pick text that has already been annotated, at most you can post a suggestion or vote it up or down.

BTW, this started as a music site so when you search for topics, there are a lot of rap, rock and poetry hits. Not so many news “hits.”

You can imagine my experience when I searched for “markup” and “semantics.”

I probably need to use more common words. 😉

I don’t know the history of the site but other than the not more than one annotation rule, you can certainly get started quickly creating and annotating content.

That is a real plus over many of the interfaces I have seen.

Comments?

PS: The only one annotation rule is all the more annoying when you find that very few Jimi Hendrix songs have any parts that are not annotated. 🙁

January 30, 2014

Visualize your Twitter followers…

Filed under: Social Networks,Tweets,Visualization — Patrick Durusau @ 9:08 pm

Visualize your Twitter followers in 3 fairly easy — and totally free — steps by Derrick Harris.

From the post:

Twitter is a great service, but it’s not exactly easy for users without programming skills to access their account data, much less do anything with it. Until now.

There already are services that will let you download reports about when you tweet and which of your tweets were the most popular, some — like SimplyMeasured and FollowerWonk — will even summarize data about your followers. If you’re willing to wait hours to days (Twitter’s API rate limits are just that — limiting) and play around with open source software, NodeXL will help you build your own social graph. (I started and gave up after realizing how long it would take if you have more than a handful of followers.) But you never really see the raw data, so you have to trust the services and you have to hope they present the information you want to see.

Then, last week, someone from ScraperWiki tweeted at me, noting that service can now gather raw data about users’ accounts. (I’ve used the service before to measure tweet activity.) I was intrigued. But I didn’t want to just see the data in a table, I wanted to do something more with it. Here’s what I did.

Another illustration that the technology expertise gap between users does not matter as much as the imagination gap between users.

The Google Fusion Table image is quite good.

January 20, 2014

Data with a Soul…

Filed under: Data,Social Networks,Social Sciences — Patrick Durusau @ 5:33 pm

Data with a Soul and a Few More Lessons I Have Learned About Data by Enrico Bertini.

From the post:

I don’t know if this is true for you but I certainly used to take data for granted. Data are data, who cares where they come from. Who cares how they are generated. Who cares what they really mean. I’ll take these bits of digital information and transform them into something else (a visualization) using my black magic and show it to the world.

I no longer see it this way. Not after attending a whole three days event called the Aid Data Convening; a conference organized by the Aid Data Consortium (ARC) to talk exclusively about data. Not just data in general but a single data set: the Aid Data, a curated database of more than a million records collecting information about foreign aid.

The database keeps track of financial disbursements made from donor countries (and international organizations) to recipient countries for development purposes: health and education, disasters and financial crises, climate change, etc. It spans a time range between 1945 up to these days and includes hundreds of countries and international organizations.

Aid Data users are political scientists, economists, social scientists of many sorts, all devoted to a single purpose: understand aid. Is aid effective? Is aid allocated efficiently? Does aid go where it is more needed? Is aid influenced by politics (the answer is of course yes)? Does aid have undesired consequences? Etc.

Isn’t that incredibly fascinating? Here is what I have learned during these few days I have spent talking with these nice people.
….

This fits quite well with the resources I mention in Lap Dancing with Big Data.

Making the Aid data your own data, will require time, effort and personal effort to understand and master it.

By that point, however, you may care about the data and the people it represents. Just be forewarned.

December 13, 2013

Immersion Reveals…

Filed under: Graphs,Networks,Social Networks — Patrick Durusau @ 4:24 pm

Immersion Reveals How People are Connected via Email by Andrew Vande Moere.

From the post:

Immersion [mit.edu] is a quite revealing visualization tool of which the NSA – or your own national security agency – can only be jealous of… Developed by MIT students Daniel Smilkov, Deepak Jagdish and César Hidalgo, Immersion generates a time-varying network visualization of all your email contacts, based on how you historically communicated with them.

Immersion is able to aggregate and analyze the “From”, “To”, “Cc” and “Timestamp” data of all the messages in any (authorized) Gmail, MS Exchange or Yahoo email account. It then filters out the ‘collaborators’ – people from whom one has received, and sent, at least 3 email messages from, and to.

Remember what I said about IT making people equal?

Access someone’s email account, which are often hacked, and you can have a good idea of their social network.

Or I assume you can run it across mailing list archives with a diluted result for any particular person.

December 1, 2013

Computational Social Science

Filed under: Graphs,Networks,Social Networks,Social Sciences — Patrick Durusau @ 9:26 pm

Georgia Tech CS 8803-CSS: Computational Social Science by Jacob Eisenstein

From the webpage:

The principle aim for this graduate seminar is to develop a broad understanding of the emerging cross-disciplinary field of Computational Social Science. This includes:

  • Methodological foundations in network and content analysis: understanding the mathematical basis for these methods, as well as their practical application to real data.
  • Best practices and limitations of observational studies.
  • Applications to political science, sociolinguistics, sociology, psychology, economics, and public health.

Consider this as an antidote to the “everything’s a graph, so let’s go” type approach.

Useful application of graph or network analysis requires a bit more than enthusiasm for graphs.

Just scanning the syllabus, devoting serious time to the readings will give you a good start on the skills required to be useful with network analysis.

I first saw this in a tweet by Jacob Eisenstein.

September 26, 2013

Time-varying social networks in a graph database…

Filed under: AutoComplete,Graphs,Neo4j,Networks,Social Networks,Time — Patrick Durusau @ 4:02 pm

Time-varying social networks in a graph database: a Neo4j use case by Ciro Cattuto, Marco Quaggiotto, André Panisson, and Alex Averbuch.

Abstract:

Representing and efficiently querying time-varying social network data is a central challenge that needs to be addressed in order to support a variety of emerging applications that leverage high-resolution records of human activities and interactions from mobile devices and wearable sensors. In order to support the needs of specific applications, as well as general tasks related to data curation, cleaning, linking, post-processing, and data analysis, data models and data stores are needed that afford efficient and scalable querying of the data. In particular, it is important to design solutions that allow rich queries that simultaneously involve the topology of the social network, temporal information on the presence and interactions of individual nodes, and node metadata. Here we introduce a data model for time-varying social network data that can be represented as a property graph in the Neo4j graph database. We use time-varying social network data collected by using wearable sensors and study the performance of real-world queries, pointing to strengths, weaknesses and challenges of the proposed approach.

A good start on modeling networks that vary based on time.

If the overhead sounds daunting, remember the graph data used here measured the proximity of actors every 20 seconds for three days.

Imagine if you added social connections between those actors, attended the same schools/conferences, co-authored papers, etc.

We are slowly loosing our reliance on simplification of data and models to make them computationally tractable.

Older Posts »

Powered by WordPress