Another Word For It Patrick Durusau on Topic Maps and Semantic Diversity

November 21, 2018

Going Old School to Solve A Google Search Problem

Filed under: Bookmarking,Bookmarks,Javascript,Searching — Patrick Durusau @ 5:27 pm

Going Old School to Solve A Google Search Problem

I was completely gulled by the headline. I thought the “old school” solution was going to be:

Go ask a librarian.

My bad. Turns out the answer was:

Recently I got an email from my friend John Simpson. He was having a search problem and thought I might be able to help him out. I was, and wanted to share with you what I did, because a) you might be able to use it too and b) it’s not often in my Internet experience that you end up solving a problem using a method that was popular over ten years ago.

Here’s John’s problem: he does regular Google searches of a particular kind, but finds that with most of these searches he gets an overwhelming number of results from just a couple of sites. He wants to consistently exclude those sites from his search results, but he doesn’t want to have to type in the exclusions every time.

The rock-simple solution to this problem would be: do the Google search excluding all the sites you don’t want to see, bookmark the result, and then revisit that bookmark whenever you’re ready to search. But a more elegant solution would be to use an bookmark enhanced with JavaScript: a bookmarklet.

The rest of the post walks you through the creation of a simple bookmarketlet. Easier than the name promises.

When (not if) Google fails you, remember you can either visit (or call in many cases) the reference desk at your local library.

Under the title: Why You Should Fall To Your Knees And Worship A Librarian, I encountered this item:

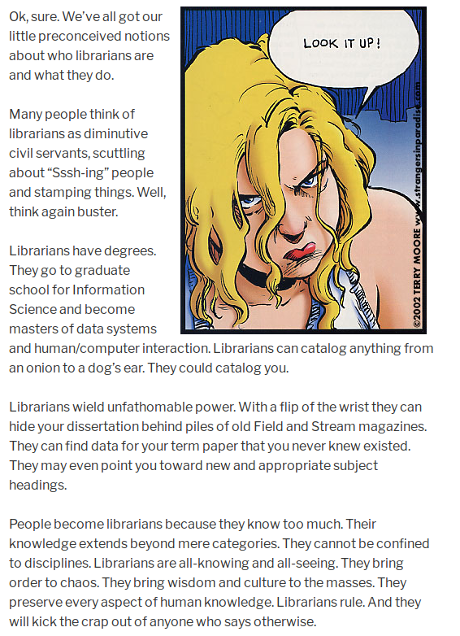
I’ve always had a weakness for the line:

People become librarians because they know too much.

Google can quickly point you down any number of blind alleys. Librarians quickly provide you with productive avenues to pursue. Your call.

October 7, 2017

Building Data Science with JS – Lifting the Curtain on Game Reviews

Filed under: Data Science,Javascript,Natural Language Processing,Programming,Stanford NLP — Patrick Durusau @ 4:52 pm

Building Data Science with JS by Tim Ermilov.

Three videos thus far:

Building Data Science with JS – Part 1 – Introduction

Building Data Science with JS – Part 2 – Microservices

Building Data Science with JS – Part 3 – RabbitMQ and OpenCritic microservice

Tim starts with the observation that the percentage of users assigning a score to a game isn’t very helpful. It tells you nothing about the content of the game and/or the person rating it.

In subject identity terms, each level, mighty, strong, weak, fair, collapses information about the game and a particular reviewer into a single summary subject. OpenCritic then displays the percent of reviewers who are represented by that summary subject.

The problem with the summary subject is that one critic may have down rated the game for poor content, another for sexism and still another for bad graphics. But a user only knows for reasons unknown, a critic whose past behavior is unknown, evaluated unknown content and assigned it a rating.

A user could read all the reviews, study the history of each reviewer, along with the other movies they have evaluated, but Ermilov proposes a more efficient means to peak behind the curtain of game ratings. (part 1)

In part 2, Ermilov designs a microservice based application to extract, process and display game reviews.

If you thought the first two parts were slow, you should enjoy Part 3. 😉 Ermilov speeds through a number of resources, documents, JS libraries, not to mention his source code for the project. You are likely to hit pause during this video.

Some links you will find helpful for Part 3:

AMQP 0-9-1 library and client for Node.JS – Channel-oriented API reference

AMQP 0-9-1 library and client for Node.JS (Github)

https://github.com/BuildingXwithJS

https://github.com/BuildingXwithJS/building-data-science-with-js

Microwork – simple creation of distributed scalable microservices in node.js with RabbitMQ (simplifies use of AMQP)

node-unfluff – Automatically extract body content (and other cool stuff) from an html document

OpenCritic

RabbitMQ. (Recommends looking at the RabbitMQ tutorials.)

August 23, 2016

Eloquent JavaScript

Filed under: Javascript,Programming — Patrick Durusau @ 7:03 pm

Eloquent JavaScript by by Marijn Haverbeke.

From the webpage:

This is a book about JavaScript, programming, and the wonders of the digital. You can read it online here, or get your own paperback copy of the book.

javascript-cover

Embarrassing that authors post free content for the betterment of others, but wealthy governments play access games.

This book is also available in Български (Bulgarian), Português (Portuguese), and Русский (Russian).

Enjoy!

August 22, 2016

Regexer [JavaScript Regexes – Railroad Diagrams]

Filed under: Javascript,Regexes — Patrick Durusau @ 4:43 pm

Regexer

From the documentation page:

The images generated by Regexper are commonly referred to as “Railroad Diagrams”. These diagram are a straight-forward way to illustrate what can sometimes become very complicated processing in a regular expression, with nested looping and optional elements. The easiest way to read these diagrams to to start at the left and follow the lines to the right. If you encounter a branch, then there is the option of following one of multiple paths (and those paths can loop back to earlier parts of the diagram). In order for a string to successfully match the regular expression in a diagram, you must be able to fulfill each part of the diagram as you move from left to right and proceed through the entire diagram to the end.

As an example, this expression will match “Lions and tigers and bears. Oh my!” or the more grammatically correct “Lions, tigers, and bears. Oh my!” (with or without an Oxford comma). The diagram first matches the string “Lions”; you cannot proceed without that in your input. Then there is a choice between a comma or the string ” and”. No matter what choice you make, the input string must then contain ” tigers” followed by an optional comma (your path can either go through the comma or around it). Finally the string must end with ” and bears. Oh my!”.

js-regex-example-460

JavaScript-style regular expression input and railroad diagram output.

Can you think of a better visualization for teaching regexes? (Or analysis when they get hairy.)

August 14, 2016

noms (decentralized database)

Filed under: Javascript,noms — Patrick Durusau @ 4:39 pm

noms

From the webpage:

Noms is a decentralized database based on ideas from Git.

This repository contains two reference implementations of the database—one in Go, and one in JavaScript. It also includes a number of tools and sample applications.

Noms is different from other databases. It is:

  • Content-addressed. If you have some data you want to put into Noms, you don’t have to worry about whether it already exists. Duplicate data is automatically ignored. There is no update, only insert.
  • Append-only. When you commit data to Noms, you aren’t overwriting anything. Instead you’re adding to a historical record. By default, data is never removed from Noms. You can see the entire history of the database, diff any two commits, or rewind to any previous point in time.
  • Strongly-typed. Noms doesn’t have schemas that you design up front. Instead, each version of a Noms database has a type, which is generated automatically as you add data. You can write code against the type of a Noms database, confident that you’ve handled all the cases you need to.
  • Decentralized. If I give you a copy of my database, you and I can modify our copies disconnected from each other, and come back together and merge our changes efficiently and correctly days, weeks, or years later.

Noms is supported on Mac OS X and Linux. Windows usually works, but isn’t officially supported.

I’m taking a chance and adding a category for noms at this point.

I need to install Go 1.6+ at this point.

Not close to prime time but content-addressing and append-only are enough to prompt further investigation.

February 15, 2016

networkD3: D3 JavaScript Network Graphs from R

Filed under: D3,Graphs,Javascript,Networks,R — Patrick Durusau @ 5:41 pm

networkD3: D3 JavaScript Network Graphs from R by Christopher Gandrud, JJ Allaire, & Kent Russell.

From the post:

This is a port of Christopher Gandrud’s R package d3Network for creating D3 network graphs to the htmlwidgets framework. The htmlwidgets framework greatly simplifies the package’s syntax for exporting the graphs, improves integration with RStudio’s Viewer Pane, RMarkdown, and Shiny web apps. See below for examples.

It currently supports three types of network graphs:

I haven’t compared this to GraphViz but the Sankey diagram option is impressive!

September 18, 2015

Introduction to d3.js [including maps!]

Filed under: D3,Javascript — Patrick Durusau @ 9:17 am

Introduction to d3.js with Mike Taptich.

From part one of a two-part introduction to d3.js:

Don’t know Javascript? No problem.

This two-part introduction to d3.js is intended for beginners, even those with limited exposure to JavaScript — the language used by web browsers. Regardless of your background, I put together a few examples to get everyone (re)oriented to coding in the browser.

Sounds like your typical introduction to …. type tutorial until you reach:

My Coding Philosophy

Now, I am a firm believer in coding with a purpose. When you are first starting off learning JavaScript, you may want to learn everything there is to learn about the language (broad). I suggest that you instead only pick up the pieces of code you need in order to complete some bigger project (narrow). To give you a glimpse of what you could do in d3, check out Mike Bostock’s github repo here or Christopher Viau’s well-curated repository here.

You don’t know at that point but Part 2 is going to focus on maps and displaying data on maps! Some simple examples and some not quite so simple.

D3.js will do a lot of things but you can get a tangible result for many use cases by mapping data to maps.

Some random examples:

  • Where in your city have the police shot civilians?
  • Are there any neighborhoods where no one has been shot by the police?
  • Restaurants by ethnic cuisine.
  • Pothole incidence rates.
  • Frequency of police patrols.

This rocks!

I first saw this in a tweet by Christophe Viau.

May 26, 2015

JavaScript Graph Comparison

Filed under: Javascript,Visualization — Patrick Durusau @ 3:05 pm

JavaScript Graph Comparison

Bookmark this site if you need to select one of the many JavaScript graph libraries by features. Select by graph type, pricing scheme, options and dependencies.

The thought does occur to me that a daily chart of deaths by cause and expenditures by the U.S. government on that cause could make an interesting graphic. Particularly on the many days that there are no deaths from terrorism but the money keeps on pouring out.

April 1, 2015

Full-Text Search in Javascript (Part 1: Relevance Scoring)

Filed under: Javascript,Lucene,Search Engines,Searching — Patrick Durusau @ 7:47 pm

Full-Text Search in Javascript (Part 1: Relevance Scoring) by Barak Kanber.

From the post:

Full-text search, unlike most of the topics in this machine learning series, is a problem that most web developers have encountered at some point in their daily work. A client asks you to put a search field somewhere, and you write some SQL along the lines of WHERE title LIKE %:query%. It’s convincing at first, but then a few days later the client calls you and claims that “search is broken!”

Of course, your search isn’t broken, it’s just not doing what the client wants. Regular web users don’t really understand the concept of exact matches, so your search quality ends up being poor. You decide you need to use full-text search. With some MySQL fidgeting you’re able to set up a FULLTEXT index and use a more evolved syntax, the “MATCH() … AGAINST()” query.

Great! Problem solved. For smallish databases.

As you hit the hundreds of thousands of records, you notice that your database is sluggish. MySQL just isn’t great at full-text search. So you grab ElasticSearch, refactor your code a bit, and deploy a Lucene-driven full-text search cluster that works wonders. It’s fast and the quality of results is great.

Which leads you to ask: what the heck is Lucene doing so right?

This article (on TF-IDF, Okapi BM-25, and relevance scoring in general) and the next one (on inverted indices) describe the basic concepts behind full-text search.

Illustration of search engine concepts in Javascript with code for download. You can tinker to your heart’s delight.

Enjoy!

PS: Part 2 is promised in the next “several” weeks. Will be watching for it.

February 26, 2015

Data Visualization with JavaScript

Filed under: Javascript,Visualization — Patrick Durusau @ 7:49 pm

Data Visualization with JavaScript by Stephen A. Thomas.

From the webpage:

It’s getting hard to ignore the importance of data in our lives. Data is critical to the largest social organizations in human history. It can affect even the least consequential of our everyday decisions. And its collection has widespread geopolitical implications. Yet it also seems to be getting easier to ignore the data itself. One estimate suggests that 99.5% of the data our systems collect goes to waste. No one ever analyzes it effectively.

Data visualization is a tool that addresses this gap.

Effective visualizations clarify; they transform collections of abstract artifacts (otherwise known as numbers) into shapes and forms that viewers quickly grasp and understand. The best visualizations, in fact, impart this understanding intuitively. Viewers comprehend the data immediately—without thinking. Such presentations free the viewer to more fully consider the implications of the data: the stories it tells, the insights it reveals, or even the warnings it offers. That, of course, defines the best kind of communication.

If you’re developing web sites or web applications today, there’s a good chance you have data to communicate, and that data may be begging for a good visualization. But how do you know what kind of visualization is appropriate? And, even more importantly, how do you actually create one? Answers to those very questions are the core of this book. In the chapters that follow, we explore dozens of different visualizations, techniques, and tool kits. Each example discusses the appropriateness of the visualization (and suggests possible alternatives) and provides step-by-step instructions for including the visualization in your own web pages.

With a publication date of March 2015 its hard to get any more current information on data visualization and JavaScript!

You can view the text online or buy a proper ebook/hard copy.

Enjoy!

February 24, 2015

MILJS : Brand New JavaScript Libraries for Matrix Calculation and Machine Learning

Filed under: Javascript,Machine Learning,Visualization — Patrick Durusau @ 4:16 pm

MILJS : Brand New JavaScript Libraries for Matrix Calculation and Machine Learning by Ken Miura, et al.

Abstract:

MILJS is a collection of state-of-the-art, platform-independent, scalable, fast JavaScript libraries for matrix calculation and machine learning. Our core library offering a matrix calculation is called Sushi, which exhibits far better performance than any other leading machine learning libraries written in JavaScript. Especially, our matrix multiplication is 177 times faster than the fastest JavaScript benchmark. Based on Sushi, a machine learning library called Tempura is provided, which supports various algorithms widely used in machine learning research. We also provide Soba as a visualization library. The implementations of our libraries are clearly written, properly documented and thus can are easy to get started with, as long as there is a web browser. These libraries are available from this http URL under the MIT license.

Where “this http URL” = http://mil-tokyo.github.io/. It’s a hyperlink with that text in the original so I didn’t want to change the surface text.

The paper is a brief introduction to the JavaScript Libraries and ends with several short demos.

On this one, yes, run and get the code: http://mil-tokyo.github.io/.

Happy coding!

November 20, 2014

Cytoscape.js != Cytoscape (desktop)

Filed under: Graphs,Javascript,Visualization — Patrick Durusau @ 11:29 am

Cytoscape.js

From the webpage:

Cytoscape.js is an open-source Cytoscape.jsgraph theory (a.k.a. network) library written in JavaScript. You can use Cytoscape.js for graph analysis and visualisation.

Cytoscape.js allows you to easily display and manipulate rich, interactive graphs. Because Cytoscape.js allows the user to interact with the graph and the library allows the client to hook into user events, Cytoscape.js is easily integrated into your app, especially since Cytoscape.js supports both desktop browsers, like Chrome, and mobile browsers, like on the iPad. Cytoscape.js includes all the gestures you would expect out-of-the-box, including pinch-to-zoom, box selection, panning, et cetera.

Cytoscape.js also has graph analysis in mind: The library contains many useful functions in graph theory. You can use Cytoscape.js headlessly on Node.js to do graph analysis in the terminal or on a web server.

Cytoscape.js is an open-source project, and anyone is free to contribute. For more information, refer to the Cytoscape.jsGitHub README.

The library was developed at the Cytoscape.jsDonnelly Centre at the University of Toronto. It is the successor of Cytoscape.jsCytoscape Web.

Cytoscape.js & Cytoscape

Though Cytoscape.js shares its name with Cytoscape, Cytoscape.js is not exactly the same as Cytoscape desktop. Cytoscape.js is a JavaScript library for programmers. It is not an app for end-users, and developers need to write code around Cytoscape.js to build graphcentric apps.

Cytoscape.js is a JavaScript library: It gives you a reusable graph widget that you can integrate with the rest of your app with your own JavaScript code. The keen members of the audience will point out that this means that Cytoscape plugins/apps — written in Java — will obviously not work in Cytoscape.js — written in JavaScript. However, Cytoscape.js supports its own ecosystem of extensions.

We are trying to make the two projects intercompatible as possible, and we do share philosophies with Cytoscape: Graph style and data should be separate, the library should provide core functionality with extensions adding functionality on top of the library, and so on.

Great demo graphs!

High marks on the documentation and its TOC. Generous use of examples.

One minor niggle on the documentation:

Note that metacharacters need to be escaped:

cy.filter('#some\\$funky\\@id');

I think the full set of metacharacters for JavaScript reads:

^ $ \ / ( ) | ? + * [ ] { } , .

Given that metacharacters vary between regex languages (unfortunately), it would be clearer to list the full set of JavaScript metacharacters and use only a few in the examples.

Thus:

Note that metacharacters ( ^ $ \ / ( ) | ? + * [ ] { } , . )need to be escaped:

cy.filter('#some\\$funky\\@id');

Overall a graph theory library that deserves your attention.

I first saw this in a tweet by Friedrich Lindenberg.


Update: I submitted a ticket on the metacharacters this morning and it was fixed shortly thereafter. Hard problems will likely take longer but definitely a responsive project!

November 8, 2014

Transducers – java, js, python, ruby

Filed under: Clojure,Functional Programming,Java,Javascript,Python,Ruby — Patrick Durusau @ 10:59 am

Transducers – java, js, python, ruby

Struggling with transducers?

Learn better by example?

Cognitect Labs has released transducers for Java, JavaScript, Ruby, and Python.

Clojure recently added support for transducers – composable algorithmic transformations. These projects bring the benefits of transducers to other languages:

BTW, take a look at Rich Hickey’s latest (as of Nov. 2014) video on Transducers.

Please forward to language specific forums.

October 25, 2014

Data Visualization with JavaScript

Filed under: Javascript,Visualization — Patrick Durusau @ 6:08 pm

Data Visualization with JavaScript by Stephen A. Thomas.

From the introduction:

It’s getting hard to ignore the importance of data in our lives. Data is critical to the largest social organizations in human history. It can affect even the least consequential of our everyday decisions. And its collection has widespread geopolitical implications. Yet it also seems to be getting easier to ignore the data itself. One estimate suggests that 99.5% of the data our systems collect goes to waste. No one ever analyzes it effectively.

Data visualization is a tool that addresses this gap.

Effective visualizations clarify; they transform collections of abstract artifacts (otherwise known as numbers) into shapes and forms that viewers quickly grasp and understand. The best visualizations, in fact, impart this understanding subconsciously. Viewers comprehend the data immediately—without thinking. Such presentations free the viewer to more fully consider the implications of the data: the stories it tells, the insights it reveals, or even the warnings it offers. That, of course, defines the best kind of communication.

If you’re developing web sites or web applications today, there’s a good chance you have data to communicate, and that data may be begging for a good visualization. But how do you know what kind of visualization is appropriate? And, even more importantly, how do you actually create one? Answers to those very questions are the core of this book. In the chapters that follow, we explore dozens of different visualizations and visualization techniques and tool kits. Each example discusses the appropriateness of the visualization (and suggests possible alternatives) and provides step-by-step instructions for including the visualization in your own web pages.

To give you a better idea of what to expect from the book, here’s a quick description of what the book is, and what it is not.

The book is a sub-part of http://jsdatav.is/ where Stephen maintains his blog, listing of talks and a link to his twitter account.

If you are interested in data visualization with JavaScript, this should be on a short list of bookmarks.

September 16, 2014

KaTeX

Filed under: Javascript,TeX/LaTeX — Patrick Durusau @ 5:14 am

KaTeX

From the webpage:

  • Fast: KaTeX renders its math synchronously and doesn’t need to reflow the page.
  • Print quality: KaTeX’s layout is based on Donald Knuth’s TeX, the gold standard for math typesetting.
  • Self contained: KaTeX has no dependencies and can easily be bundled with your website resources.
  • Server side rendering: KaTeX produces the same output regardless of browser or environment, so you can pre-render expressions using Node.js and send them as plain HTML.

Is it just a matter of time before someone implements TeX in JS and we have a typographic solution for the Web?

I first saw this in a tweet by John Resig.

August 7, 2014

Mapbox GL For The Web

Filed under: Graphics,Javascript,MapBox,Visualization — Patrick Durusau @ 4:37 pm

Mapbox GL For The Web: An open source JavaScript framework for client-side vector maps by Eric Gundersen.

From the post:

Announcing Mapbox GL JS — a fast and powerful new system for web maps. Mapbox GL JS is a client-side renderer, so it uses JavaScript and WebGL to dynamically draw data with the speed and smoothness of a video game. Instead of fixing styles and zoom levels at the server level, Mapbox GL puts power in JavaScript, allowing for dynamic styling and freeform interactivity. Vector maps are the next evolution, and we’re excited to see what developers build with this framework. Get started now.

This rocks!

I not going to try to reproduce the examples here so see the original post!

What high performance maps are you going to create?

June 30, 2014

12 JavaScript Libraries for Data Visualization

Filed under: Javascript,Visualization — Patrick Durusau @ 7:02 pm

12 JavaScript Libraries for Data Visualization by Thomas Greco.

Thomas gives quick summaries and links for:

  • Dygraphs.js
  • D3.js
  • InfoVis
  • The Google Visualization API
  • Springy.js
  • Polymaps.js
  • Dimple
  • Sigma.js
  • Raphael.js
  • gRaphëaut;l
  • Leaflet
  • Ember Charts

Do you see any old friends? See any you don’t yet know?

Enjoy!

March 26, 2014

Deep Belief in Javascript

Filed under: Image Recognition,Image Understanding,Javascript,Neural Networks,WebGL — Patrick Durusau @ 1:34 pm

Deep Belief in Javascript

From the webpage:

It’s an implementation of the Krizhevsky convolutional neural network architecture for object recognition in images, running entirely in the browser using Javascript and WebGL!

I built it so people can easily experiment with a classic deep belief approach to image recognition themselves, to understand both its limitations and its power, and to demonstrate that the algorithms are usable even in very restricted client-side environments like web browsers.

A very impressive demonstration of the power of Javascript to say nothing of neural networks.

You can submit your own images for “recognition.”

I first saw this in Nat Torkington’s Four short links: 24 March 2014.

December 28, 2013

Intel® XDK

Filed under: Interface Research/Design,Javascript — Patrick Durusau @ 12:00 pm

Intel® XDK

From the webpage:

Intel® XDK, a no cost, integrated and front-to-back HTML5 app development environment for true cross-platform apps for multiple app stores, and form factor devices. Features in the first release included:

  • Editor, Device Emulator and Debugger
  • App for On-device Testing
  • Javascript UI library optimized for mobile
  • APIs for game developers with accelerated canvas
  • Prototype GUI quick-start wizard
  • Installs on Microsoft Windows*, Apple OS X*, runs in Google Chrome*
  • Intel cloud-based build system for most app stores
  • No need to download Native Platform SDKs
  • Tool to convert iOS* apps to HTML5

Numerous other resources, including forums, are available from this page.

If you want to deliver topic map based content to mobile devices, this is a must stop.

I first saw this in Nat Torkington’s Four short links: 27 December 2013.

December 17, 2013

Functional data structures in JavaScript with Mori

Filed under: Functional Programming,Javascript — Patrick Durusau @ 1:47 pm

Functional data structures in JavaScript with Mori by Jesse Hallett.

From the post:

I have a long-standing desire for a JavaScript library that provides good implementations of functional data structures. Recently I found Mori, and I think that it may be just the library that I have been looking for. Mori packages data structures from the Clojure standard library for use in JavaScript code.

Functional Data Structures

A functional data structure (also called a persistent data structure) has two important qualities: it is immutable and it can be updated by creating a copy with modifications (copy-on-write). Creating copies should be nearly as cheap as modifying a comparable mutable data structure in place. This is achieved with structural sharing: pointers to unchanged portions of a structure are shared between copies so that memory need only be allocated for changed portions of the data structure.

A simple example is a linked list. A linked list is an object, specifically a list node, with a value and a pointer to the next list node, which points to the next list node. (Eventually you get to the end of the list where there is a node that points to the empty list.) Prepending an element to the front of such a list is a constant-time operation: you just create a new list element with a pointer to the start of the existing list. When lists are immutable there is no need to actually copy the original list. Removing an element from the front of a list is also a constant-time operation: you just return a pointer to the second element of the list….

Just in case you want to start practicing your functional programming in JavaScript.

I first saw this in Christophe Lalanne’s Bag of Tweets for November 2013.

November 23, 2013

Frameless

Filed under: Interface Research/Design,Javascript,SVG,XPath,XSLT — Patrick Durusau @ 2:39 pm

Frameless

From the webpage:

Frameless is an XSLT 2 processor running in the browser, directly written in JavaScript. It includes an XPath 2 query engine for simple, powerful querying. It works cross-browser, we have even reached compatibility with IE6 and Firefox 1.

With Frameless you’ll be able to do things the browsers won’t let you, such as using $variables and adding custom functions to XPath. What’s more, XPath 2 introduces if/else and for-loops. We’ll even let you use some XPath 3 functionality! Combine data into a string using the brand new string concatenation operator.

Use way overdue math functions such as sin() and cos(), essential when generating data-powered SVG graphics. And use Frameless.select() to overcome the boundaries between XSLT and JavaScript.

When to use Frameless?

Frameless is created to simplify application development and is, due to its API, great for writing readable code.

It will make application development a lot easier and it’s a good fit for all CRUD applications and applications with tricky DOM manipulation.

Who will benefit by using it?

  • Designers and managers will be able to read the code and even fix some bugs.
  • Junior developers will get up to speed in no time and write code with a high level of abstraction, and they will be able to create prototypes that’ll be shippable.
  • Senior developers will be able to create complicated webapplications for all browsers and write them declaratively

What it’s not

Frameless doesn’t intend to fully replace functional DOM manipulation libraries like jQuery. If you like you can use such libraries and Frameless at the same time.

Frameless doesn’t provide a solution for cross-browser differences in external CSS stylesheets. We add prefixes to some inline style attributes, but you should not write your styles inline only for this purpose. We do not intend to replace any CSS extension language, such as for example Sass.

Frameless is very sparse on documentation but clearly the potential for browser-based applications is growing.

I first saw this in a tweet by Michael Kay.

November 9, 2013

Full-Text Indexing PDFs in Javascript

Filed under: Indexing,Javascript,PDF — Patrick Durusau @ 8:35 pm

Full-Text Indexing PDFs in Javascript by Gary Sieling.

From the post:

Mozilla Labs received a lot of attention lately for a project impressive in it’s ambitions: rendering PDFs in a browser using only Javascript. The PDF spec is incredibly complex, so best of luck to the pdf.js team! On a different vein, Oliver Nightingale is implementing a Javascript full-text indexer in the Javascript – combining these two projects allows reproducing the PDF processing pipeline entirely in web browsers.

As a refresher, full text indexing lets a user search unstructured text, ranking resulting documents by a relevance score determined by word frequencies. The indexer counts how often each word occurs per document and makes minor modifications the text, removing grammatical features which are irrelevant to search. E.g. it might subtract “-ing” and change vowels to phonetic common denominators. If a word shows up frequently across the document set it is automatically considered less important, and it’s effect on resulting ranking is minimized. This differs from the basic concept behind Google PageRank, which boosts the rank of documents based on a citation graph.

Most database software provides full-text indexing support, but large scale installations are typically handled in more powerful tools. The predominant open-source product is Solr/Lucene, Solr being a web-app wrapper around the Lucene library. Both are written in Java.

Building a Javascript full-text indexer enables search in places that were previously difficult such as Phonegap apps, end-user machines, or on user data that will be stored encrypted. There is a whole field of research to encrypted search indices, but indexing and encrypting data on a client machine seems like a good way around this naturally challenging problem. (Emphasis added.)

The need for a full-text indexer without using one of the major indexing packages had not occurred to me.

Access to the user’s machine might be limited by time, for example. You would not want to waste cycles spinning up a major indexer when you don’t know the installed software.

Something to add to your USB stick. 😉

November 7, 2013

dagre – Graph layout for JavaScript

Filed under: D3,Graphs,Graphviz,Javascript,Visualization — Patrick Durusau @ 10:39 am

dagre – Graph layout for JavaScript by Chris Pettitt.

From the webpage:

Dagre is a JavaScript library that makes it easy to lay out directed graphs on the client-side.

Key priorities for this library are:

  1. Completely client-side computed layout. There are great, feature-rich alternatives, like graphviz, if client-side layout is not a requirement for you.

  2. Speed. Dagre must be able to draw medium sized graphs quickly, potentially at the cost of not being able to adopt more optimal or exact algorithms.

  3. Rendering agnostic. Dagre requires only very basic information to lay out graphs, such as the dimensions of nodes. You’re free to render the graph using whatever technology you prefer. We use D3 in some of our examples and highly recommend it if you plan to render using CSS and SVG.

Note that dagre is current a pre-1.0.0 library. We will do our best to maintain backwards compatibility for patch level increases (e.g. 0.0.1 to 0.0.2) but make no claim to backwards compatibility across minor releases (e.g. 0.0.1 to 0.1.0). Watch our CHANGELOG for details on changes.

You are delivering content to the client side, yes?

I don’t have a feel for what “medium sized graphs” are the target so would appreciate comments on your experiences with this library.

One of the better readmes I have seen on GitHub.

I first saw this in a tweet by Chris Diehl.

Learning 30 Technologies in 30 Days…

Filed under: Design,Javascript,OpenShift,Programming — Patrick Durusau @ 9:32 am

Learning 30 Technologies in 30 Days: A Developer Challenge by Shekhar Gulati.

From the post:

I have taken a challenge wherein I will learn a new technology every day for a month. The challenge started on October 29, 2013. Below is the list of technologies I’ve started learnign and blogging about. After my usual work day, I will spend a couple of hours learning a new technology and one hour writing about it. The goal of this activity is to get familiar with many of the new technologies being used in the developer community. My main focus is on JavaScript and related technologies. I’ll also explore other technologies that interest me like Java, for example. I may spend multiple days on the same technology, but I will pick a new topic each time within that technology. Wherever it makes sense, I will try to show how it can work with OpenShift. I am expecting it to be fun and a great learning experience.

The homepage of the challenge that currently points to:

  1. October 29, 2013 – Day 1: Bower—Manage Your Client Side Dependencies. The first day talks about Bower and how you can use it.

  2. October 30, 2013 – Day 2: AngularJS—Getting My Head Around AngularJS. This blog talks about how you can get started with AngularJS. It is a very basic blog and talks about how to build a simple bookshop application.

  3. October 31, 2013 – Day 3: Flask—Instant Python Web Development with Python and OpenShift. This blog introduces Flask–a micro framework for doing web development in Python. It also reviews “Instant Flask Web Development” book and port the sample application to OpenShift.

  4. November 1, 2013 – Day 4: PredictionIO—How to A Build Blog Recommender. This blog talks about how you can use PredictionIO to build a blog recommender.

  5. November 2, 2013 — Day 5: GruntJS—Let Someone Else Do My Tedious Repetitive Tasks. This blog talks about how we can let GruntJS perform tedious tasks on our behalf. It also covers how we can use grunt-markdown plugin to convert Markdown to HTML5.

  6. November 3, 2013 — Day 6: Grails–Rapid JVM Web Development with Grails And OpenShift. This blog talks about how we can use Grails to build web application. Then we will deploy the application to OpenShift.

  7. November 4, 2013 – Day 7: GruntJS LiveReload–Take Productivity To Another Level. This blog talks about how we can use GruntJS watch plugin and live reload functionality to achieve extreme productivity.

  8. November 5, 2013 – Day 8: Harp–The Modern Static Web Server. This blog post will discuss the Harp web server and how to install and use it

  9. November 6, 2103 – Day 9: TextBlob–Finding Sentiments in Text

I encountered the challenge via the Day 4: PredictionIO—How to A Build Blog Recommender post.

The more technologies you know the broader your options for creation and delivery of topic map content to users.

August 17, 2013

Creating a Solr <search> HTML element…

Filed under: Interface Research/Design,Javascript,Solr — Patrick Durusau @ 4:07 pm

Creating a Solr <search> HTML element with AngularJS! by John Berryman.

From the post:

Of late we’ve been playing around with EmberJS for putting together slick client-side apps. But one thing that bothers me is how heavy-weight it feels. Another thing that concerns me is that AngularJS is really getting a lot of good attention and I want to make sure I’m not missing the boat! Here, look, just check out the emberjs/angularjs Google Trends plot: – See more at: http://www.opensourceconnections.com/2013/08/11/creating-a-search-html-element-with-angularjs/#sthash.ZH22mU0h.dpuf

It’s great to have a rocking search, topic map, or other retrieval application.

However, to make any sales, it needs to also deliver content to users.

I know, pain in the ass but people who pay for things want a result on the screen, intangible though it may be. 😉

June 26, 2013

Firefox Delivers 3D Gaming,…

Filed under: Javascript,Web Browser,WebGL — Patrick Durusau @ 9:16 am

Firefox Delivers 3D Gaming, Video Calls and File Sharing to the Web

From the post:

Rich activities like games and video calls were some of the last remaining challenges to prove that the Web is a capable and powerful platform for complex tasks. We conquered these challenges as part of Mozilla’s mission to advance the Web as the platfo rm for openness, innovation and opportunity for all.

Firefox allows developers to create amazing high-performance Web applications and enables video calls and file-sharing directly in the browser, all without the need for plugins or third-party software. What has been difficult to develop on the Web before is now much easier, faster and more fun.

Mozilla described a supercharged subset of JavaScript (asm.js) that enables developers to create high-intensity applications, like 3D games and photo processing, directly on the Web without having to install additional software or use plugins. Using the Emscripten cross-compiler, which can emit asm.js, it is possible to bring high-performance native applications, like games, to the Web.

The gaming lead almost caused me to skip this item. I haven’t played a video game since Boulder Dash on the Commodore 128. 😉

But support for games also means more mundane applications, like editors, perhaps even collaborative editors, spreadsheets, graphics programs and even topic maps could be supported as well.

June 18, 2013

Functional Javascript

Filed under: Functional Programming,Javascript,Programming — Patrick Durusau @ 1:08 pm

Functional Javascript by Michael Fogus.

From the post:

After a seemingly endless journey, the publication of Functional JavaScript is complete and books have found their way into peoples’ homes. Below is a list of useful links related to the book:

Enjoy.

More summer reading material!

June 4, 2013

WeevilScout [Distributed Browser Computing]

Filed under: Distributed Computing,Javascript,Web Browser — Patrick Durusau @ 2:35 pm

WeevilScout

From this poster:

The proliferation of web browsers and the performance gain being achieved by current JavaScript virtual machines raises the question whether Internet browsers can become yet another middleware for distributed computing.

Will we need new HPC benchmarks when 10 million high end PCs link their web browser JavaScript engines together?

What about 20 million high end PCs?

But the ability to ask questions of large data sets is no guarantee that we will formulate good questions to ask.

Pointers to discussions on how to decide what questions to ask?

Or do we ask the old questions and just get the results more quickly?

I first saw this at Nat Torkinton’s Four short links: 4 June 2013.

May 21, 2013

JSME: a free molecule editor in JavaScript

Filed under: Cheminformatics,Editor,Interface Research/Design,Javascript — Patrick Durusau @ 4:48 pm

JSME: a free molecule editor in JavaScript by Bruno Bienfait and Peter Ertl. (Journal of Cheminformatics 2013, 5:24 doi:10.1186/1758-2946-5-24)

Abstract:

Background

A molecule editor, i.e. a program facilitating graphical input and interactive editing of molecules, is an indispensable part of every cheminformatics or molecular processing system. Today, when a web browser has become the universal scientific user interface, a tool to edit molecules directly within the web browser is essential. One of the most popular tools for molecular structure input on the web is the JME applet. Since its release nearly 15 years ago, however the web environment has changed and Java applets are facing increasing implementation hurdles due to their maintenance and support requirements, as well as security issues. This prompted us to update the JME editor and port it to a modern Internet programming language – JavaScript.

Summary

The actual molecule editing Java code of the JME editor was translated into JavaScript with help of the Google Web Toolkit compiler and a custom library that emulates a subset of the GUI features of the Java runtime environment. In this process, the editor was enhanced by additional functionalities including a substituent menu, copy/paste, drag and drop and undo/redo capabilities and an integrated help. In addition to desktop computers, the editor supports molecule editing on touch devices, including iPhone, iPad and Android phones and tablets. In analogy to JME the new editor is named JSME. This new molecule editor is compact, easy to use and easy to incorporate into web pages.

Conclusions

A free molecule editor written in JavaScript was developed and is released under the terms of permissive BSD license. The editor is compatible with JME, has practically the same user interface as well as the web application programming interface. The JSME editor is available for download from the project web page http://peter-ertl.com/jsme/

Just in case you were having any doubts about using JavaScript to power an annotation editor.

Better now?

April 25, 2013

Client-side search

Filed under: Javascript,Lucene — Patrick Durusau @ 3:07 pm

Client-side search by Gene Golovchinsky.

From the post:

When we rolled out the CHI 2013 previews site, we got a couple of requests for being able to search the site with keywords. Of course interfaces for search are one of my core research interests, so that request got me thinking. How could we do search on this site? The problem with the conventional approach to search is that it requires some server-side code to do the searching and to return results to the client. This approach wouldn’t work for our simple web site, because from the server’s perspective, our site was static — just a few HTML files, a little bit of JavaScript, and about 600 videos. Using Google to search the site wouldn’t work either, because most of the searchable content is located on two pages, with hundreds of items on each page. So what to do?

I looked around briefly trying to find some client-side indexing and retrieval code, and struck out. Finally, I decided to take a crack at writing a search engine in JavaScript. Now, before you get your expectations up, I was not trying to re-implement Lucene in JavaScript. All I wanted was some rudimentary keyword search capability. Building that in JavaScript was not so difficult.

One simplifying assumption I could make was that my document collection was static: sorry, the submission deadline for the conference has passed. Thus, I could have a static index that could be made available to each client, and all the client needed to do was match and rank.

Each of my documents had a three character id, and a set of fields. I didn’t bother with the fields, and just lumped everything together in the index. The approach was simple, again due to lots of assumptions. I treated the inverted index as a hash table that maps keywords onto lists of document ids. OK, document ids and term frequencies. Including positional information is an exercise left to the reader.

A refreshing reminder that simplified requirements can lead to successful applications.

Or to put it another way, not every application has to meet every possible use case.

For example, I might want to have a photo matching application that only allows users to pick match/no match for any pair of photos.

Not why, what reasons for match/no match, etc.

But it does capture the users identity in an association as saying photo # and photo # are of the same person.

That doesn’t provide any basis for automated comparison of those judgments, but not every judgment is required to do so.

I am starting to think of subject identification as a continuum of practices, some of which enable more reuse than others.

Which of those you choose, depends upon your requirements, your resources and other factors.

Older Posts »

Powered by WordPress