Another Word For It Patrick Durusau on Topic Maps and Semantic Diversity

March 31, 2012

Graph Databases Make Apps Social

Filed under: Graph Databases,Graphs,Neo4j — Patrick Durusau @ 4:10 pm

Graph Databases Make Apps Social by Adrian Bridgwater.

Adrian writes:

Neo Technology has suggested that social graph database technology will become a key trend in the data science arena throughout 2012 and beyond. On the back of vindicating comments made by Forrester analyst James Kobielus, the company contends that social graph complexities are needed to meet the high query performance levels now required inside Internet scale cloud applications.

Unsurprisingly a vendor of graph database technology itself (although Neo4j is open source at heart before its commercially supported equivalent), Neo Technology points to social graph capabilities, which take information across a range of networks to understand the relationships between individuals.

Sounds like applications of interest to DoD/DARPA doesn’t it?

14 Ways to Contribute to Solr without Being a Programming Genius or a Rock Star

Filed under: Open Source,Solr — Patrick Durusau @ 4:10 pm

14 Ways to Contribute to Solr without Being a Programming Genius or a Rock Star

Andy Lester started the “14 Ways” view of projects with: 14 Ways to Contribute to Open Source without Being a Programming Genius or a Rock Star.

Andy opened with:

Open source software has changed computing and the world, and many of you would love to contribute. Unfortunately, many people are daunted by what they imagine is a high barrier to entry into a project. I commonly hear people say that they’d love to contribute but can’t because of three reasons:

  • “I’m not a very good programmer.”
  • “I don’t have much time to put into it.”
  • “I don’t know what project to work on.”

There are three core principles to remember as you look for opportunities to contribute:

  • Projects need contributions from everyone of all skills and levels of expertise.
  • The smallest of contributions is still more than none.
  • The best project to start working on is one that you use already.

The most damaging idea that I’ve observed among open source newbies is that to contribute to open source, you have to be some sort of genius programmer. This is not true. Certainly, there are those in the open source world who are seen as rock stars, and they may certainly be genius programmers. However, the vast majority of us are not. We’re just people who get stuff done. Sometimes we do a little, and sometimes we do a lot. Sometimes it’s programming, and sometimes it’s not.

Most of what makes open source work is actual work, time spent making things happen for the project. Most of these things don’t require the brains or vision of a Larry Wall, creator of Perl, or a David Heinemeier Hansson, creator of Rails. Designing a new language or a web framework may take inspiration, but the rest of what makes projects like Perl and Rails successful is perspiration. This work may not get all the glory, but it’s still necessary, and after a while, your contributions will get noticed.

What other projects merit a “14 Ways” post?

Using an RDF Data Pipeline to Implement Cross-Collection Search

Filed under: Heterogeneous Data,Museums,Searching,Solr — Patrick Durusau @ 4:10 pm

Using an RDF Data Pipeline to Implement Cross-Collection Search by David Henry and Eric Brown.

Abstract:

This paper presents an approach to transforming data from many diverse sources in support of a semantic cross-collection search application. It describes the vision and goals for a semantic cross-collection search and examines the challenges of supporting search of that kind using very diverse data sources. The paper makes the case for supporting semantic cross-collection search using semantic web technologies and standards including Resource Descriptive Framework (RDF), SPARQL Protocol and RDF Query Language (SPARQL ), and an XML mapping language. The Missouri History Museum has developed a prototype method for transforming diverse data sources into a data repository and search index that can support a semantic cross-collection search. The method presented in this paper is a data pipeline that transforms diverse data into localized RDF; then transforms the localized RDF into more generalized RDF graphs using common vocabularies; and ultimately transforms generalized RDF graphs into a Solr search index to support a semantic cross-collection search. Limitations and challenges of this approach are detailed in the paper.

A great report on the issues you will face with diverse data resources. (And who doesn’t have those?)

The “practical considerations” section is particularly interesting and I am sure the project participants would appreciate any suggestions you may have.

Incremental face recognition for large-scale social network services

Filed under: Image Recognition,Social Networks — Patrick Durusau @ 4:10 pm

Incremental face recognition for large-scale social network services by Kwontaeg Choia, Kar-Ann Tohb, and Hyeran Byuna.

Abstract:

Due to the rapid growth of social network services such as Facebook and Twitter, incorporation of face recognition in these large-scale web services is attracting much attention in both academia and industry. The major problem in such applications is to deal efficiently with the growing number of samples as well as local appearance variations caused by diverse environments for the millions of users over time. In this paper, we focus on developing an incremental face recognition method for Twitter application. Particularly, a data-independent feature extraction method is proposed via binarization of a Gabor filter. Subsequently, the dimension of our Gabor representation is reduced considering various orientations at different grid positions. Finally, an incremental neural network is applied to learn the reduced Gabor features. We apply our method to a novel application which notifies new photograph uploading to related users without having their ID being identified. Our extensive experiments show that the proposed algorithm significantly outperforms several incremental face recognition methods with a dramatic reduction in computational speed. This shows the suitability of the proposed method for a large-scale web service with millions of users.

Any number of topic map uses suggest themselves for robust face recognition software.

What’s yours?

23rd International Conference on Algorithmic Learning Theory (ALT 2012)

Filed under: Conferences,Machine Learning — Patrick Durusau @ 4:10 pm

23rd International Conference on Algorithmic Learning Theory (ALT 2012)

Important Dates:

Submission Deadline: May 17, 2012

Notification: July 8, 2012

Camera ready copy: July 20, 2012

Early registration deadline: August 30, 2012

The conference: October 29 – 31, 2012

From the call for papers:

The 23rd International Conference on Algorithmic Learning Theory (ALT 2012) will be held in Lyon, France, at Université Lumière Lyon 2, on October 29-31, 2012. The conference is on the theoretical foundations of machine learning. The conference will be co-located with the 15th International Conference on Discovery Science (DS 2012)

Topics of Interest: We invite submissions that make a wide
variety of contributions to the theory of learning, including the
following:

  • Comparison of the strength of learning models and the design and
    evaluation of novel algorithms for learning problems in
    established learning-theoretic settings such as

    • statistical learning theory,
    • on-line learning,
    • inductive inference,
    • query models,
    • unsupervised, semi-supervised and active learning.
  • Analysis of the theoretical properties of existing algorithms:
    • families of algorithms could include
      • boosting,
      • kernel-based methods, SVM,
      • Bayesian networks,
      • methods for reinforcement learning or learning in
        repeated games,

      • graph- and/or manifold-based methods,
      • methods for latent-variable estimation and/or clustering,
      • MDL,
      • decision tree methods,
      • information-based methods,
    • analyses could include generalization, convergence or
      computational efficiency.
  • Definition and analysis of new learning models. Models might
    • identify and formalize classes of learning problems
      inadequately addressed by existing theory or

    • capture salient properties of important concrete applications.

.

Curious: Do you know of any research comparing the topics of interest for a conference against the terms used in presentations for the conference?

DS 2012 : The 15th International Conference on Discovery Science

Filed under: Conferences,Data Mining,Machine Learning — Patrick Durusau @ 4:09 pm

DS 2012 : The 15th International Conference on Discovery Science

Important Dates:

Important Dates for Submissions

Full paper submission: 17 th May, 2012
Author notification: 8th July, 2012
Camera-ready papers due: 20th July, 2012

Important dates for all DS 2012 attendees

Deadline for early registration: 30th August, 2012
DS 2012 conference dates: 29-31 October, 2012

From the call for papers:

DS-2012 will be collocated with ALT-2012, the 23rd International Conference on Algorithmic Learning Theory. The two conferences will be held in parallel, and will share their invited talks.

DS 2012 provides an open forum for intensive discussions and exchange of new ideas among researchers working in the area of Discovery Science. The scope of the conference includes the development and analysis of methods for automatic scientific knowledge discovery, machine learning, intelligent data analysis, theory of learning, as well as their application to knowledge discovery. Very welcome are papers that focus on dynamic and evolving data, models and structures.

We invite submissions of research papers addressing all aspects of discovery science. We particularly welcome contributions that discuss the application of data analysis, data mining and other support techniques for scientific discovery including, but not limited to, biomedical, astronomical and other physics domains.

Possible topics include, but are not limited to:

  • Logic and philosophy of scientific discovery
  • Knowledge discovery, machine learning and statistical methods
  • Ubiquitous Knowledge Discovery
  • Data Streams, Evolving Data and Models
  • Change Detection and Model Maintenance
  • Active Knowledge Discovery
  • Learning from Text and web mining
  • Information extraction from scientific literature
  • Knowledge discovery from heterogeneous, unstructured and multimedia data
  • Knowledge discovery in network and link data
  • Knowledge discovery in social networks
  • Data and knowledge visualization
  • Spatial/Temporal Data
  • Mining graphs and structured data
  • Planning to Learn
  • Knowledge Transfer
  • Computational Creativity
  • Human-machine interaction for knowledge discovery and management
  • Biomedical knowledge discovery, analysis of micro-array and gene deletion data
  • Machine Learning for High-Performance Computing, Grid
    and Cloud Computing
  • Applications of the above techniques to natural or social sciences

I looked very briefly at prior proceedings. If those are any indication, this should be a very good conference.

Automated science, deep data and the paradox of information – Data As Story

Filed under: BigData,Epistemology,Information Theory,Modeling,Statistics — Patrick Durusau @ 4:09 pm

Automated science, deep data and the paradox of information…

Bradley Voytek writes:

A lot of great pieces have been written about the relatively recent surge in interest in big data and data science, but in this piece I want to address the importance of deep data analysis: what we can learn from the statistical outliers by drilling down and asking, “What’s different here? What’s special about these outliers and what do they tell us about our models and assumptions?”

The reason that big data proponents are so excited about the burgeoning data revolution isn’t just because of the math. Don’t get me wrong, the math is fun, but we’re excited because we can begin to distill patterns that were previously invisible to us due to a lack of information.

That’s big data.

Of course, data are just a collection of facts; bits of information that are only given context — assigned meaning and importance — by human minds. It’s not until we do something with the data that any of it matters. You can have the best machine learning algorithms, the tightest statistics, and the smartest people working on them, but none of that means anything until someone makes a story out of the results.

And therein lies the rub.

Do all these data tell us a story about ourselves and the universe in which we live, or are we simply hallucinating patterns that we want to see?

I reformulate Bradley’s question into:

We use data to tell stories about ourselves and the universe in which we live.

Which means that his rules of statistical methods:

  1. The more advanced the statistical methods used, the fewer critics are available to be properly skeptical.
  2. The more advanced the statistical methods used, the more likely the data analyst will be to use math as a shield.
  3. Any sufficiently advanced statistics can trick people into believing the results reflect truth.

are sources of other stories “about ourselves and the universe in which we live.”

If you prefer Bradley’s original question:

Do all these data tell us a story about ourselves and the universe in which we live, or are we simply hallucinating patterns that we want to see?

I would answer: And the difference would be?

HotSocial 2012

Filed under: Conferences,Data Mining,Social Media — Patrick Durusau @ 4:09 pm

HotSocial 2012: First ACM International Workshop on Hot Topics on Interdisciplinary Social Networks Research August 12, 2012, Beijing, China (in conjunction with ACM KDD 2012, August 12-16, 2012) http://user.informatik.uni-goettingen.de/~fu/hotsocial/

Important Dates:

Deadline for submissions: May 9, 2012 (11:59 PM, EST)
Notification of acceptance: June 1, 2012
Camera-ready version: June 12, 2012
HotSocial Workshop Day: Aug 12, 2012

From the post:

Among the fundamental open questions are:

  • How to access social networks data? Different communities have different means, each with pros and cons. Experience exchanges from different communities will be beneficial.
  • How to protect these data? Privacy and data protection techniques considering social and legal aspects are required.
  • How the complex systems and graph theory algorithms can be used for understanding social networks? Interdisciplinary collaboration are necessary.
  • Can social network features be exploited for a better computing and social network system design?
  • How do online social networks play a role in real-life (offline) community forming and evolution?
  • How does the human mobility and human interaction influence human behaviors and thus public health? How can we develop methodologies to investigate the public health and their correlates in the context of the social networks?

Topics of Interest:

Main topics of this workshop include (but are not limited to) the following:

  • methods for accessing social networks (e.g., sensor nets, mobile apps, crawlers) and bias correction for use in different communities (e.g., sociology, behavior studies, epidemiology)
  • privacy and ethic issues of data collection and management of large social graphs, leveraging social network properties as well as legal and social constraints
  • application of data mining and machine learning in the context of specific social networks
  • information spread models and campaign detection
  • trust and reputation and community evolution in the online and offline interacted social networks, including the presence and evolution of social identities and social capital in OSNs
  • understanding complex systems and scale-free networks from an interdisciplinary angle
  • interdisciplinary experiences and intermediate results on social network research

Sounds relevant to the “big data” stuff of interest to the White House.

PS: Have you noticed how some blogging software really sucks when you do “view source” on pages? Markup and data should be present. It makes content reuse easier. WordPress does it. How about your blogging software?

Big Data is a Big Deal

Filed under: BigData,Funding,Government — Patrick Durusau @ 4:09 pm

Big Data is a Big Deal

Tom Kalil, Deputy Director for Policy at OSTP (Office of Science and Technology Policy) wrote last Thursday (29 March 2012):

Today, the Obama Administration is announcing the “Big Data Research and Development Initiative.” By improving our ability to extract knowledge and insights from large and complex collections of digital data, the initiative promises to help accelerate the pace of discovery in science and engineering, strengthen our national security, and transform teaching and learning.

To launch the initiative, six Federal departments and agencies will announce more than $200 million in new commitments that, together, promise to greatly improve the tools and techniques needed to access, organize, and glean discoveries from huge volumes of digital data. Learn more about ongoing Federal government programs that address the challenges of, and tap the opportunities afforded by, the big data revolution in our Big Data Fact Sheet.

We also want to challenge industry, research universities, and non-profits to join with the Administration to make the most of the opportunities created by Big Data. Clearly, the government can’t do this on its own. We need what the President calls an “all hands on deck” effort.

Some companies are already sponsoring Big Data-related competitions, and providing funding for university research. Universities are beginning to create new courses—and entire courses of study—to prepare the next generation of “data scientists.” Organizations like Data Without Borders are helping non-profits by providing pro bono data collection, analysis, and visualization. OSTP would be very interested in supporting the creation of a forum to highlight new public-private partnerships related to Big Data.

If topic maps don’t garner some of the $200 million we have no one to blame but ourselves.

The Big Data Fact Sheet is thirteen pages of where the White House sees “big data” issues.

Erlang as a Cloud Citizen

Filed under: Cloud Computing,Erlang — Patrick Durusau @ 4:08 pm

Erlang as a Cloud Citizen by Paolo Negri. (Erlang Factory San Francisco 2012)

From the description:

This talk wants to sum up the experience of designing, deploying and maintaining an Erlang application targeting the cloud and precisely AWS as hosting infrastructure.

As the application now serves a significantly large user base with a sustained throughput of thousands of games actions per second we’re able to analyse retrospectively our engineering and architectural choices and see how Erlang fits in the cloud environment also comparing it to previous experiences of clouds deployments of other platforms.

We’ll discuss properties of Erlang as a language and OTP as a framework and how we used them to design a system that is a good cloud citizen. We’ll also discuss topics that are still open for a solution.

Interesting but you probably want to wait for the video. The slides are interesting, considering the argument for fractal-like engineering for scale, but not enough detail to be really useful.

Still, responding to 0.25 billion uncacheable reqs/day is a performance number you should not ignore. Depends on your use case.

March 30, 2012

Neo4j – Hyperedges and Cypher – Suggested Revisions

Filed under: Cypher,Graphs,Hyperedges,Hypergraphs,Neo4j — Patrick Durusau @ 4:40 pm

Recently “Hyperedges and Cypher” was cited to illustrate “improvements” to Neo4j documentation. It is deeply problematic.

The first paragraph and header read:

5.1 Hyperedges and Cypher

Imagine a user being part of different groups. A group can have different roles, and a user can be part of different groups. He also can have different roles in different groups apart from the membership. The association of a User, a Group and a Role can be referred to as a HyperEdge. However, it can be easily modeled in a property graph as a node that captures this n-ary relationship, as depicted below in the U1G2R1 node.

This is the first encounter of hyperedge (other than in the table of contents) for the reader. The manual offers no definition for or illustration of a “hyperedge.”

When terms are introduced, they need to be defined.

Here is the Neo4j illustration for the preceding description (from the latest milestone release):

Neo4j-Cypher-HyperEdge

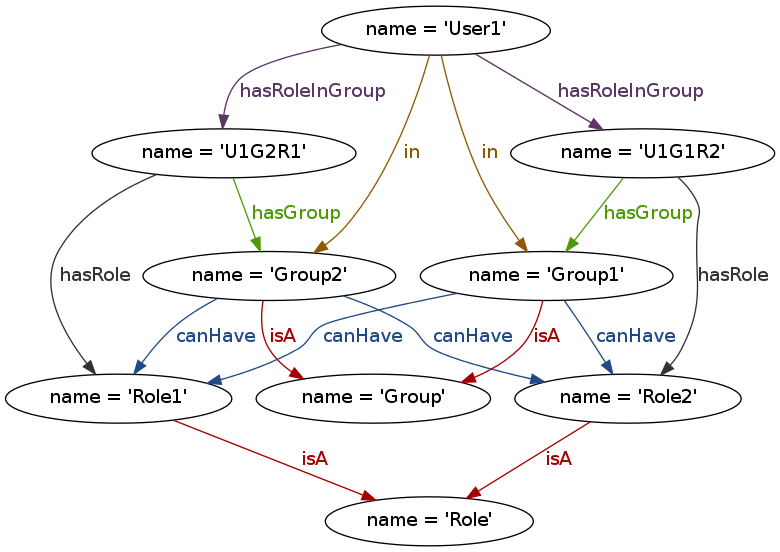
I don’t get that graph from the description in the text.

This graph comes closer:

User-Roles-Group

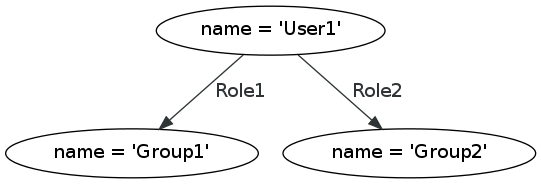
You may object that role1 and role2 should be nodes rather than an edges, but that is a modeling decision, another area where the Neo4j manual is weak. The reader doesn’t share in that process, nodes and edges suddenly appear and the reader must work out why?

If the current prose were cleaned up, by providing a better prose description, modeling choices and alternatives could be illustrated, along with Cypher queries.

On hypergraphs/hyperedges:

A user having different roles in different groups could be modeled with a hyperedge, but not necessarily so. If Neo4j isn’t going to support hyperedges, why bring it up? Show the modeling that Neo4j does support.

If I were going to discuss hyperedges/hypergraphs at all, I would point out examples of where they are used, along with citations to the literature.

Zoltan: Parallel Partitioning, Load Balancing and Data-Management Services

Filed under: Graph Coloring,Parallel Programming,Zoltan — Patrick Durusau @ 4:38 pm

Zoltan: Parallel Partitioning, Load Balancing and Data-Management Services

From project motivation:

Over the past decade, parallel computers have been used with great success in many scientific simulations. While differing in their numerical methods and details of implementation, most applications successfully parallelized to date are “static” applications. Their data structures and memory usage do not change during the course of the computation. Their inter-processor communication patterns are predictable and non-varying. And their processor workloads are predictable and roughly constant throughout the simulation. Traditional finite difference and finite element methods are examples of widely used static applications.

However, increasing use of “dynamic” simulation techniques is creating new challenges for developers of parallel software. For example, adaptive finite element methods refine localized regions the mesh and/or adjust the order of the approximation on individual elements to obtain a desired accuracy in the numerical solution. As a result, memory must be allocated dynamically to allow creation of new elements or degrees of freedom. Communication patterns can vary as refinement creates new element neighbors. And localized refinement can cause severe processor load imbalance as elemental and processor work loads change throughout a simulation.

Particle simulations and crash simulations are other examples of dynamic applications. In particle simulations, scalable parallel performance depends upon a good assignment of particles to processors; grouping physically close particles within a single processor reduces inter-processor communication. Similarly, in crash simulations, assignment of physically close surfaces to a single processor enables efficient parallel contact search. In both cases, data structures and communication patterns change as particles and surfaces move. Re-partitioning of the particles or surfaces is needed to maintain geometric locality of objects within processors.

We developed the Zoltan library to simplilfy many of the difficulties arising in dynamic applications. Zoltan is a collection of data management services for unstructured, adaptive and dynamic applications. It includes a suite of parallel partitioning algorithms, data migration tools, parallel graph coloring tools, distributed data directories, unstructured communication services, and dynamic memory management tools. Zoltan’s data-structure neutral design allows it to be used by a variety of applications without imposing restrictions on application data structures. Its object-based interface provides a simple and inexpensive way for application developers to use the library and researchers to make new capabilities available under a common interface.

The NoSQL advocates only recently discovered “big data.” There are those who have thought long and deep about processing issues for “big data.” New approaches and techniques will go further if compared and contrasted to prior understandings. This is one place for such an effort.

DiaGen/DiaMeta

Filed under: DiaGen,DiaMeta,Graphs,Networks — Patrick Durusau @ 4:38 pm

DiaGen/DiaMeta

From the webpage:

The Diagram Editor Generator

DiaGen

DiaGen is a system for easy developing of powerful diagram editors. It consists of two main parts:

  • A framework of Java classes that provide generic functionality for editing and analyzing diagrams.
  • A GUI tool (the DiaGen designer) for specifying the diagram language and automatically generating a visual editor from this specification.

The combination of the following main features distinguishes DiaGen from other existing diagram editing/analysis systems:

  • DiaGen editors include an analysis module to recognize the structure and syntactic correctness of diagrams on-line during the editing process. The structural analysis is based on hypergraph transformations and grammars, which provide a flexible syntactic model and allow for efficient parsing.
  • DiaGen has been specially designed for fault-tolerant parsing and handling of diagrams that are only partially correct.
  • DiaGen uses the structural analysis results to provide syntactic highlighting and an interactive automatic layout facility. The layout mechanism is based on flexible geometric constraints and relies on an external constraint-solving engine.
  • DiaGen combines free-hand editing in the manner of a drawing program with syntax-directed editing for major structural modifications of the diagram. The language implementor can therefore easily supply powerful syntax-oriented operations to support frequent editing tasks, but she does not have to worry about explicitly considering every editing requirement that may arise.
  • DiaGen is entirely written in Java and is based on Java SE (Version 6 is required). It is therefore platform-independent and can take full advantage of all the features of the Java2D graphics API: For example, DiaGen supports unrestricted zooming, and rendering quality is adjusted automatically during user interactions.

DiaGen uses hypergraph grammars to specify diagram languages. While this approach is powerful and its theory is very clear, it is hard for the unexperienced user to model an editor. A very common solution to this problem is meta-modeling, which is used by DiaMeta.

DiaMeta

DiaMeta allows to use meta models instead of grammars to specify visual languages. The current implementation employs the Eclipse Modeling Framework (EMF). Additionally, support for MOF (via MOFLON) is currently added. Editors generated by DiaMeta have the same benefits as those generated by DiaGen, and they show a similar behaviour like DiaGen.

If you need a custom diagram editor, this may be a good place to look around.

NodeXL: Network Overview, Discovery and Exploration for Excel

Filed under: Excel,Graphs,Networks,NodeXL — Patrick Durusau @ 4:37 pm

NodeXL: Network Overview, Discovery and Exploration for Excel

From the webpage:

NodeXL is a free, open-source template for Microsoft® Excel® 2007 and 2010 that makes it easy to explore network graphs. With NodeXL, you can enter a network edge list in a worksheet, click a button and see your graph, all in the familiar environment of the Excel window.

NodeXL Features

  • Flexible Import and Export Import and export graphs in GraphML, Pajek, UCINet, and matrix formats.
  • Direct Connections to Social Networks Import social networks directly from Twitter, YouTube, Flickr and email, or use one of several available plug-ins to get networks from Facebook, Exchange and WWW hyperlinks.
  • Zoom and Scale Zoom into areas of interest, and scale the graph’s vertices to reduce clutter.
  • Flexible Layout Use one of several “force-directed” algorithms to lay out the graph, or drag vertices around with the mouse. Have NodeXL move all of the graph’s smaller connected components to the bottom of the graph to focus on what’s important.
  • Easily Adjusted Appearance Set the color, shape, size, label, and opacity of individual vertices by filling in worksheet cells, or let NodeXL do it for you based on vertex attributes such as degree, betweenness centrality or PageRank.
  • Dynamic Filtering Instantly hide vertices and edges using a set of sliders—hide all vertices with degree less than five, for example.
  • Powerful Vertex Grouping Group the graph’s vertices by common attributes, or have NodeXL analyze their connectedness and automatically group them into clusters. Make groups distinguishable using shapes and color, collapse them with a few clicks, or put each group in its own box within the graph. “Bundle” intergroup edges to make them more manageable.
  • Graph Metric Calculations Easily calculate degree, betweenness centrality, closeness centrality, eigenvector centrality, PageRank, clustering coefficient, graph density and more.
  • Task Automation Perform a set of repeated tasks with a single click.

Homepage for NodeXL, which uses Excel as the framework for display and exploration of graphs.

There is something to be said about software that ties itself to other successful software. I think that is “increased chances of success.” Don’t you?

NodeGL: An online interactive viewer for NodeXL graphs uploaded to Google Spreadsheet

Filed under: Gephi,Graphs,NodeGL,NodeXL — Patrick Durusau @ 4:36 pm

NodeGL: An online interactive viewer for NodeXL graphs uploaded to Google Spreadsheet.

Martin Hawksey writes:

Recently Tony (Hirst) tipped me off about a new viewer for Gephi graphs. Developed by Raphaël Velt it uses JavaScript to parse Gephi .gefx files and output the result on a HTML5 canvas. The code for the viewer is on github available under a MIT license if you want to download and remash, I’ve also put an instance here if you want to play. Looking for a solution to render NodeXL data from a Google Spreadsheet in a similar way here is some background in the development of NodeGL – an online viewer of NodeXL graphs hosted on Google Spreadsheets

Introduction to NodeGL.

GraphMLViewer

Filed under: GraphML,Graphs — Patrick Durusau @ 4:35 pm

GraphMLViewer

From the webpage:

GraphMLViewer is a freely available Flash®-based viewer which can display diagrams, networks, and other graph-like structures in HTML web pages. It is optimized for diagrams which were created with the freely available yEd graph editor.

GraphML Specification

Filed under: GraphML,Graphs — Patrick Durusau @ 4:35 pm

GraphML Specification

GraphML is a comprehensive and easy-to-use file format for graphs. It consists of a language core to describe the structural properties of a graph and a flexible extension mechanism to add application-specific data. Its main features include support of

  • directed, undirected, and mixed graphs,
  • hypergraphs,
  • hierarchical graphs,
  • graphical representations,
  • references to external data,
  • application-specific attribute data, and
  • light-weight parsers.

Unlike many other file formats for graphs, GraphML does not use a custom syntax. Instead, it is based on XML and hence ideally suited as a common denominator for all kinds of services generating, archiving, or processing graphs.

Interchange syntax for graphs in XML.

GraphML Primer

Filed under: GraphML,Graphs — Patrick Durusau @ 4:35 pm

GraphML Primer

Abstract:

GraphML Primer is a non-normative document intended to provide an easily readable description of the GraphML facilities, and is oriented towards quickly understanding how to create GraphML documents. This primer describes the language features through examples which are complemented by references to normative texts.

Nice introduction to GraphML.

Structural Analysis of Large Networks: Observations and Applications

Filed under: Graphs,Networks,Social Networks — Patrick Durusau @ 4:34 pm

Structural Analysis of Large Networks: Observations and Applications by Mary McGlohon.

Abstract:

Network data (also referred to as relational data, social network data, real graph data) has become ubiquitous, and understanding patterns in this data has become an important research problem. We investigate how interactions in social networks are formed and how these interactions facilitate diffusion, model these behaviors, and apply these findings to real-world problems.

We examined graphs of size up to 16 million nodes, across many domains from academic citation networks, to campaign contributions and actor-movie networks. We also performed several case studies in online social networks such as blogs and message board communities.

Our major contributions are the following: (a) We discover several surprising patterns in network topology and interactions, such as Popularity Decay power law (in-links to a blog post decay with a power law with &emdash;1:5 exponent) and the oscillating size of connected components; (b) We propose generators such as the Butterfly generator that reproduce both established and new properties found in real networks; (c) several case studies, including a proposed method of detecting misstatements in accounting data, where using network effects gave a significant boost in detection accuracy.

A dissertation that establishes it isn’t the size of the network (think “web scale”) but the skill with which it is analyzed that is important.

McGlohon investigates the discovery of outliers, fraud and the like.

Worth reading and then formulating questions for your graph/graph database vendor about their support for such features.

The structure and function of complex networks (2003)

Filed under: Complex Networks,Graphs,Networks — Patrick Durusau @ 4:34 pm

The structure and function of complex networks by M. E. J. Newman (2003).

Abstract:

Inspired by empirical studies of networked systems such as the Internet, social networks, and biological networks, researchers have in recent years developed a variety of techniques and models to help us understand or predict the behavior of these systems. Here we review developments in this field, including such concepts as the small-world effect, degree distributions, clustering, network correlations, random graph models, models of network growth and preferential attachment, and dynamical processes taking place on networks.

Not the earliest survey of work on complex networks nor the latest but one that gives a good overview of the area. I will be citing later survey work on graphs and complex networks. Your pointers/suggestions are most welcome.

March 29, 2012

Timelines that are Easy to Make and Use

Filed under: Graphics,Visualization — Patrick Durusau @ 6:41 pm

Timelines that are Easy to Make and Use by Nathan Yau.

From the post:

As a project of the Knight News Innovation Lab, Timeline by Verite is an open source project that lets you make and share interactive timelines. It’s simple and customizable. Plug in your own data as JSON, or use the Google Docs template for an even faster route, and you’re good to embed. It’s also easy to grab source material from sites like Vimeo, YouTube, and Flickr. Score.

Makes me think of location information that is embedded in digital media as well. Which you could combine with a timeline display. Or with other information that is publicly available. Or should I say accessible? Not exactly the same thing.

AvocadoDB

Filed under: AvocadoDB,Graphs,NoSQL — Patrick Durusau @ 6:41 pm

AvocadoDB

From the webpage:

We recently started a new open source project – a nosql database called AvocadoDB.

Key features include:

  • Schema-free schemata let you combine the space efficiency of MySQL with the performance power of NoSQL
  • Use AvocadoDB as an application server and fuse your application and database together for maximal throughput
  • JavaScript for all: no language zoo, use just one language from your browser to your back-end
  • AvocadoDB is multi-threaded – exploit the power of all your cores
  • Flexible data modeling: model your data as combination of key-value pairs, documents or graphs – perfect for social relations
  • Free index choice: use the correct index for your problem, be it a skip list or a n-gram search
  • Configurable durability: let the application decide if it needs more durability or more performance
  • No-nonsense storage: AvocadoDB uses of all the power of modern storage hardware, like SSD and large caches
  • It is open source (Apache Licence 2.0)

The presentation you will find at the homepage says you can view your data as a graph. Apparently edges can have multiple properties. Looks worth further investigation.

Intro to Map Suite DynamoDB Extension Technology Preview

Filed under: Dynamo,Geo Analytics,Mapping — Patrick Durusau @ 6:40 pm

Intro to Map Suite DynamoDB Extension Technology Preview

Promotes Amazon’s DynamoDB, including pricing but an interesting presentation none the less.

A couple of suggestions:

The code mentioned in the presentation is unreadable. I am sure it worked at an actual presentation but doesn’t work on the web.

The extension is downloadable but requires MS Studio to be opened. Understand why there is a version for one of the more popular programming IDE’s but the product should not be restricted to that IDE.

Some resources that may be of interest:

http://thinkgeo.com/

Press Release on this extension.

Looking for feedback on the technology.

Great to be able to support GIS data robustly but the “killer” app for GIS data would be to integrate other data in real time.

For example, take a map of a major metropolitan area and integrate real time GIS coordinates from police and fire units, across jurisdictions during major public events. While at the same time integrating encounters, arrests, intelligence reports, both with each other as well as the GIS positions.

Related

Filed under: Graph Databases,Graphs,Redis,Related — Patrick Durusau @ 6:40 pm

Related

From the webpage:

Related

Related is a Redis-backed high performance distributed graph database.

Raison d’être

Related is meant to be a simple graph database that is fun, free and easy to use. The intention is not to compete with “real” graph databases like Neo4j, but rather to be a replacement for a relational database when your data is better described as a graph. For example when building social software. Related is very similar in scope and functionality to Twitters FlockDB, but is among other things designed to be easier to setup and use. Related also has better documentation and is easier to hack on. The intention is to be web scale, but we ultimately rely on the ability of Redis to scale (using Redis Cluster for example). Read more about the philosophy behind Related in the Wiki.

Well, which is it?

A “Redis-backed high performance distributed graph database,”

or

“…not to compete with “real” graph databases like Neo4j….?”

If the intent is to have a “web scale” distributed graph database, then it will be competing with other graph database products.

If you are building a graph database, keep an eye on René Pickhardt’s blog for notices about the next meeting of his graph reading club.

Why Hadoop MapReduce needs Scala

Filed under: Hadoop,MapReduce,Scalding,Scoobi — Patrick Durusau @ 6:40 pm

Why Hadoop MapReduce needs Scala – A look at Scoobi and Scalding DSLs for Hadoop by Age Mooij.

Fairly sparse slide deck but enough to get you interested enough to investigate what Scoobi and Scalding have to offer.

It may just be me but I find it easier to download the PDFs if I want to view code. The font/color just isn’t readable with online slides. Suggestion: Always allow for downloads of your slides as PDF files.

FYI:

Scoobi

Scalding

Network Analysis with igraph

Filed under: Graphs,igraph,R — Patrick Durusau @ 6:40 pm

Network Analysis with igraph by Gábor Csárdi.

I saw this mentioned on Christophe Lalanne’s Bag of Tweets for March 2012 and wanted to insert a word of caution.

While it is true that the igraph documentation page also points to the “Network Analysis with igraph” page as being “under development,” a number of sections are not done at all.

The most recent copyright date is 2006.

Just be aware that igraph 0.3.2 was released in December of 2006. The latest version of igraph is 0.5.4, released in August of 2010.

For your convenience: igraph at Sourceforge, development version at Launchpad.

The Best Way to Learn – The Worst Way to Teach

Filed under: Teaching — Patrick Durusau @ 6:40 pm

The Best Way to LearnThe Worst Way to Teach are a pair of columns by David Bressoud (DeWitt Wallace Professor of Mathematics at Macalester College in St. Paul, Minnesota, and Past-President of the Mathematical Association of America).

I discovered the references to these columns at the Mathematics for Computer Science page, listed under further readings.

Bressoud advocates use of IBL (Inquiry Based Learning), quoting the following definition for it:

Boiled down to its essence IBL is a teaching method that engages students in sense-making activities. Students are given tasks requiring them to solve problems, conjecture, experiment, explore, create, and communicate… all those wonderful skills and habits of mind that Mathematicians engage in regularly. Rather than showing facts or a clear, smooth path to a solution, the instructor guides students via well-crafted problems through an adventure in mathematical discovery.

I want to draw you attention to: “…the instructor guides students via well-crafted problems through an adventure….

I “get” the adventure part and agree the “well-crafted problems” would be the key to using this method to teach topic maps.

But, the creation of “well-crafted problems,” I could use some suggestions. I have fallen out of the practice of asking questions about some of the resources, but those aren’t really “well-crafted problems.” I think those would be more along the lines of having one or more plausible topic map solutions. That students could discover for themselves.

The Academy if Inquiry Based Learning has a number of resources, including: What is IBL?, the source of the quote on IBL.

Looking forward to your suggestions and comments on using IBL for the teaching of topic maps!

Introduction to Real Analysis

Filed under: Mathematics — Patrick Durusau @ 6:39 pm

Introduction to Real Analysis by William F. Trench.

From the introduction:

This is a text for a two-term course in introductory real analysis for junior or senior mathematics majors and science students with a serious interest in mathematics. Prospective educators or mathematically gifted high school students can also benefit from the mathematical maturity that can be gained from an introductory real analysis course.

The book is designed to fill the gaps left in the development of calculus as it is usually presented in an elementary course, and to provide the background required for insight into more advanced courses in pure and applied mathematics. The standard elementary calculus sequence is the only specific prerequisite for Chapters 1–5, which deal with real-valued functions. (However, other analysis oriented courses, such as elementary differential equation, also provide useful preparatory experience.) Chapters 6 and 7 require a working knowledge of determinants, matrices and linear transformations, typically available from a first course in linear algebra. Chapter 8 is accessible after completion of Chapters 1–5.

Without taking a position for or against the current reforms in mathematics teaching, I think it is fair to say that the transition from elementary courses such as calculus, linear algebra, and differential equations to a rigorous real analysis course is a bigger step today than it was just a few years ago. To make this step today’s students need more help than their predecessors did, and must be coached and encouraged more. Therefore, while striving throughout to maintain a high level of rigor, I have tried to write as clearly and informally as possible. In this connection I find it useful to address the student in the second person. I have included 295 completely worked out examples to illustrate and clarify all major theorems and definitions.

I have emphasized careful statements of definitions and theorems and have tried to be complete and detailed in proofs, except for omissions left to exercises. I give a thorough treatment of real-valued functions before considering vector-valued functions. In making the transition from one to several variables and fromreal-valued to vector-valued functions, I have left to the student some proofs that are essentially repetitions of earlier theorems. I believe that working through the details of straightforward generalizations of more elementary results is good practice for the student.

Great care has gone into the preparation of the 760 numbered exercises, many with multiple parts. They range from routine to very difficult. Hints are provided for the more difficult parts of the exercises.

Between this and the Mathematics for Computer Science book, you should not have to buy anything for your electronic book reader this summer. 😉

I saw this mentioned on Christophe Lalanne’s Bag of Tweets for March 2012.

Mathematics for Computer Science

Filed under: CS Lectures,Mathematics — Patrick Durusau @ 6:39 pm

Mathematics for Computer Science, by Eric Lehman, F Thomson Leighton, and Albert R Meyer.

Videos, slides, class problems, miniquizes, and reading material, including the book by the same name. There are officially released parts of the book and a draft of the entire work. Has a nice section on graphs.

I saw the book mentioned in Christophe Lalanne’s Bag of Tweets for March 2012 and then back tracked to the class site.

Mobile App Developer Competition (HaptiMap)

Filed under: Interface Research/Design,Mapping,Maps — Patrick Durusau @ 6:39 pm

Mobile App Developer Competition (HaptiMap)

From the website:

Win 4000 Euro, a smartphone or a tablet!

This competition is open for mobile apps, which demonstrate designs that can be used by a wide range of users and in a wide range of situations (also on the move). The designs can make use of visual (on-screen) elements, but they should also make significant use of the non-visual interaction channels. The competition is open both for newly developed apps as well as existing apps who are updated using the HaptiMap toolkit. To enter the competition, the app implementation must make use of the HaptiMap toolkit. Your app can rely on existing toolkit modules, but it is also possible extend or add appropriate modules (in line with the purpose of HaptiMap) into the toolkit.

Important dates:

The competition closes 15th of June 17.00 CET 2012. The winners will be announced at the HAID’12 workshop (http://www.haid.ws) 23-24 August 2012, Lund, Sweden.

In case you aren’t familiar with HaptiMap:

What is HaptiMap?

HaptiMap is an EU project which aims at making maps and location based services more accessible by using several senses like vision, hearing, and, particularly, touch. Enabling haptic access to mainstream map and LBS data allows more people to use them in a number of different environmental or individual circumstances. For example, when navigating in low-visibility (e.g., bright sunlight) and/or high noise environments, preferring to concentrate on riding your bike, sightseeing and/or listening to sounds, or when your visual and/or auditory senses are impaired (e.g., due to age).

If you think about it, what is being proposed is standard mapping but not using the standard (visual) channel.

Older Posts »

Powered by WordPress