Another Word For It Patrick Durusau on Topic Maps and Semantic Diversity

August 10, 2016

Failure of Thinking and Visualization

Filed under: Analytics,Graphics,Intelligence,Visualization — Patrick Durusau @ 9:03 pm

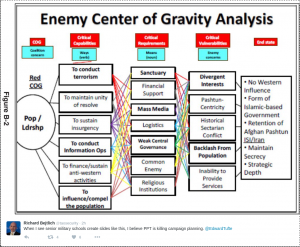
Richard Bejtlich posted this image (thumbnail, select for full size) with the note:

When I see senior military schools create slides like this, I believe PPT is killing campaign planning. @EdwardTufte

enemy-is-ppt

I am loathe to defend PPT but the problem here lies with the author and not PPT.

Or quite possibly with concept of “center of gravity analysis.”

Whatever your opinion about the imperialistic use of U.S. military force, 😉 , the U.S. military is composed of professional warriors who study their craft in great detail.

On the topic “center of gravity analysis,” try Addressing the Fog of COG: Perspectives on the Center of Gravity in US Military Doctrine, Celestino Perez, Jr., General Editor. A no-holds barred debate by military professionals on COG.

With or without a background on COG, how do your diagrams compare to this one?

August 15, 2015

Modeling and Analysis of Complex Systems

Filed under: Analytics,Complexity,Modeling,Python — Patrick Durusau @ 8:07 pm

Introduction to the Modeling and Analysis of Complex Systems by Hiroki Sayama.

From the webpage:

Introduction to the Modeling and Analysis of Complex Systems introduces students to mathematical/computational modeling and analysis developed in the emerging interdisciplinary field of Complex Systems Science. Complex systems are systems made of a large number of microscopic components interacting with each other in nontrivial ways. Many real-world systems can be understood as complex systems, where critically important information resides in the relationships between the parts and not necessarily within the parts themselves. This textbook offers an accessible yet technically-oriented introduction to the modeling and analysis of complex systems. The topics covered include: fundamentals of modeling, basics of dynamical systems, discrete-time models, continuous-time models, bifurcations, chaos, cellular automata, continuous field models, static networks, dynamic networks, and agent-based models. Most of these topics are discussed in two chapters, one focusing on computational modeling and the other on mathematical analysis. This unique approach provides a comprehensive view of related concepts and techniques, and allows readers and instructors to flexibly choose relevant materials based on their objectives and needs. Python sample codes are provided for each modeling example.

This textbook is available for purchase in both grayscale and color via Amazon.com and CreateSpace.com.

Do us all a favor and pass along the purchase options for classroom hard copies. This style of publishing will last only so long as a majority of us support it. Thanks!

From the introduction:

This is an introductory textbook about the concepts and techniques of mathematical/computational modeling and analysis developed in the emerging interdisciplinary field of complex systems science. Complex systems can be informally defined as networks of many interacting components that may arise and evolve through self-organization. Many real-world systems can be modeled and understood as complex systems, such as political organizations, human cultures/languages, national and international economies, stock markets, the Internet, social networks, the global climate, food webs, brains, physiological systems, and even gene regulatory networks within a single cell; essentially, they are everywhere. In all of these systems, a massive amount of microscopic components are interacting with each other in nontrivial ways, where important information resides in the relationships between the parts and not necessarily within the parts themselves. It is therefore imperative to model and analyze how such interactions form and operate in order to understand what will emerge at a macroscopic scale in the system.

Complex systems science has gained an increasing amount of attention from both inside and outside of academia over the last few decades. There are many excellent books already published, which can introduce you to the big ideas and key take-home messages about complex systems. In the meantime, one persistent challenge I have been having in teaching complex systems over the last several years is the apparent lack of accessible, easy-to-follow, introductory-level technical textbooks. What I mean by technical textbooks are the ones that get down to the “wet and dirty” details of how to build mathematical or
computational models of complex systems and how to simulate and analyze them. Other books that go into such levels of detail are typically written for advanced students who are already doing some kind of research in physics, mathematics, or computer science. What I needed, instead, was a technical textbook that would be more appropriate for a broader audience—college freshmen and sophomores in any science, technology, engineering, and mathematics (STEM) areas, undergraduate/graduate students in other majors, such as the social sciences, management/organizational sciences, health sciences and the humanities, and even advanced high school students looking for research projects who are interested in complex systems modeling.

Can you imagine that? A technical textbook appropriate for a broad audience?

Perish the thought!

I could name several W3C standards that could have used that editorial stance as opposed to: “…we know what we meant….”

I should consider that as a market opportunity, to translate insider jargon (and deliberately so) into more generally accessible language. Might even help with uptake of the standards.

While I think about that, enjoy this introduction to complex systems, with Python none the less.

June 12, 2015

Open Sourcing Pinot: Scaling the Wall of Real-Time Analytics

Filed under: Analytics,Pinot — Patrick Durusau @ 7:01 pm

Open Sourcing Pinot: Scaling the Wall of Real-Time Analytics by Kishore Gopalakrishna.

From the post:

Last fall we introduced Pinot, LinkedIn’s real-time analytics infrastructure, that we built to allow us to slice and dice across billions of rows in real-time across a wide variety of products. Today we are happy to announce that we have open sourced Pinot. We’ve had a lot of interest in Pinot and are excited to see how it is adopted by the open source community.

We’ve been using it at LinkedIn for more than two years, and in that time, it has established itself as the de facto online analytics platform to provide valuable insights to our members and customers. At LinkedIn, we have a large deployment of Pinot storing 100’s of billions of records and ingesting over a billion records every day. Pinot serves as the backend for more than 25 analytics products for our customers and members. This includes products such as Who Viewed My Profile, Who Viewed My Posts and the analytics we offer on job postings and ads to help our customers be as effective as possible and get a better return on their investment.

In addition, more than 30 internal products are powered by Pinot. This includes XLNT, our A/B testing platform, which is crucial to our business – we run more than 400 experiments in parallel daily on it.

I am intrigued by:

For ease of use we decided to provide a SQL like interface. We support most SQL features including a SQL-like query language and a rich feature set such as filtering, aggregation, group by, order by, distinct. Currently we do not support joins in order to ensure predictable latency.

“SQL-like” always seem a bit vague to me. Will be looking at the details on the query language.

Grab the code and/or see the documentation.

February 23, 2015

Announcing Pulsar: Real-time Analytics at Scale

Filed under: Analytics,Data Analysis,eBay,Pulsar — Patrick Durusau @ 8:54 pm

Announcing Pulsar: Real-time Analytics at Scale by Sharad Murthy and Tony Ng.

From the post:

We are happy to announce Pulsar – an open-source, real-time analytics platform and stream processing framework. Pulsar can be used to collect and process user and business events in real time, providing key insights and enabling systems to react to user activities within seconds. In addition to real-time sessionization and multi-dimensional metrics aggregation over time windows, Pulsar uses a SQL-like event processing language to offer custom stream creation through data enrichment, mutation, and filtering. Pulsar scales to a million events per second with high availability. It can be easily integrated with metrics stores like Cassandra and Druid.

pulsar_logo-e1423166909374

Why Pulsar

eBay provides a platform that enables millions of buyers and sellers to conduct commerce transactions. To help optimize eBay end users’ experience, we perform analysis of user interactions and behaviors. Over the past years, batch-oriented data platforms like Hadoop have been used successfully for user behavior analytics. More recently, we have newer use cases that demand collection and processing of vast numbers of events in near real time (within seconds), in order to derive actionable insights and generate signals for immediate action. Here are examples of such use cases:

  • Real-time reporting and dashboards
  • Business activity monitoring
  • Personalization
  • Marketing and advertising
  • Fraud and bot detection

We identified a set of systemic qualities that are important to support these large-scale, real-time analytics use cases:

  • Scalability – Scaling to millions of events per second
  • Latency – Sub-second event processing and delivery
  • Availability – No cluster downtime during software upgrade, stream processing rule updates , and topology changes
  • Flexibility – Ease in defining and changing processing logic, event routing, and pipeline topology
  • Productivity – Support for complex event processing (CEP) and a 4GL language for data filtering, mutation, aggregation, and stateful processing
  • Data accuracy – 99.9% data delivery
  • Cloud deployability – Node distribution across data centers using standard cloud infrastructure

Given our unique set of requirements, we decided to develop our own distributed CEP framework. Pulsar CEP provides a Java-based framework as well as tooling to build, deploy, and manage CEP applications in a cloud environment. Pulsar CEP includes the following capabilities:

  • Declarative definition of processing logic in SQL
  • Hot deployment of SQL without restarting applications
  • Annotation plugin framework to extend SQL functionality
  • Pipeline flow routing using SQL
  • Dynamic creation of stream affinity using SQL
  • Declarative pipeline stitching using Spring IOC, thereby enabling dynamic topology changes at runtime
  • Clustering with elastic scaling
  • Cloud deployment
  • Publish-subscribe messaging with both push and pull models
  • Additional CEP capabilities through Esper integration

On top of this CEP framework, we implemented a real-time analytics data pipeline.

That should be enough to capture your interest!

I saw it coming off of a two and one-half hour conference call. Nice way to decompress.

Other places to look:

If you don’t know Docker already, you will. Courtesy of the Pulsar Get Started page.

Nice to have yet another high performance data tool.

December 19, 2014

The top 10 Big data and analytics tutorials in 2014

Filed under: Analytics,Artificial Intelligence,BigData — Patrick Durusau @ 4:31 pm

The top 10 Big data and analytics tutorials in 2014 by Sarah Domina.

From the post:

At developerWorks, our Big data and analytics content helps you learn to leverage the tools and technologies to harness and analyze data. Let’s take a look back at the top 10 tutorials from 2014, in no particular order.

There are a couple of IBM product line specific tutorials but the majority of them you will enjoy whether you are an IBM shop or not.

Oddly enough, the post for the top ten (10) in 2014 was made on 26 September 2014.

Either Watson is far better than I have ever imagined or IBM has its own calendar.

In favor of an IBM calendar, I would point out that IBM has its own song.

A flag:

ibm-flag

IBM ranks ahead of Morocco in terms of GDP at $99.751 billion.

Does IBM have its own calendar? Hard to say for sure but I would not doubt it. 😉

November 12, 2014

Open Sourcing Cubert: A High Performance Computation Engine for Complex Big Data Analytics

Filed under: Analytics,BigData,Cubert — Patrick Durusau @ 4:01 pm

Open Sourcing Cubert: A High Performance Computation Engine for Complex Big Data Analytics by Maneesh Varshney and Srinivas Vemuri.

From the post:

Cubert was built with the primary focus on better algorithms that can maximize map-side aggregations, minimize intermediate data, partition work in balanced chunks based on cost-functions, and ensure that the operators scan data that is resident in memory. Cubert has introduced a new paradigm of computation that:

  • organizes data in a format that is ideally suited for scalable execution of subsequent query processing operators
  • provides a suite of specialized operators (such as MeshJoin, Cube, Pivot) using algorithms that exploit the organization to provide significantly improved CPU and resource utilization

Cubert was shown to outperform other engines by a factor of 5-60X even when the data set sizes extend into 10s of TB and cannot fit into main memory.

The Cubert operators and algorithms were developed to specifically address real-life big data analytics needs:

  • Complex Joins and aggregations frequently arise in the context of analytics on various user level metrics which are gathered on a daily basis from a user facing website. Cubert provides the unique MeshJoin algorithm that can process data sets running into terabytes over large time windows.
  • Reporting workflows are distinct from ad-hoc queries by virtue of the fact that the computation pattern is regular and repetitive, allowing for efficiency gains from partial result caching and incremental processing, a feature exploited by the Cubert runtime for significantly improved efficiency and resource footprint.
  • Cubert provides the new power-horse CUBE operator that can efficiently (CPU and memory) compute additive, non-additive (e.g. Count Distinct) and exact percentile rank (e.g. Median) statistics; can roll up inner dimensions on-the-fly and compute multiple measures within a single job.
  • Cubert provides novel algorithms for graph traversal and aggregations for large-scale graph analytics.

Finally, Cubert Script is a developer-friendly language that takes out the hints, guesswork and surprises when running the script. The script provides the developers complete control over the execution plan (without resorting to low-level programming!), and is extremely extensible by adding new functions, aggregators and even operators.

and the source/documentation:

Cubert source code and documentation

The source code is open sourced under Apache v2 License and is available at https://github.com/linkedin/Cubert

The documentation, user guide and javadoc are available at http://linkedin.github.io/Cubert

The abstractions for data organization and calculations were present in the following paper:
Execution Primitives for Scalable Joins and Aggregations in Map Reduce”, Srinivas Vemuri, Maneesh Varshney, Krishna Puttaswamy, Rui Liu. 40th International Conference on Very Large Data Bases (VLDB), Hangzhou, China, Sept 2014. (PDF)

Another advance in the processing of big data!

Now if we could just see a similar advance in the identification of entities/subjects/concepts/relationships in big data.

Nothing wrong with faster processing but a PB of poorly understood data is a PB of poorly understood data no matter how fast you process it.

May 24, 2014

…Data Analytics Hackathon

Filed under: Analytics,Data Analysis,ElasticSearch — Patrick Durusau @ 4:27 pm

Elasticsearch Teams up with MIT Sloan for Data Analytics Hackathon by Sejal Korenromp.

From the post:

Following from the success and popularity of the Hopper Hackathon we participated in late last year, last week we sponsored the MIT Sloan Data Analytics Club Hackathon for our latest offering to Elasticsearch aficionados. More than 50 software engineers, business students and other open source software enthusiasts signed up to participate, and on a Saturday to boot! The full day’s festivities included access to a huge storage and computing cluster, and everyone was set free to create something awesome using Elasticsearch.

Hacks from the finalists:

  • Quimbly – A Digital Library
  • Brand Sentiment Analysis
  • Conference Data
  • Twitter based sentiment analyzer
  • Statistics on Movies and Wikipedia

See Sejal’s post for the details of each hack and the winner.

I noticed several very good ideas in these hacks, no doubt you will notice even more.

Enjoy!

May 23, 2014

Data Analytics Handbook

Filed under: Analytics,BigData,Data Analysis — Patrick Durusau @ 3:58 pm

Data Analytics Handbook

The “handbook” appears in three parts, the first of which you download, while links to parts 2 and 3 are emailed to you for participating in a short survey. The survey collects your name, email address, educational background (STEM or not), and whether you are interested in a new resource that is being created to teach data analysis.

Let’s be clear up front that this is NOT a technical handbook.

Rather all three parts are interviews with:

Part 1: Data Analysts + Data Scientists

Part 2: CEO’s + Managers

Part 3: Researchers + Academics

Technical handbooks abound but this is one of the few (only?) books that covers the “soft” side of data analytics. By the “soft” side I mean the people and personal relationships that make up the data analytics industry. Technical knowledge is a must but being able to work well with others is as if not more important.

The interviews are wide ranging and don’t attempt to provide cut-n-dried answers. Readers will need to be inspired by and adapt the reported experiences to their own circumstances.

Of all the features of the books, I suspect I liked the “Top 5 Take Aways” the best.

In the interest of full disclosure, that maybe because part 1 reported:

2. The biggest challenge for a data analyst isn’t modeling, it’s cleaning and collecting

Data analysts spend most of their time collecting and cleaning the data required for analysis. Answering questions like “where do you collect the data?”, “how do you collect the data?”, and “how should you clean the data?”, require much more time than the actual analysis itself.

Well, when someone puts your favorite hobby horse at #2, see how you react. 😉

I first saw this in a tweet by Marin Dimitrov.

March 10, 2014

Algebraic and Analytic Programming

Filed under: Algebra,Analytics,Cyc,Mathematics,Ontology,Philosophy,SUMO — Patrick Durusau @ 9:17 am

Algebraic and Analytic Programming by Luke Palmer.

In a short post Luke does a great job contrasting algebraic versus analytic approaches to programming.

In an even shorter summary, I would say the difference is “truth” versus “acceptable results.”

Oddly enough, that difference shows up in other areas as well.

The major ontology projects, including linked data, are pushing one and only one “truth.”

Versus other approaches, such as topic maps (at least in my view), that tend towards “acceptable results.”

I am not sure what other measure of success you would have other than “acceptable results?”

Or what another measure for a semantic technology would be other than “acceptable results?”

Whether the universal truth of the world folks admit it or not, they just have a different definition of “acceptable results.” Their “acceptable results” means their world view.

I appreciate the work they put into their offer but I have to decline. I already have a world view of my own.

You?

I first saw this in a tweet by Computer Science.

March 8, 2014

LongoMatch

Filed under: Analytics,Annotation,Video — Patrick Durusau @ 8:40 pm

LongoMatch

From the “Features” page:

Performance analysis made easy

LongoMatch has been designed to be very easy to use, exposing the basic functionalities of video analysis in an intuitive interface. Tagging, playback and edition of stored events can be easily done from the main window, while more specific features can be accessed through menus when needed.

Flexible and customizable for all sports

LongoMatch can be used for any kind of sports, allowing to create custom templates with an unlimited number of tagging categories. It also supports defining custom subcategories and creating templates for your teams with detailed information of each player which is the perfect combination for a fine-grained performance analysis.

Post-match and real time analysis

LongoMatch can be used for post-match analysis supporting the most common video formats as well as for live analysis, capturing from Firewire, USB video capturers, IP cameras or without any capture device at all, decoupling the capture process from the analysis, but having it ready as soon as the recording is done. With live replay, without stopping the capture, you can review tagged events and export them while still analyzing the game live.

Although pitched as software for analyzing sports events, it occurs to me this could be useful in a number of contexts.

Such as analyzing news footage of police encounters with members of the public.

Or video footage of particular locations. Foot or vehicle traffic.

The possibilities are endless.

Then it’s just a question of tying that information together with data from other information feeds. 😉

February 13, 2014

Algebra for Analytics:…

Filed under: Algebra,Algorithms,Analytics — Patrick Durusau @ 3:44 pm

Algebra for Analytics: Two pieces for scaling computations, ranking and learning by P. Oscar Boykin.

Slide deck from Oscar’s presentation at Strataconf 2014.

I don’t normally say a slide deck on algebra is inspirational but I have to for this one!

Looking forward to watching the video of the presentation that went along with it.

Think of all the things you can do with associativity and hashes before you review the slide deck.

It will make it all the more amazing.

I first saw this in a tweet by Twitter Open Source.

December 22, 2013

Twitter Weather Radar – Test Data for Language Analytics

Filed under: Analytics,Language,Tweets,Weather Data — Patrick Durusau @ 8:17 pm

Twitter Weather Radar – Test Data for Language Analytics by Nicholas Hartman.

From the post:

Today we’d like to share with you some fun charts that have come out of our internal linguistics research efforts. Specifically, studying weather events by analyzing social media traffic from Twitter.

We do not specialize in social media and most of our data analytics work focuses on the internal operations of leading organizations. Why then would we bother playing around with Twitter data? In short, because it’s good practice. Twitter data mimics a lot of the challenges we face when analyzing the free text streams generated by complex processes. Specifically:

  • High Volume: The analysis represented here is looking at around 1 million tweets a day. In the grand scheme of things, that’s not a lot but we’re intentionally running the analysis on a small server. That forces us to write code that rapidly assess what’s relevant to the question we’re trying to answer and what’s not. In this case the raw tweets were quickly tested live on receipt with about 90% of them discarded. The remaining 10% were passed onto the analytics code.
  • Messy Language: A lot of text analytics exercises I’ve seen published use books and news articles as their testing ground. That’s fine if you’re trying to write code to analyze books or news articles, but most of the world’s text is not written with such clean and polished prose. The types of text we encounter (e.g., worklogs from an IT incident management system) are full of slang, incomplete sentences and typos. Our language code needs to be good and determining the messages contained within this messy text.
  • Varying Signal to Noise: The incoming stream of tweets will always contain a certain percentage of data that isn’t relevant to the item we’re studying. For example, if a band member from One Direction tweets something even tangentially related to what some code is scanning for the dataset can be suddenly overwhelmed with a lot of off-topic tweets. Real world data is similarly has a lot of unexpected noise.

In the exercise below, tweets from Twitter’s streaming API JSON stream were scanned in near real-time for their ability to 1) be pinpointed to a specific location and 2) provide potential details on local weather conditions. The vast majority of tweets passing through our code failed to meet both of these conditions. The tweets that remained were analyzed to determine the type of precipitation being discussed.

An interesting reminder that data to test your data mining/analytics is never far away.

If not Twitter, pick one of the numerous email archives or open data datasets.

The post doesn’t offer any substantial technical details but then you need to work those out for yourself.

October 30, 2013

MADlib

Filed under: Analytics,Machine Learning,MADlib,Mathematics,Statistics — Patrick Durusau @ 6:58 pm

MADlib

From the webpage:

MADlib is an open-source library for scalable in-database analytics. It provides data-parallel implementations of mathematical, statistical and machine-learning methods for structured and unstructured data.

The MADlib mission: to foster widespread development of scalable analytic skills, by harnessing efforts from commercial practice, academic research, and open-source development.

Until the Impala post called my attention to it, I didn’t realize that MADlib had an upgrade earlier in October to 1.3!

Congratulations to MADlib!

Use MADlib Pre-built Analytic Functions….

Filed under: Analytics,Cloudera,Impala,Machine Learning,MADlib — Patrick Durusau @ 6:53 pm

How-to: Use MADlib Pre-built Analytic Functions with Impala by Victor Bittorf.

From the post:

Cloudera Impala is an exciting project that unlocks interactive queries and SQL analytics on big data. Over the past few months I have been working with the Impala team to extend Impala’s analytic capabilities. Today I am happy to announce the availability of pre-built mathematical and statistical algorithms for the Impala community under a free open-source license. These pre-built algorithms combine recent theoretical techniques for shared nothing parallelization for analytics and the new user-defined aggregations (UDA) framework in Impala 1.2 in order to achieve big data scalability. This initial release has support for logistic regression, support vector machines (SVMs), and linear regression.

Having recently completed my masters degree while working in the database systems group at University of Madison Wisconsin, I’m excited to work with the Impala team on this project while I continue my research as a visiting student at Stanford. I’m going to go through some details about what we’ve implemented and how to use it.

As interest in data analytics increases, there is growing demand for deploying analytic algorithms in enterprise systems. One approach that has received much attention from researchers, engineers and data scientists is the integration of statistical data analysis into databases. One example of this is MADlib, which leverages the data-processing capabilities of an RDBMS to analyze data.

Victor walks through several examples of data analytics but for those of you who want to cut to the chase:

This package uses UDAs and UDFs when training and evaluating analytic models. While all of these tasks can be done in pure SQL using the Impala shell, we’ve put together some front-end scripts to streamline the process. The source code for the UDAs, UDFs, and scripts are all on GitHub.

Usual cautions apply: The results of your script or model may or may not have any resemblance to “facts” as experienced by others.

October 26, 2013

Machine Learning And Analytics…

Filed under: Analytics,Machine Learning,Python — Patrick Durusau @ 4:10 pm

Machine Learning And Analytics Using Python For Beginners by Naveen Venkataraman.

From the post:

Analytics has been a major personal theme in 2013. I’ve recently taken an interest in machine learning after spending some time in analytics consulting. In this post, I’ll share a few tips for folks looking to get started with machine learning and data analytics.

Audience

The audience for this article is people who are looking to understand the basics of machine learning and those who are interested in developing analytics projects using python. A coding background is not required in order to read this article

Most resource postings list too many resources to consult.

Naveen lists a handful of resources and why you should use them.

October 17, 2013

Predictive Analytics 101

Filed under: Analytics,Business Intelligence,Predictive Analytics — Patrick Durusau @ 6:05 pm

Predictive Analytics 101 by Ravi Kalakota.

From the post:

Insight, not hindsight is the essence of predictive analytics. How organizations instrument, capture, create and use data is fundamentally changing the dynamics of work, life and leisure.

I strongly believe that we are on the cusp of a multi-year analytics revolution that will transform everything.

Using analytics to compete and innovate is a multi-dimensional issue. It ranges from simple (reporting) to complex (prediction).

Reporting on what is happening in your business right now is the first step to making smart business decisions. This is the core of KPI scorecards or business intelligence (BI). The next level of analytics maturity takes this a step further. Can you understand what is taking place (BI) and also anticipate what is about to take place (predictive analytics).

By automatically delivering relevant insights to end-users, managers and even applications, predictive decision solutions aims to reduces the need of business users to understand the ‘how’ and focus on the ‘why.’ The end goal of predictive analytics = [Better outcomes, smarter decisions, actionable insights, relevant information].

How you execute this varies by industry and information supply chain (Raw Data -> Aggregated Data -> Contextual Intelligence -> Analytical Insights (reporting vs. prediction) -> Decisions (Human or Automated Downstream Actions)).

There are four types of data analysis:

    • Simple summation and statistics
    • Predictive (forecasting),
    • Descriptive (business intelligence and data mining) and
    • Prescriptive (optimization and simulation)

Predictive analytics leverages four core techniques to turn data into valuable, actionable information:

  1. Predictive modeling
  2. Decision Analysis and Optimization
  3. Transaction Profiling
  4. Predictive Search

This post is a very good introduction to predictive analytics.

You may have to do some hand holding to get executives through it but they will be better off for it.

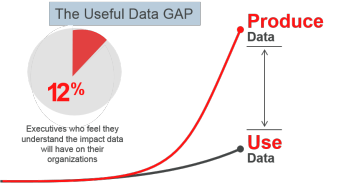
When you need support for more training of executives, use this graphic from Ravi’s post:

useful data gap

That startled even me. 😉

August 13, 2013

Solr as an Analytics Platform

Filed under: Analytics,Search Engines,Solr — Patrick Durusau @ 4:19 pm

Solr as an Analytics Platform by Chris Becker.

From the post:

Here at Shutterstock we love digging into data. We collect large amounts of it, and want a simple, fast way to access it. One of the tools we use to do this is Apache Solr.

Most users of Solr will know it for its power as a full-text search engine. Its text analyzers, sorting, filtering, and faceting components provide an ample toolset for many search applications. A single instance can scale to hundreds of millions of documents (depending on your hardware), and it can scale even further through sharding. Modern web search applications also need to be fast, and Solr can deliver in this area as well.

The needs of a data analytics platform aren’t much different. It too requires a platform that can scale to support large volumes of data. It requires speed, and depends heavily on a system that can scale horizontally through sharding as well. And some of the main operations of data analytics – counting, slicing, and grouping — can be implemented using Solr’s filtering and faceting options.
(…)

A good introduction to obtaining useful results with Solr with a minimum of effort.

Certainly a good way to show ROI when you are convincing your manager to sponsor you for a Solr conference and/or training.

July 30, 2013

Turning visitors into sales: seduction vs. analytics

Filed under: Analytics,Marketing — Patrick Durusau @ 3:00 pm

Turning visitors into sales: seduction vs. analytics by Mirko Krivanek.

From the post:

The context here is about increasing conversion rate, from website visitor to active, converting user. Or from passive newsletter subscriber to a lead (a user who opens the newsletter, clicks on the links, and converts). Here we will discuss the newletter conversion problem, although it applies to many different settings.

flower

Of course, to maximize the total number of leads (in any situation), you need to use both seduction and analytics:

sales = f(seduction, analytics, product, price, competition, reputation)

How to assess the weight attached to each factor in the above formula, is beyond the scope of this article. First, even measuring “seduction” or “analytics” is very difficult. But you could use a 0-10 scale, with seduction = 9 representing a company doing significant efforts to seduce prospects, and analytics = 0 representing a company totally ignoring analytics.

I did not add a category for “seduction.” Perhaps if someone writes a topic map on seduction I will. 😉

Mirko’s seduction vs. analytics resonates with Kahneman’s fast versus slow thinking.

“Fast” thinking takes less effort by a reader and “slow” thinking takes more.

Forcing your readers to work harder, for marketing purposes, sounds like a bad plan to me.

“Fast”/seductive thinking should be the goal of your marketing efforts.

July 24, 2013

Building a Real-time, Big Data Analytics Platform with Solr

Filed under: Analytics,BigData,Solr — Patrick Durusau @ 6:50 pm

Building a Real-time, Big Data Analytics Platform with Solr by Trey Grainger.

Description:

Having “big data” is great, but turning that data into actionable intelligence is where the real value lies. This talk will demonstrate how you can use Solr to build a highly scalable data analytics engine to enable customers to engage in lightning fast, real-time knowledge discovery.

At CareerBuilder, we utilize these techniques to report the supply and demand of the labor force, compensation trends, customer performance metrics, and many live internal platform analytics. You will walk away from this talk with an advanced understanding of faceting, including pivot-faceting, geo/radius faceting, time-series faceting, function faceting, and multi-select faceting. You’ll also get a sneak peak at some new faceting capabilities just wrapping up development including distributed pivot facets and percentile/stats faceting, which will be open-sourced.

The presentation will be a technical tutorial, along with real-world use-cases and data visualizations. After this talk, you’ll never see Solr as just a text search engine again.

Trey proposes a paradigm shift from document retrieval with Solr and towards returning aggregated information as a result of Solr searches.

Brief overview of faceting with examples of different visual presentations of returned facet data.

Rocking demonstration of the power of facets to power analytics! (Caveat: Yes, facets can do that, but good graphics is another skill entirely.)

Every customer has their own Solr index. (That’s a good idea.)

Implemented A/B testing using Solr. (And shows how he created it.)

This is a great presentation!

BTW, Trey is co-authoring: Solr in Action.

June 26, 2013

Hunk: Splunk Analytics for Hadoop Beta

Filed under: Analytics,Splunk — Patrick Durusau @ 1:28 pm

Hunk: Splunk Analytics for Hadoop Beta

From the post:

Hunk is a new software product to explore, analyze and visualize data in Hadoop. Building upon Splunk’s years of experience with big data analytics technology deployed at thousands of customers, it drives dramatic improvements in the speed and simplicity of interacting with and analyzing data in Hadoop without programming, costly integrations or forced data migrations.

  • Splunk Virtual Indexing (patent pending) – Explore, analyze and visualize data across multiple Hadoop distributions as if it were stored in a Splunk index
  • Easy to Deploy and Drive Fast Value – Simply point Hunk at your Hadoop cluster and start exploring data immediately
  • Interactive Analysis of Data in Hadoop – Drive deep analysis, pattern detection and find anomalies across terabytes and petabytes of data. Correlate data to spot trends and identify patterns of interest

I think this is the line that will catch most readers:

Hunk is compatible with virtually every leading Hadoop distribution. Simply point it at your Hadoop cluster and start exploring and analyzing your data within minutes.

Professional results may take longer but results within minutes will please most users.

June 25, 2013

Introducing Datameer 3.0 [Pushbutton Analytics]

Filed under: Analytics,Datameer — Patrick Durusau @ 3:46 pm

Introducing Datameer 3.0 by Stefan Groschupf

From the post:

Today, we are doubling down on our promise of making big data analytics on Hadoop self-service and a business user function with the introduction of Smart Analytics in Datameer 3.0. You can get the full details in our press release, or on our website, but in a single sentence, we’re giving subject matter experts like doctors, marketeers, or financial analysts a way to do actual data science with simple point and clicks. What once were complex algorithms are now buttons you can click that will “automagically” identify groups, relationships, patterns, and even build recommendations based on your data. A data scientist would call what we’re empowering business users to do ‘data mining’ or ‘machine learning,’ but we aren’t building a tool for data scientists. This is Smart Analytics.

A very good example that “data mining” and “machine learning” are useful, but not on the radar of the average user.

Users have some task they want to accomplish, whether that takes “data mining” or “machine learning” or enslaved fairies, they could care less.

The same can be said for promoting topic maps.

Subject identity, associations, etc., are interesting to a very narrow slice of the world’s population.

What is of interest to a very large slice of the world’s population is gaining some advantage over competitors or a benefit others don’t enjoy.

To the extent that subject identity and robust merging can help in those tasks, they are interested. But otherwise, not.

March 31, 2013

The new analytic stack…

Filed under: Analytics,Transparency — Patrick Durusau @ 5:00 am

The new analytic stack is all about management, transparency and users by George Mathew.

On transparency:

Predictive analytics are essential for data-driven leaders to craft their next best decision. There are a variety of techniques across the predictive and statistical spectrums that help businesses better understand the not too distant future. Today’s biggest challenge for predictive analytics is that it is delivered in a very black-box fashion. As business leaders rely more on predictive techniques to make great data-driven decisions, there needs to be much more of a clear-box approach.

Analytics need to be packaged with self-description of data lineage, derivation of how calculations were made and an explanation of the underlying math behind any embedded algorithms. This is where I think analytics need to shift in the coming years; quickly moving away from black-box capabilities, while deliberately putting decision makers back in the driver’s seat. That’s not just about analytic output, but how it was designed, its underlying fidelity and its inherent lineage — so that trusting in analytics isn’t an act of faith.

Now there’s an opportunity for topic maps.

Data lineage, derivations, math, etc. all have their own “logics” and the “logic” of how they are assembled for a particular use.

Could debate how to formalize those logics and might eventually reach agreement years after the need has passed.

Or, you could use a topic map to declare the subjects and relationships important for your analytics today.

And merge them with the logics you devise for tomorrows analytics.

March 28, 2013

…The Analytical Sandbox [Topic Map Sandbox?]

Filed under: Analytics,Data,Data Analysis — Patrick Durusau @ 6:38 pm

Analytics Best Practices: The Analytical Sandbox by Rick Sherman.

From the post:

So this situation sounds familiar, and you are wondering if you need an analytical sandbox…

The goal of an analytical sandbox is to enable business people to conduct discovery and situational analytics. This platform is targeted for business analysts and “power users” who are the go-to people that the entire business group uses when they need reporting help and answers. This target group is the analytical elite of the enterprise.

The analytical elite have been building their own makeshift sandboxes, referred to as data shadow systems or spreadmarts. The intent of the analytical sandbox is to provide the dedicated storage, tools and processing resources to eliminate the need for the data shadow systems.

Rick outlines what he thinks is needed for an analytical sandbox.

What would you include in a topic map sand box?

February 25, 2013

Calculate Return On Analytics Investment! [TM ROI/ROA?]

Filed under: Analytics,Marketing — Patrick Durusau @ 5:29 am

Excellent Analytics Tip #22: Calculate Return On Analytics Investment! by Avinash Kaushik.

From the post:

Analysts: Put up or shut up time!

This blog is centered around creating incredible digital experiences powered by qualitative and quantitative data insights. Every post is about unleashing the power of digital analytics (the potent combination of data, systems, software and people). But we’ve never stopped to consider this question:

What is the return on investment (ROI) of digital analytics? What is the incremental revenue impact on the company’s bottom-line for the investment in data, systems and people?

Isn’t it amazing? We’ve not pointed the sexy arrow of accountability on ourselves!

Let’s fix that in this post. Let’s calculate the ROI of digital analytics. Let’s show, with real numbers (!) and a mathematical formula (oh, my!), that we are worth it!

We shall do that in in two parts.

In part one, my good friend Jesse Nichols will present his wonderful formula for computing ROA (return on analytics).

In part two, we are going to build on the formula and create a model (ok, spreadsheet :)) that you can use to compute ROA for your own company. We’ll have a lot of detail in the model. It contains a sample computation you can use to build your own. It also contains multiple tabs full of specific computations of revenue incrementality delivered for various analytical efforts (Paid Search, Email Marketing, Attribution Analysis, and more). It also has one tab so full of awesomeness, you are going to have to download it to bathe in its glory.

Bottom-line: The model will give you the context you need to shine the bright sunshine of Madam Accountability on your own analytics practice.

Ready? (It is okay if you are scared. :)).

Would this work for measuring topic map ROI/ROA?

What other measurement techniques would you suggest?

December 23, 2012

OpenGamma updates its open source financial analytics platform [TM Opportunity in 2013]

Filed under: Analytics,Finance Services,Topic Maps — Patrick Durusau @ 8:26 pm

OpenGamma updates its open source financial analytics platform

From the post:

OpenGamma has released version 1.2 of its open source financial analytic and risk management platform. Released as Apache 2.0 licensed open source in April, the Java-based platform offers an architecture for delivering real-time available trading and risk analytics for front-office-traders, quants, and risk managers.
Version 1.2 includes a newly rebuilt beta of a new web GUI offering multi-pane analytics views with drag and drop panels, independent pop-out panels, multi-curve and surface viewers, and intelligent tab handling. Copy and paste is now more extensive and is capable of handing complex structures.
Underneath, the Analytics Library has been expanded to include support for Credit Default Swaps, Extended Futures, Commodity Futures and Options databases, and equity volatility surfaces. Data Management has improved robustness with schema checking on production systems and an auto-upgrade tool being added to handle restructuring of the futures/forwards database. The market and reference data’s live system now uses OpenGamma’s own component system. The Excel Integration module has also been enhanced and thanks to a backport now works with Excel 2003. A video shows the Excel module in action:

Integration with OpenGamma billed by OpenGamma as:

While true green-field development does exist in financial services, it’s exceptionally rare. Firms already have a variety of trade processing, analytics, and risk systems in place. They may not support your current requirements, or may be lacking in capabilities/flexibility; but no firm can or should simply throw them all away and start from scratch.

We think risk technology architecture should be designed to use and complement systems already supporting traders and risk managers. Whether proprietary or vendor solutions, considerable investments have been made in terms of time and money. Discarding them and starting from scratch risks losing valuable data and insight, and adds to the cost of rebuilding.

That being said, a primary goal of any project rethinking analytics or risk computation needs to be the elimination of all the problems siloed, legacy systems have: duplication of technology, lack of transparency, reconciliation difficulties, inefficient IT resourcing, etc.

The OpenGamma Platform was built from scratch specifically to integrate with any legacy data source, analytics library, trading system, or market data feed. Once that integration is done against our rich set of APIs and network endpoints, you can make use of it across any project based on the OpenGamma Platform.

A very valuable approach to integration, being able to access legacy or even current data sources.

But that leaves the undocumented semantics of data from those feeds on the cutting room floor.

The unspoken semantics of data from integrated feeds is like dry rot just waiting to make its presence known.

Suddenly and at the worst possible moment.

Compare that to documented data identity and semantics, which enables reliable re-use/merging of data from multiple sources.


So we are clear, I am not suggesting a topic maps platform with financial analytics capabilities.

I am suggesting incorporation of topic map capabilities into existing applications, such as OpenGamma.

That would take data integration to a whole new level.
December 4, 2012

Continuum Unleases Anaconda on Python Analytics Community

Filed under: Analytics,Python — Patrick Durusau @ 1:05 pm

Continuum Unleases Anaconda on Python Analytics Community

From the post:

Python-based data analytics solutions and services company, Continuum Analytics, today announced the release of the latest version of Anaconda, its collection of libraries for Python that includes Numba Pro, IOPro and wiseRF all in one package.

Anaconda enables large-scale data management, analysis, and visualization for business intelligence, scientific analysis, engineering, machine learning, and more. The latest release, version 1.2.1, includes improved performance and feature enhancements for Numba Pro and IOPro.

Available for Windows, Mac OS X and Linux, Anaconda includes packages more than 80 popular numerical and scientific Python libraries used by scientists, engineers and data analysts, with a single integrated and flexible installer. The company says its goal is to seamlessly support switching between multiple versions of Python and other packages, via a “Python environments” feature that allows mixing and matching different versions of Python, Numpy and Scipy.

New features and upgrades in the latest version of Anaconda include performance and feature enhancements to Numba Pro and IOPro, improved conda command and in addition, Continuum has added Qt to Linux versions and has also added mdp, MLTK and pytest.

Oh, you might like the Continuum Analytics link.

And the direct Anaconda link as well.

I expect people to go elsewhere after reading my analysis or finding a resource of interest.

Isn’t that what the web is supposed to be about?

December 3, 2012

AXLE: Advanced Analytics for Extremely Large European Databases

Filed under: Analytics,BigData,Orange,PostgreSQL — Patrick Durusau @ 2:25 pm

AXLE: Advanced Analytics for Extremely Large European Databases

From the webpage:

The objectives of the AXLE project are to greatly improve the speed and quality of decision making on real-world data sets. AXLE aims to make these improvements generally available through high quality open source implementations via the PostgreSQL and Orange products.

The project started in early November 2012. Will be checking back to see what is proposed for PostgreSQL and/or Orange.

November 10, 2012

Fantasy Analytics

Filed under: Analytics,Data Analysis,Marketing,Users — Patrick Durusau @ 12:52 pm

Fantasy Analytics by Jeff Jonas.

From the post:

Sometimes it just amazes me what people think is computable given their actual observation space. At times you have to look them in the eye and tell them they are living in fantasyland.

Jeff’s post will have you rolling on the floor!

Except that you can think of several industry and government IT projects that would fit seamlessly into his narrative.

The TSA doesn’t need “bomb” written on the outside of your carry-on luggage. They have “observers” who are watching passengers to identify terrorists. Their score so far? 0.

Which means really clever terrorists are eluding these brooding “observers.”

The explanation could not be after spending $millions on training, salaries, etc., that the concept of observers spotting terrorists is absurd.

They might recognize a suicide vest but most TSA employees can do that.

I am printing out Jeff’s post to keep on my desk.

To share with clients who are asking for absurd things.

If they don’t “get it,” I can thank them for their time and move on to more intelligent clients.

Who will complain less about being specific, appreciate the results and be good references for future business.

I first saw this in a tweet by Jeffrey Carr.

November 1, 2012

Design a Twitter Like Application with Nati Shalom

Filed under: Analytics,Cassandra,Stream Analytics,Tweets — Patrick Durusau @ 6:32 pm

Design a Twitter Like Application with Nati Shalom

From the description:

Design a large scale NoSQL/DataGrid application similar to Twitter with Nati Shalom.

The use case is solved with Gigaspaces and Cassandra but other NoSQL and DataGrids solutions could be used.

Slides : xebia-video.s3-website-eu-west-1.amazonaws.com/2012-02/realtime-analytics-for-big-data-a-twitter-case-study-v2-ipad.pdf

If you enjoyed the posts I pointed to at: Building your own Facebook Realtime Analytics System, you will enjoy the video. (Same author.)

Not to mention Nati teaches patterns, the specific software being important but incidental.

October 23, 2012

Up to Date on Open Source Analytics

Filed under: Analytics,MySQL,PostgreSQL,R,Software — Patrick Durusau @ 8:17 am

Up to Date on Open Source Analytics by Steve Miller.

Steve updates his Wintel laptop with the latest releases of open source analytics tools.

Steve’s list:

What’s on your list?

I first saw this mentioned at KDNuggets.

Older Posts »

Powered by WordPress