Another Word For It Patrick Durusau on Topic Maps and Semantic Diversity

October 7, 2016

DNC/DCCC/CF Excel Files, As Of October 7, 2016

Filed under: Cybersecurity,Excel,Government,Hillary Clinton,Politics — Patrick Durusau @ 4:36 pm

A continuation of my post Avoiding Viruses in DNC/DCCC/CF Excel Files.

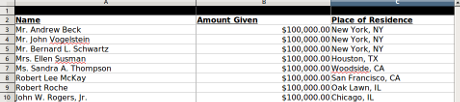
Where Avoiding Viruses… focused on avoiding the hazards and dangers of Excel-born viruses, this post focuses on preparing the DNC/DCCC/CF Excel files from Guccifer 2.0, as of October 7, 2016, for further analysis.

As I mentioned before, you could search through all 517 files to date, separately, using Excel. That thought doesn’t bring me any joy. You?

Instead, I’m proposing that we prepare the files to be concatenated together, resulting in one fairly large file, which we can then search and manipulate as one entity.

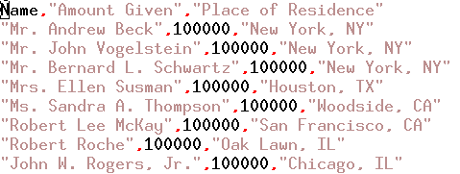
As a data cleanliness task, I prefer to prefix every line in every csv export, with the name of its original file. That will enable us to extract lines that mention the same person over several files and still have a bread crumb trail back to the original files.

Munging all the files together without such a step, would leave us either grepping across the collection and/or using some other search mechanism. Why not plan on avoiding that hassle?

Given the number of files requiring prefixing, I suggest the following:

for f in *.csv*; do
sed -i "s/^/$f,/" $f
done

This shell script uses sed with the -i switch, which means sed changes files in place (think overwriting specified part). Here the s/ means to substitute at the ^, start of each line, $f, the filename plus a comma separator and the final $f, is the list of files to be processed.

There are any number of ways to accomplish this task. Your community may use a different approach.

The result of my efforts is: guccifer2.0-all-spreadsheets-07October2016.gz, which weighs in at 61 MB compressed and 231 MB uncompressed.

I did check and despite having variable row lengths, it does load in my oldish version of gnumeric. All 1030828 lines.

That’s not all surprising for gnumeric, considering I’m running 24 GB of physical RAM. Your performance may vary. (It did hesitate loading it.)

There is much left to be done, such as deciding what padding is needed to even out all the rows. (I have ideas, suggestions?)

Tools to manipulate the CSV. I have a couple of stand-bys and a new one that I located while writing this post.

And, of course, once the CSV is cleaned up, what other means can we use to explore the data?

My focus will be on free and high performance (amazing how often those are found together Larry Ellison) tools that can be easily used for exploring vast seas of spreadsheet data.

Next post on these Excel files, Monday, October 10, 2016.


I am downloading the cf.7z Guccifer 2.0 drop as I write this update.

Watch for updates on the comprehensive file list and Excel files next Monday. October 8, 2016, 01:04 UTC.

Avoiding Viruses in DNC/DCCC/CF Excel Files

Filed under: Cybersecurity,Excel,Government,Hillary Clinton,Politics — Patrick Durusau @ 4:36 pm

I hope you haven’t opened any of the DNC/DCCC/CF Excel files outside of a VM. 517 Excel Files Led The Guccifer2.0 Parade (October 6, 2016)

Yes?

Files from trusted sources can contain viruses. Files from unknown or rogue sources even more so. However tempting (and easy) it is to open up alleged purloined files on your desktop, minimal security conscious users will resist the temptation.

Warning: I did NOT scan the Excel files for viruses. The best way to avoid Excel viruses is to NOT open Excel files.

I used ssconvert, one of the utilities included with gnumeric to bulk convert the Excel files to csv format. (Comma Separate Values is documents in RFC 4780.

Tip: If you are looking for a high performance spreadsheet application, take a look at gnumeric.

Ssconvert relies on file extensions (although other options are available) so I started with:

ssconvert -S donors.xlsx donors.csv

The -S option takes care of workbooks with multiple worksheets. You need a later version of ssconvert (mine is 1.12.9-1 (2013) and the current version of gnumeric and ssconvert is 1.12.31 (August 2016), to convert the .xlsx files without warning.

I’m upgrading to Ubuntu 16.04 soon so it wasn’t worth the trouble trying to stuff a later version of gnumeric/ssconvert onto my present Ubuntu 14.04.

Despite the errors, the conversion appears to have worked properly:

donors-01-460

to its csv output:

donor-03-460

I don’t see any problems.

I’m checking a sampling of the other conversions as well.

BTW, do notice the confirmation of reports from some commentators that they contacted donors who confirmed donating, but could not recall the amounts.

Could be true. If you pay protection money often enough, I’m sure it’s hard to recall a specific payment.

Sorry, I got distracted.

So, only 516 files to go.

I don’t recommend you do:

ssconvert -S filename.xlsx filename.csv

516 times. That will be tedious and error prone.

At least for Linux, I recommend:

for f in *.xls*; do
   ssconvert -S $f $f.csv
done

The *.xls* captures both .xsl and .xslx files, then invokes ssconvert -S on the file and then saves the output file with the original name, plus the extension .csv.

The wc -l command reports 1030828 lines in the consolidated csv file for these spreadsheets.

That’s a lot of lines!

I have some suggestions on processing that file, see: DNC/DCCC/CF Excel Files, As Of October 7, 2016.

August 9, 2016

Using Excel To Squash Duplicates

Filed under: Duplicates,Excel — Patrick Durusau @ 6:28 pm

How to use built-in Excel features to find duplicates by Susan Harkins.

From the post:

Duplicate values aren’t bad. In fact, most are necessary. However, duplicate records can skew reporting and analysis. Whether you’re finding duplicates in a single column or looking for duplicate records, Excel can do most of the work for you. In this article, I’ll show you easy ways to find duplicates by applying advanced filtering options and conditional formatting rules. First, we’ll define the term duplicate—it isn’t ambiguous, but context determines its meaning. Then, we’ll use Excel’s built-in features to find duplicates.

If the first paragraph hadn’t caught my attention, then:

Your definition of duplicate will depend on the business rule you’re applying.

certainly would have!

The same rule holds true for subject identity. It really depends on the business rule (read requirement) for your analysis.

In some cases subject may appear as topics/proxies but be ignored. Or their associations with other subjects will be ignored.

Or for some purposes, what were separate topics/proxies may form group subjects with demographic characteristics such as age, gender, voting status, etc.

If you are required to use Excel and bedeviled by duplicates, you will find this post quite useful.

April 23, 2016

Create a Heatmap in Excel

Filed under: Excel,Heatmaps,Visualization — Patrick Durusau @ 7:01 pm

Create a Heatmap in Excel by Jonathan Schwabish.

From the post:

Last week, I showed you how to use Excel’s Conditional Formatting menu to add cell formats to highlight specific data values. Here, I’ll show you how to easily use the Color Scales options in that menu to create a Heatmap.

Simply put, a heatmap is a table where the data are visualized using color. They pop up fairly regularly these days, sometimes showing the actual data values and sometimes not, like these two I pulled from FlowingData.

In addition to this post, there are a number of other Excel-centric visualization posts, podcasts and other high quality materials.

Even if you aren’t sold on Excel, you will learn a lot about visualization here.

Enjoy!

April 22, 2016

How to Use Excel

Filed under: Excel,Spreadsheets — Patrick Durusau @ 8:25 pm

At the other end of the software universe from Erlang is Excel. 😉

Sometimes you don’t need a hand rolled death ray but something more prosaic.

But you need skills even with simple tools. This tutorial will get you past a number of “obvious” to experienced Excel user gotchas.

How to Use Excel

From the post:

Ever find yourself elbows deep in an Excel worksheet with seemingly no end in sight? You’re manually replicating columns and scribbling down long-form math on a scrap of paper, all while thinking to yourself, “There has to be a better way to do this.”

Truth be told, there probably is … you just don’t know it yet. In a world where being proficient in Excel is often regarded as no more impressive than being proficient at breathing, there are still plenty of tips and tricks that remain unknown to the majority of office workers.

Mastering Excel specifically for marketing is another beast in its own right. More than likely, you’ve already been tasked with analyzing data from an NPS survey, performing a content topic analysis, or pulling in sales data to calculate return on marketing investment — all of which require a bit more Excel knowledge than a simple SUM formula.

Here’s where this guide comes in. Whether you’d like to speed up your chart formatting, finally understand pivot tables, or complete a VLOOKUP (I promise it’s not as scary as it sounds), we’ll teach you everything you need to know to call yourself a master of Excel — and truly mean it.

Since we all know that reading about Excel may not be the most captivating topic, we’ve tried to cater the training to your unique learning style. At the start of each advanced topic, you’ll find a short video to dip your toe in the water — a perfect solution for those pressed for time and in search of a quick answer. Next, the deep dive. Read along for a few extra functions and reporting insight. Finally, for those who learn best by doing, we’ve included Test Your Skills questions at the close of each chapter for you to complete with our Excel practice document.

Enjoy!

March 8, 2015

Data Journalism (Excel)

Filed under: Excel,Journalism,Spreadsheets — Patrick Durusau @ 2:01 pm

Data Journalism by Ken Blake.

From the webpage:

Learning to use a spreadsheet will transform how you do what you do as a media professional. The YouTube-hosted videos below demonstrate some of the possibilities. If you like, download the datasets and follow along.

I use the PC version of Excel 2010, Microsoft’s cheap, ubiquitous spreadsheet program. It can do some things that the Mac version can’t. But if you’re a Mac user, you’ll still find plenty worth watching.

Everything is free to watch and download. If you’d like to use these materials elsewhere, please just e-mail me first and ask permission. Questions, suggestions and requests are welcome, too. See my contact information.

And check back now and then. I’ll be adding more stuff soon.

Disclaimer: These tutorials will not help you perform NLP on Klingon nor are they a guide to GPU-based deep learning in order to improve your play in Mortal Kombat X.

Having gotten those major disappointments out of the way, these tutorials will help you master Excel and to use it effectively in uncovering the misdeeds of small lives in local and state government.

To use “big data” tools with small data is akin to hunting rats with an elephant gun. Doable, but expensive and difficult to master.

As an added bonus, processing small data will give you experience with the traps and pitfalls of data, which remain important whether your data sets are big or small.

Enjoy!

February 4, 2015

Creating Excel files with Python and XlsxWriter

Filed under: Excel,Microsoft,Python,Spreadsheets — Patrick Durusau @ 4:53 pm

Creating Excel files with Python and XlsxWriter

From the post:

XlsxWriter is a Python module for creating Excel XLSX files.

demo-xlsxwriter

(Sample code to create the above spreadsheet.)

XlsxWriter

XlsxWriter is a Python module that can be used to write text, numbers, formulas and hyperlinks to multiple worksheets in an Excel 2007+ XLSX file. It supports features such as formatting and many more, including:

  • 100% compatible Excel XLSX files.
  • Full formatting.
  • Merged cells.
  • Defined names.
  • Charts.
  • Autofilters.
  • Data validation and drop down lists.
  • Conditional formatting.
  • Worksheet PNG/JPEG images.
  • Rich multi-format strings.
  • Cell comments.
  • Memory optimisation mode for writing large files.

I know what you are thinking. If you are processing the data with Python, why the hell would you want to write data to XSL or XLSX?

Good question! But it also has an equally good answer.

Attend a workshop for mid-level managers and introduce one of the speakers saying:

We are going to give away copies of the data used in this presentation. By show of hands, how many people want it in R format? Now, how many people want it in Excel format?

Or you can reverse the questions so the glazed look from the audience on the R question doesn’t blind you. 😉

If your data need to transition to management, at least most management, spreadsheet formats are your friend.

If you don’t believe me, see any number of remarkable presentation by Felienne Hermans on the use of spreadsheets or check out my spreadsheets category.

Don’t get me wrong, I prefer being closer to the metal but on the other hand, delivering data that users can use is more profitable than the alternatives.

I first saw this in a tweet by Scientific Python.

January 15, 2015

Data analysis to the MAX()

Filed under: Excel,Spreadsheets — Patrick Durusau @ 7:45 pm

Data analysis to the MAX() by Felienne Hermans

School: DelftX

Course Code: EX101x

Classes Start: 6 Apr 2015

Course Length: 8 weeks

Estimated effort: 4-6 hours per week

From the webpage:

EX101x is for all of those struggling with data analysis. That crazy spreadsheet from your boss? Megabytes of sensor data to analyze? Looking for a smart way visualize your data in order to make sense out of it? We’ve got you covered!

Using video lectures and hands-on exercises, we will teach you techniques and best practices that will boost your data analysis skills.

We will take a deep dive into data analysis with spreadsheets: PivotTables, VLOOKUPS, Named ranges, what-if analyses, making great graphs – all those will be covered in the first weeks of the course. After, we will investigate the quality of the spreadsheet model, and especially how to make sure your spreadsheet remains error-free and robust.

Finally, once we have mastered spreadsheets, we will demonstrate other ways to store and analyze data. We will also look into how Python, a programming language, can help us with analyzing and manipulating data in spreadsheets.

EX101x will be created using Excel 2013, but the course can be followed using another spreadsheet program as well.

The goal of this course is it to help you to overcome data analysis challenges in your work, research or studies. Therefore we encourage you to participate actively and to raise real data analysis problems that you face in our discussion forums.

Want to stay up to date with the latest news on EX101x and behind the scenes footage? We have a Twitter account -> @EX101x

If your boss is a spreadsheet user (most of them are), imagine being able to say that not only does Mahout say this is the answer, so does their spreadsheet. 😉

I have never seen Felienne speak in person but I have seen enough videos to know she is a dynamic speaker. Enjoy!

0.1 Most important button in excel

Filed under: Excel — Patrick Durusau @ 7:33 pm

Felienne Hermans demonstrates the most important button in Excel. Hint, it helps you to understand formulas written by others.

After watching the video (1:20), can you answer this question:

Where is the debug button on your favorite software?

If there isn’t one, can you imagine it with one?

August 11, 2014

How to Transition from Excel to R

Filed under: Excel,R — Patrick Durusau @ 2:30 pm

How to Transition from Excel to R: An Intro to R for Microsoft Excel Users by Tony Ojeda.

From the post:

In today’s increasingly data-driven world, business people are constantly talking about how they want more powerful and flexible analytical tools, but are usually intimidated by the programming knowledge these tools require and the learning curve they must overcome just to be able to reproduce what they already know how to do in the programs they’ve become accustomed to using. For most business people, the go-to tool for doing anything analytical is Microsoft Excel.

If you’re an Excel user and you’re scared of diving into R, you’re in luck. I’m here to slay those fears! With this post, I’ll provide you with the resources and examples you need to get up to speed doing some of the basic things you’re used to doing in Excel in R. I’m going to spare you the countless hours I spent researching how to do this stuff when I first started so that you feel comfortable enough to continue using R and learning about its more sophisticated capabilities.

Excited? Let’s jump in!

Not a complete transition but enough to give you a taste of R that will leave you wanting more.

You will likely find R is better for some tasks and that you prefer Excel for others. Why not have both in your toolkit?

April 9, 2014

BumbleBee, a tool for spreadsheet formula transformations

Filed under: Excel,Functional Programming,Programming,Spreadsheets — Patrick Durusau @ 4:13 pm

BumbleBee, a tool for spreadsheet formula transformations by Felienne Hermans.

From the webpage:

Some spreadsheets can be improved

While looking at spreadsheet and how they are used, over the past years I have noticed that many users don’t make their spreadsheets as easy as they could be. For instance, they use A1+A2+A3+A4+A5 instead of the simpler SUM(A1:A5) Sometimes because they are unaware of a simpler construct, or because the spreadsheet evolved over time. For instance, in used to be A1+A2, then A3 was added and so forth. Such complex formulas were exactly the aim of our previous work on smell detection.

If you say smell, you say… refactorings!

So in order to improve spreadsheets, we and other researchers have developed a number of refactorings to improve spreadsheet formulas. Over the last few months, I have been working on BumbleBee, a tool to perform not only refactorings, but more general transformations on spreadsheet formulas.

Update on her work on refactoring spreadsheets, along with a BumbleBee paper preprint, along with an installer for Excel 2010.

Imagine, going where users are using data.

This could prove to be explosively popular.

March 22, 2014

Building a Language for Spreadsheet Refactoring

Filed under: Excel,F#,Programming,Spreadsheets — Patrick Durusau @ 2:48 pm

Building a Language for Spreadsheet Refactoring by Felienne Hermans.

Summary:

Felienne Hermans introduces BumbleBee, a refactoring and metaprogramming spreadsheets tool based on a DSL that can perform transformations against spreadsheet formulas.

Argues that spreadsheets are code, rather convincingly. (Answer to the everybody must code argument?)

Uses code smell based analysis.

Has authored a refactoring tool for Excel.

Covers functional programming in F# to create the refactoring for Excel.

Analyzing and Visualizing Spreadsheets Felienne’s dissertation.

Abstract:

Spreadsheets are used extensively in industry: they are the number one tool for financial analysis and are also prevalent in other domains, such as logistics and planning. Their flexibility and immediate feedback make them easy to use for non-programmers.

But as easy as spreadsheets are to build, so difficult can they be to analyze and adapt. This dissertation aims at developing methods to support spreadsheet users to understand, update and improve spreadsheets. We took our inspiration for such methods from software engineering, as this field is specialized in the analysis of data and calculations. In this dissertation, we have looked at four different aspects of spreadsheets: metadata, structure, formulas and data. We found that methods from software engineering can be applied to spreadsheets very well, and that these methods support end-users in working with spreadsheets.

If you agree that spreadsheets are programming, how often do you think user/programmers are capturing the semantics of their spreadsheets?

That’s what I thought as well.

PS: Felienne’s website: http://felienne.com, Twitter: @felienne

January 22, 2014

Empowering Half a Billion Users For Free –
Would You?

Filed under: Excel,Hadoop YARN,Hortonworks,Microsoft — Patrick Durusau @ 5:24 pm

How To Use Microsoft Excel to Visualize Hadoop Data by Saptak Sen.

From the post:

Microsoft and Hortonworks have been working together for over two years now with the goal of bringing the power of Big Data to a billion people. As a result of that work, today we announced the General Availability of HDP 2.0 for Windows with the full power of YARN.

There are already over half a billion Excel users on this planet.

So, we have put together a short tutorial on the Hortonworks Sandbox where we walk through the end-to-end data pipeline using HDP and Microsoft Excel in the shoes of a data analyst at a financial services firm where she:

  • Cleans and aggregates 10 years of raw stock tick data from NYSE
  • Enriches the data model by looking up additional attributes from Wikipedia
  • Creates an interactive visualization on the model

You can find the tutorial here.

As part of this process you will experience how simple it is to integrate HDP with the Microsoft Power BI platform.

This integration is made possible by the community work to design and implement WebHDFS, an open REST API in Apache Hadoop. Microsoft used the API from Power Query for Excel to make the integration to Microsoft Business Intelligence platform seamless.

Happy Hadooping!!!

Opening up Hadoop to a half of billion users can’t do anything but drive the development of the Hadoop ecosystem.

Which will in turn return more benefits to the Excel user community, which will drive usage of Excel.

That’s what I call a smart business strategy.

You?

PS: Where are there similar strategies possible for subject identity?

October 26, 2013

Excel the Ultimate

Filed under: Excel,Spreadsheets — Patrick Durusau @ 1:04 pm

Excel the Ultimate by Christophe Grand.

I know. That was my reaction when I saw the tweet from Christophe.

On my Clojure feed no less!

Still, I was recovering from working out in the yard. If I was confused when I read something about Excel, no harm, no foul. 😉

Went back to it first after I rested up. You don’t want to be confused for this one.

It’s only twenty-four clicks to get through the slides. View them first.

Then take this link, https://github.com/cgrand/spreadmap, where you will find “spreadmap.”

What is spreadmap?

Evil Clojure library to turn Excel spreadsheets in persistent reactive associative structures.

I concede that Excel spreadsheets do not give voice to the powerless, access to the disenfranchised, or work as a force for democracy around the world.

Neither does the NSA. What was your question again?

September 25, 2013

Easier than Excel:…

Filed under: Excel,Gephi,Graphs,Networks,Social Networks — Patrick Durusau @ 4:59 pm

Easier than Excel: Social Network Analysis of DocGraph with Gephi by Janos G. Hajagos and Fred Trotter. (PDF)

From the session description:

The DocGraph dataset was released at Strata RX 2012. The dataset is the result of FOI request to CMS by healthcare data activist Fred Trotter (co-presenter). The dataset is minimal where each row consists of just three numbers: 2 healthcare provider identifiers and a weighting factor. By combining these three numbers with other publicly available information sources novel conclusions can be made about delivery of healthcare to Medicare members. As an example of this approach see: http://tripleweeds.tumblr.com/post/42989348374/visualizing-the-docgraph-for-wyoming-medicare-providers

The DocGraph dataset consists of over 49,685,810 relationships between 940,492 different Medicare providers. Analyzing the complete dataset is too big for traditional tools but useful subsets of the larger dataset can be analyzed with Gephi. Gephi is a opensource tool to visually explore and analyze graphs. This tutorial will teach participants how to use Gephi for social network analysis on the DocGraph dataset.

Outline of the tutorial:

Part 1: DocGraph and the network data model (30% of the time)

The DocGraph dataset The raw data Helper data (NPI associated data) The graph / network data model Nodes versus edges How graph models are integral to social networking Other Healthcare graph data sets

Part 2: Using Gephi to perform analysis (70% of the time)

Basic usage of Gephi Saving and reading the GraphML format Laying out edges and nodes of a graph Navigating and exploring the graph Generating graph metrics on the network Filtering a subset of the graph Producing the final output of the graph.

Links from the last slide:

http://strata.oreilly.com/2012/11/docgraph-open-social-doctor-data.html (information)

https://github.com/jhajagos/DocGraph (code)

http://notonlydev.com/docgraph-data (open source $1 covers bandwidth fees)

https://groups.google.com/forum/#!forum/docgraph (mailing list)

Just in case you don’t have it bookmarked already: Gephi.

The type of workshop that makes an entire conference seem like lagniappe.

Just sorry I will have to appreciate it from afar.

Work through this one carefully. You will acquire useful skills doing so.

August 3, 2013

Unpivoting Data with Excel, Open Refine and Python

Filed under: Data,Excel,Google Refine,Python — Patrick Durusau @ 4:09 pm

Unpivoting Data with Excel, Open Refine and Python by Tariq Khokhar.

From the post:

“How can I unpivot or transpose my tabular data so that there’s only one record per row?”

I see this question a lot and I thought it was worth a quick Friday blog post.

Data often aren’t quite in the format that you want. We usually provide CSV / XLS access to our data in “pivoted” or “normalized” form so they look like this:

Manipulating data is at least as crucial a skill to authoring a topic map as being able to model data.

Here are some quick tips for your toolkit.

April 20, 2013

NodeXL HowTo

Filed under: Excel,Graphics,NodeXL,Visualization — Patrick Durusau @ 1:18 pm

Rolling out a “How-To” Software Series

A long preface that ends with a list of posts on “how to” use NodeXL.

Looks very good!

Enjoy!

March 16, 2013

Finding Shakespeare’s Favourite Words With Data Explorer

Filed under: Data Explorer,Data Mining,Excel,Microsoft,Text Mining — Patrick Durusau @ 2:07 pm

Finding Shakespeare’s Favourite Words With Data Explorer by Chris Webb.

From the post:

The more I play with Data Explorer, the more I think my initial assessment of it as a self-service ETL tool was wrong. As Jamie pointed out recently, it’s really the M language with a GUI on top of it and the GUI itself, while good, doesn’t begin to expose the power of the underlying language: I’d urge you to take a look at the Formula Language Specification and Library Specification documents which can be downloaded from here to see for yourself. So while it can certainly be used for self-service ETL it can do much, much more than that…

In this post I’ll show you an example of what Data Explorer can do once you go beyond the UI. Starting off with a text file containing the complete works of William Shakespeare (which can be downloaded from here – it’s strange to think that it’s just a 5.3 MB text file) I’m going to find the top 100 most frequently used words and display them in a table in Excel.

If Data Explorer is a GUI on top of M (outdated but a point of origin), it goes up in importance.

From the M link:

The Microsoft code name “M” Modeling Language, hereinafter referred to as M, is a language for modeling domains using text. A domain is any collection of related concepts or objects. Modeling domain consists of selecting certain characteristics to include in the model and implicitly excluding others deemed irrelevant. Modeling using text has some advantages and disadvantages over modeling using other media such as diagrams or clay. A goal of the M language is to exploit these advantages and mitigate the disadvantages.

A key advantage of modeling in text is ease with which both computers and humans can store and process text. Text is often the most natural way to represent information for presentation and editing by people. However, the ability to extract that information for use by software has been an arcane art practiced only by the most advanced developers. The language feature of M enables information to be represented in a textual form that is tuned for both the problem domain and the target audience. The M language provides simple constructs for describing the shape of a textual language – that shape includes the input syntax as well as the structure and contents of the underlying information. To that end, M acts as both a schema language that can validate that textual input conforms to a given language as well as a transformation language that projects textual input into data structures that are amenable to further processing or storage.

I try to not run examples using Shakespeare. I get distracted by the elegance of the text, which isn’t the point of the exercise. 😉

January 23, 2013

Top 10 Formulas for Aspiring Analysts

Filed under: Data Mining,Excel — Patrick Durusau @ 7:41 pm

Top 10 Formulas for Aspiring Analysts by Purna “Chandoo” Duggirala.

From the post:

Few weeks ago, someone asked me “What are the top 10 formulas?” That got me thinking.

While each of us have our own list of favorite, most frequently used formulas, there is no standard list of top 10 formulas for everyone. So, today let me attempt that.

If you want to become a data or business analyst then you must develop good understanding of Excel formulas & become fluent in them.

A good analyst should be familiar with below 10 formulas to begin with.

A reminder that not all data analysis starts with the most complex chain of transformations you can imagine.

Sometimes you need to explore and then roll out the heavy weapons.

November 19, 2012

Update: TabLinker & UnTabLinker

Filed under: CSV,Excel,RDF,TabLinker/UnTabLinker — Patrick Durusau @ 2:48 pm

Update: TabLinker & UnTabLinker

From the post:

TabLinker, introduced in an earlier post, is a spreadsheet to RDF converter. It takes Excel/CSV files as input, and produces enriched RDF graphs with cell contents, properties and annotations using the DataCube and Open Annotation vocabularies.

TabLinker interprets spreadsheets based on hand-made markup using a small set of predefined styles (e.g. it needs to know what the header cells are). Work package 6 is currently investigating whether and how we can perform this step automatically.

Features:

  • Raw, model-agnostic conversion from spreadsheets to RDF
  • Interactive spreadsheet marking within Excel
  • Automatic annotation recognition and export with OA
  • Round-trip conversion: revive the original spreadsheet files from the produced RDF (UnTabLinker)

Even with conversion tools, the question has to be asked:

What was gained by the conversion? Yes, yes the data is now an RDF graph but what can I do now that I could not do before?

With the caveat that it has to be something I want to do.

August 17, 2012

Marching Hadoop to Windows

Filed under: Excel,Hadoop,Microsoft — Patrick Durusau @ 3:59 pm

Marching Hadoop to Windows

From the post:

Bringing Hadoop to Windows and the two-year development of Hadoop 2.0 are two of the more exciting developments brought up by Hortonworks’s Cofounder and CTO, Eric Baldeschwieler, in a talk before a panel at the Cloud 2012 Conference in Honolulu.

(video omitted)

The panel, which was also attended by Baldeschwieler’s Cloudera counterpart Amr Awadallah, focused on insights into the big data world, a subject Baldeschwieler tackled almost entirely with Hadoop. The eighteen-minute discussion also featured a brief history of Hadoop’s rise to prominence, improvements to be made to Hadoop, and a few tips to enterprising researchers wishing to contribute to Hadoop.

“Bringing Hadoop to Windows,” says Baldeschwieler “turns out to be a very exciting initiative because there are a huge number of users in Windows operating system.” In particular, the Excel spreadsheet program is a popular one for business analysts, something analysts would like to see integrated with Hadoop’s database. That will not be possible until, as Baldeschwieler notes, Windows is integrated into Hadoop later this year, a move that will also considerably expand Hadoop’s reach.

However, that announcement pales in comparison to the possibilities provided by the impending Hadoop 2.0. “Hadoop 2.0 is a pretty major re-write of Hadoop that’s been in the works for two years. It’s now in usable alpha form…The real focus in Hadoop 2.0 is scale and opening it up for more innovation.” Baldeschwieler notes that Hadoop’s rise has been result of what he calls “a happy accident” where it was being developed by his Yahoo team for a specific use case: classifying, sorting, and indexing each of the URLs that were under Yahoo’s scope.

Integration of Excel and Hadoop?

Is that going to be echoes of Unix – The Hole Hawg?

July 23, 2012

XLConnect 0.2-0

Filed under: Data Mining,Excel,R — Patrick Durusau @ 5:59 pm

XLConnect 0.2-0

From the post:

Mirai Solutions GmbH (http://www.mirai-solutions.com) is very pleased to announce the release of XLConnect 0.2-0, which can be found at CRAN.

As one of the updates, XLConnect has moved to the newest release of Apache POI: 3.8. Also, the lazy evaluation issues with S4 generics are now fixed: generic methods now fully expand the argument list in order to have the arguments immediately evaluated.

Furthermore, we have added an XLConnect.R script file to the top level library directory, which contains all code examples presented in the vignette, so that it’s easier to reuse the code.

From an earlier description of XLConnect:

XLConnect is a comprehensive and platform-independent R package for manipulating Microsoft Excel files from within R. XLConnect differs from other related R packages in that it is completely cross-platform and as such runs under Windows, Unix/Linux and Mac (32- and 64-bit). Moreover, it does not require any installation of Microsoft Excel or any other special drivers to be able to read & write Excel files. The only requirement is a recent version of a Java Runtime Environment (JRE). Also, XLConnect can deal with the old *.xls (BIFF) and the new *.xlsx (Office Open XML) file formats. Under the hood, XLConnect uses Apache POI (http://poi.apache.org) – a Java API to manipulate Microsoft Office documents. (From XLConnect – A platform-independent interface to Excel

If you work with data in a business environment, you are going to encounter Excel files. (Assuming you are not in a barter economy counting animal skins and dried fish.)

And customers are going to want you to return Excel files to them. (Yes, yes, topic maps would be a much better delivery format. But if the choice is Excel files, you get paid, topic maps files, you don’t get paid, which one would you do? That’s what I thought.)

A package to consider if you need to manipulate Excel files from within R.

July 18, 2012

Building a Simple BI Solution in Excel 2013 (Part 1 & 2)

Filed under: Business Intelligence,Excel — Patrick Durusau @ 6:39 pm

Chris Webb writes up a quick BI solution in Excel 2013:

Building a Simple BI Solution in Excel 2013, Part 1

and

Building a Simple BI Solution in Excel 2013, Part 2

In the process Chris uncovers some bugs and disappointments, but on the whole the application works.

I mention it for a couple of reasons.

If you recall, something like 75% of the BI market is held by Excel. I don’t expect that to change any time soon.

What do you think happens when “self-service” BI applications are created by users? Other than becoming the default applications for offices and groups in organizations?

Will different users are going to make different choices with their Excel BI applications?

Will users with different Excel BI applications resort to knives, if not guns, to avoid changing their Excel BI applications?

Excel in its many versions leads to varying and inconsistent “self-service” applications in 75% of the BI marketplace.

Is it just me or does that sound like an opportunity for topic maps to you?

July 16, 2012

Data Mining In Excel: Lecture Notes and Cases (2005)

Filed under: Data Mining,Excel,Microsoft — Patrick Durusau @ 3:03 pm

Data Mining In Excel: Lecture Notes and Cases (2005) by Galit Shmueli, Nitin R. Patel, and Peter C. Bruce.

From the introduction:

This book arose out of a data mining course at MIT’s Sloan School of Management. Preparation for the course revealed that there are a number of excellent books on the business context of data mining, but their coverage of the statistical and machine-learning algorithms that underlie data mining is not sufficiently detailed to provide a practical guide if the instructor’s goal is to equip students with the skills and tools to implement those algorithms. On the other hand, there are also a number of more technical books about data mining algorithms, but these are aimed at the statistical researcher, or more advanced graduate student, and do not provide the case-oriented business focus that is successful in teaching business students.

Hence, this book is intended for the business student (and practitioner) of data mining techniques, and its goal is threefold:

  1. To provide both a theoretical and practical understanding of the key methods of classification, prediction, reduction and exploration that are at the heart of data mining;
  2. To provide a business decision-making context for these methods;
  3. Using real business cases, to illustrate the application and interpretation of these methods.

An important feature of this book is the use of Excel, an environment familiar to business analysts. All required data mining algorithms (plus illustrative datasets) are provided in an Excel add-in, XLMiner. XLMiner offers a variety of data mining tools: neural nets, classification and regression trees, k-nearest neighbor classification, naive Bayes, logistic regression, multiple linear regression, and discriminant analysis, all for predictive modeling. It provides for automatic partitioning of data into training, validation and test samples, and for the deployment of the model to new data. It also offers association rules, principal components analysis, k-means clustering and hierarchical clustering, as well as visualization tools, and data handling utilities. With its short learning curve, affordable price, and reliance on the familiar Excel platform, it is an ideal companion to a book on data mining for the business student.

Some what dated but remember there are lots of older copies of MS Office around. Not an inconsiderable market if you start to write something on using Excel to produce topic maps. Write for the latest version but I would have a version keyed to earlier versions of Excel as well.

I first saw this at KDNuggets.

July 10, 2012

Data Mining In Excel: Lecture Notes and Cases

Filed under: Data Mining,Excel — Patrick Durusau @ 7:51 am

Data Mining In Excel: Lecture Notes and Cases by Yanchang Zhao.

Table of contents (270 page book)

  • Overview of the Data Mining Process
  • Data Exploration and Dimension Reduction
  • Evaluating Classification and Predictive Performance
  • Multiple Linear Regression
  • Three Simple Classification Methods
  • Classification and Regression Trees
  • Logistic Regression
  • Neural Nets
  • Discriminant Analysis
  • Association Rules
  • Cluster Analysis

You knew that someday all those Excel files would be useful! 😉 Well, today may be the day!

A bit dated, 2005, but should be a good starting place.

If you are interested in learning data mining in Excel cold, try comparing the then capacities of Excel to the current version of Excel and updating the text/examples.

Best way to learn it is to update and then teach it to others.

June 30, 2012

50 Open Source Replacements for Proprietary Business Intelligence Software

Filed under: Business Intelligence,Excel — Patrick Durusau @ 6:49 pm

50 Open Source Replacements for Proprietary Business Intelligence Software by Cynthia Harvey.

From the post:

In a recent Gartner survey, CIOs picked business intelligence and analytics as their top technology priority for 2012. The market research firm predicts that enterprises will spend more than $12 billion on business intelligence (BI), analytics and performance management software this year alone.

As the market for business intelligence solutions continues to grow, the open source community is responding with a growing number of applications designed to help companies store and analyze key business data. In fact, many of the best tools in the field are available under an open source license. And enterprises that need commercial support or other services will find many options available.

This month, we’ve put together a list of 50 of the top open source business intelligence tools that can replace proprietary solutions. It includes complete business intelligence platforms, data warehouses and databases, data mining and reporting tools, ERP suites with built-in BI capabilities and even spreadsheets. If we’ve overlooked any tools that you feel should be on the list, please feel free to note them in the comments section below.

A very useful listing of “replacements” for proprietary software in part because it includes links to the software to be replaced.

You will find it helpful in identifying software packages with common goals but diverse outputs, grist for topic map mills.

I tried to find a one-page display (print usually works) but you will have to endure the advertising clutter to see the listing.

PS: Remember that MS Excel seventy-five (75%) percent of the BI market. Improve upon/use an MS Excel result, you are closer to a commercially viable product. (BI’s Dirty Secrets – Why Business People are Addicted to Spreadsheets)

March 30, 2012

NodeXL: Network Overview, Discovery and Exploration for Excel

Filed under: Excel,Graphs,Networks,NodeXL — Patrick Durusau @ 4:37 pm

NodeXL: Network Overview, Discovery and Exploration for Excel

From the webpage:

NodeXL is a free, open-source template for Microsoft® Excel® 2007 and 2010 that makes it easy to explore network graphs. With NodeXL, you can enter a network edge list in a worksheet, click a button and see your graph, all in the familiar environment of the Excel window.

NodeXL Features

  • Flexible Import and Export Import and export graphs in GraphML, Pajek, UCINet, and matrix formats.
  • Direct Connections to Social Networks Import social networks directly from Twitter, YouTube, Flickr and email, or use one of several available plug-ins to get networks from Facebook, Exchange and WWW hyperlinks.
  • Zoom and Scale Zoom into areas of interest, and scale the graph’s vertices to reduce clutter.
  • Flexible Layout Use one of several “force-directed” algorithms to lay out the graph, or drag vertices around with the mouse. Have NodeXL move all of the graph’s smaller connected components to the bottom of the graph to focus on what’s important.
  • Easily Adjusted Appearance Set the color, shape, size, label, and opacity of individual vertices by filling in worksheet cells, or let NodeXL do it for you based on vertex attributes such as degree, betweenness centrality or PageRank.
  • Dynamic Filtering Instantly hide vertices and edges using a set of sliders—hide all vertices with degree less than five, for example.
  • Powerful Vertex Grouping Group the graph’s vertices by common attributes, or have NodeXL analyze their connectedness and automatically group them into clusters. Make groups distinguishable using shapes and color, collapse them with a few clicks, or put each group in its own box within the graph. “Bundle” intergroup edges to make them more manageable.
  • Graph Metric Calculations Easily calculate degree, betweenness centrality, closeness centrality, eigenvector centrality, PageRank, clustering coefficient, graph density and more.
  • Task Automation Perform a set of repeated tasks with a single click.

Homepage for NodeXL, which uses Excel as the framework for display and exploration of graphs.

There is something to be said about software that ties itself to other successful software. I think that is “increased chances of success.” Don’t you?

March 21, 2012

Reading Excel data is easy with JGR and XLConnect

Filed under: Data,Excel — Patrick Durusau @ 3:30 pm

Reading Excel data is easy with JGR and XLConnect

From the post:

Despite the fact that Excel is the most widespread application for data manipulation and (perhaps) analysis, R’s support for the xls and xlsx file formats has left a lot to be desired. Fortunately, the XLConnect package has been created to fill this void, and now JGR 1.7-8 includes integration with XLConnect package to load .xls and .xlsx documents into R.

For JGR, see: http://rforge.net/JGR/

March 7, 2012

JavaScript Console and Excel Coming to Hadoop

Filed under: Excel,Hadoop,Javascript — Patrick Durusau @ 5:42 pm

JavaScript Console and Excel Coming to Hadoop

Alex Popescu (myNoSQL) has pointers to news of Hadoop on Windows Azure. Opens Hadoop up to Javascript developers and Excel/PowerPivot users.

Alex captures the winning strategy for new technologies when he says:

Think of integration with familiar tools and frameworks as a huge adoption accelerator.

What would it look like to add configurable merging on PowerPivot? (I may have to get a copy of MS Office 2010.)

Powered by WordPress