Another Word For It Patrick Durusau on Topic Maps and Semantic Diversity

October 4, 2019

rtweet (Collecting Twitter Data)

Filed under: R,Twitter — Patrick Durusau @ 2:18 pm

rtweet

A boat load of features and one of the easiest on-ramps to Twitter I have seen:

All you need is a Twitter account (user name and password) and you can be up in running in minutes!

Simply send a request to Twitter’s API (with a function like search_tweets(), get_timeline(), get_followers(), get_favorites(), etc.) during an interactive session of R, authorize the embedded rstats2twitter app (approve the browser popup), and your token will be created and saved/stored (for future sessions) for you.

Add to that high quality documentation and examples, what more would you ask for?

Not that I think Twitter data is representative for sentiment measures, etc., but that’s not something you need to share with clients who think otherwise. If they are footing the bill, collect and analyze the data that interests them.

July 11, 2019

Rmd first: When development starts with documentation

Filed under: Documentation,R,Requirements — Patrick Durusau @ 3:19 pm

Rmd first: When development starts with documentation by Sébastien Rochette.

Documentation matters ! Think about future you and others. Whatever is the aim of your script and analyses, you should think about documentation. The way I see it, R package structure is made for that. Let me try to convince you.

At use’R 2019 in Toulouse, I did a presentation entitled: ‘The “Rmd first” method: when projects start with documentation’. I ended up saying: Think Package ! If you are really afraid about building a package, you may want to have a look at these slides before. If you are not so afraid, you can start directly with this blog post. In any case, Paco the package should make this more enjoyable ! I hope so…

I’m tilting at windmills at a non-profit which has for decades, developed its IT infrastructure in a topsy-turvy way, with little or no documentation.

It’s very unlikely the no-requirements, no-documentation, no accountability approach of the non-profit will change. It has survived changes in administration and over decades, still, I make the pitch.

My current woes highlight Rochette’s advantages of packages:

Package forces standardized general description of your project

Package forces standardized documentation of functions

Package recommends to show reproducible examples for each function

Package allows integration of user guides (vignettes)

Standardized structure of a package and its check are supposed to conduct to a re-usable code

Whether you are working in R or not, start projects with requirements and documentation.

April 23, 2019

R Graphics Cookbook, 2nd edition

Filed under: Graphics,R — Patrick Durusau @ 3:28 pm

R Graphics Cookbook, 2nd edition by Winston Chang.

From the webpage:

Welcome to the R Graphics Cookbook, a practical guide that provides more than 150 recipes to help you generate high-quality graphs quickly, without having to comb through all the details of R’s graphing systems. Each recipe tackles a specific problem with a solution you can apply to your own project, and includes a discussion of how and why the recipe works.

Read online here for free, or buy a physical copy on Amazon.

Do us all a favor, buy a hard copy of it. It encourages healthy behavior on the part of publishers and it’s easier on your eyes.

Enjoy!

December 6, 2018

Basic Text [Leaked Email] Processing in R

Filed under: R,Text Mining — Patrick Durusau @ 10:08 am

Basic Text Processing in R by Taylor Arnold and Lauren Tilton.

From Learning Goals:

A substantial amount of historical data is now available in the form of raw, digitized text. Common examples include letters, newspaper articles, personal notes, diary entries, legal documents and transcribed speeches. While some stand-alone software applications provide tools for analyzing text data, a programming language offers increased flexibility to analyze a corpus of text documents. In this tutorial we guide users through the basics of text analysis within the R programming language. The approach we take involves only using a tokenizer that parses text into elements such as words, phrases and sentences. By the end of the lesson users will be able to:

  • employ exploratory analyses to check for errors and detect high-level patterns;
  • apply basic stylometric methods over time and across authors;
  • approach document summarization to provide a high-level description of the
    elements in a corpus.

The tutorial uses United States Presidential State of the Union Addresses, yawn, as their dataset.

Great tutorial but aren’t there more interesting datasets to use as examples?

Modulo that I haven’t prepared such a dataset or matched it to a tutorial such as this one.

Question: What would make a more interesting dataset than United States Presidential State of the Union Addresses?

Anything is not a helpful answer.

Suggestions?

August 1, 2018

…R Clients for Web APIs

Filed under: Data Mining,R,Web Applications — Patrick Durusau @ 3:35 pm

Harnessing the Power of the Web via R Clients for Web APIs by Lucy D’Agostino McGowan.

Abstract:

We often want to harness the power of the internet in our daily data practices, i.e., collect data from the internet, share data on the internet, let a dataset evolve on the internet and analyze it periodically, put products up on the internet, etc. While many of these goals can be achieved in a browser via mouse clicks, these practices aren’t very reproducible and they don’t scale, as they are difficult to capture and replicate. Most of what can be done in a browser can also be implemented with code. Web application programing interfaces (APIs) are one tool for facilitating this communication in a reproducible and scriptable way. In this talk we will discuss the general framework of common R clients for web APIs, as well as dive into specific examples. We will focus primarily on the googledrive package, a package that allows the user to control their Google Drive from the comfort of their R console, as well as other common R clients for web APIs, while discussing best practices for efficient and reproducible coding.

The ability to document and replicate acquisition of data is a “best practice,” until you have acquired data you prefer to not be attributed to you. 😉

For cases where the “best practice” obtains, consult McGowan’s slides.

May 8, 2018

Extracting Data From FBI Reports – No Waterboarding Required!

Filed under: FBI,Government,Government Data,R — Patrick Durusau @ 1:01 pm

Wrangling Data Table Out Of the FBI 2017 IC3 Crime Report

From the post:

The U.S. FBI Internet Crime Complaint Center was established in 2000 to receive complaints of Internet crime. They produce an annual report, just released 2017’s edition, and I need the data from it. Since I have to wrangle it out, I thought some folks might like to play long at home, especially since it turns out I had to use both tabulizer and pdftools to accomplish my goal.

Concepts presented:

  • PDF scraping (with both tabulizer and pdftools)
  • asciiruler
  • general string manipulation
  • case_when() vs ifelse() for text cleanup
  • reformatting data for ggraph treemaps

Let’s get started! (NOTE: you can click/tap on any image for a larger version)

Freeing FBI data from a PDF prison, is a public spirited act.

Demonstrating how to free FBI data from PDF prisons, is a virtuous act!

Enjoy!

April 30, 2018

Examining POTUS Executive Orders [Tweets < Executive Orders < Cern Data]

Filed under: Government Data,R,Text Mining,Texts — Patrick Durusau @ 8:12 pm

Examining POTUS Executive Orders by Bob Rudis.

From the post:

This week’s edition of Data is Plural had two really fun data sets. One is serious fun (the first comprehensive data set on U.S. evictions, and the other I knew about but had forgotten: The Federal Register Executive Order (EO) data set(s).

The EO data is also comprehensive as the summary JSON (or CSV) files have links to more metadata and even more links to the full-text in various formats.

What follows is a quick post to help bootstrap folks who may want to do some tidy text mining on this data. We’ll look at EOs-per-year (per-POTUS) and also take a look at the “top 5 ‘first words’” in the titles of the EOS (also by POTUS).

My estimate of the importance of executive orders by American Presidents, “Tweets < Executive Orders < Cern Data,” is only an approximation.

Rudis leaves you plenty of room to experiment with R and processing the text of executive orders.

Enjoy!

April 28, 2018

Mazes For Summer Vacation Trips!

Filed under: Humor,R — Patrick Durusau @ 3:52 pm

On any long vacation road trip, “spot the fascist,” a variation on spotting state license plates, keyed to bumper stickers, can get old. Not to mention it can become repetitious in some states and locales. Very repetitious.

If you convinced your significant other to permit a laptop on the trip, combine some R, maze generation and create entertainment for your fellow travelers!

Before leaving on your trip, check out the mazealls package.

To get you started, there are code illustrations for the following mazes: parallelogram, triangle, hexagon, dodecagon, trapezoid, rhombic dissections, Koch snowflake, Sierpinski triangle, Hexaflake, a dumb looking tree, hex spiral, a rectangle spiral, a double rectangle spiral, and a boustrophedon. The entries for “a dumb looking tree” and following illustrate the use of the pre-defined mazes as primitives.

From the webpage:

Generate mazes recursively via Turtle graphics.

Adjust the complexity and backgrounds of your mazes to be age-appropriate.

Useful even if you are not traveling. Say sitting through congressional hearings (present day) where members of Congress ask about AOL CDs. Working a maze under those circumstances may prevent you from getting dumber. No guarantees.

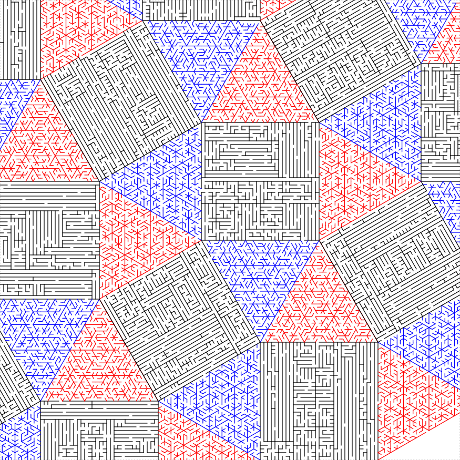
Two examples out of more than fifteen:

Parallelogram:

Composite of maze primitives:

Set an appropriate print scale to have any chance to solve these mazes!

Enjoy!

February 17, 2018

Working with The New York Times API in R

Filed under: Journalism,News,R,Reporting — Patrick Durusau @ 8:49 pm

Working with The New York Times API in R by Jonathan D. Fitzgerald.

From the post:

Have you ever come across a resource that you didn’t know existed, but once you find it you wonder how you ever got along without it? I had this feeling earlier this week when I came across the New York Times API. That’s right, the paper of record allows you–with a little bit of programming skills–to query their entire archive and work with the data. Well, it’s important to note that we don’t get the full text of articles, but we do get a lot of metadata and URLs for each of the articles, which means it’s not impossible to get the full text. But still, this is pretty cool.

So, let’s get started! You’re going to want to head over to http://developer.nytimes.com to get an API Key. While you’re there, check out the selection of APIs on offer–there are over 10, including Article Search, Archive, Books, Comments, Movie Reviews, Top Stories, and more. I’m still digging into each of these myself, so today we’ll focus on Article Search, and I suspect I’ll revisit the NYT API in this space many times going forward. Also at NYT’s developer site, you can use their API Tool feature to try out some queries without writing code. I found this helpful for wrapping my head around the APIs.

A great “getting your feet wet” introduction to the New York Times API in R.

Caution: The line between the New York Times (NYT) and governments is a blurry one. It has cooperated with governments in the past and will do so in the future. If you are betrayed by the NYT, you have no one but yourself to blame.

The same is true for the content of the NYT, past or present. Chance is not the deciding factor on stories being reported in the NYT. It won’t be possible to discern motives in the vast majority of cases but that doesn’t mean they didn’t exist. Treat the “historical” record as carefully as current accounts based on “reliable sources.”

February 8, 2018

OpenStreetMap, R + Revival of Cold War Parades

Filed under: Mapping,OpenStreetMap,R — Patrick Durusau @ 5:26 pm

Cartographic Explorations of the OpenStreetMap Database with R by Timothée Giraud.

From the post:

This post exposes some cartographic explorations of the OpenStreetMap (OSM) database with R.

These explorations begin with the downloading and the cleaning of OSM data. Then I propose a set of map visualizations of the spatial distributions of bars and restaurants in Paris. Of course, these examples could be adapted to other spatial contexts and thematics (e.g. pharmacies in Roma, bike parkings in Dublin…).

This reproducible analysis is hosted on GitHub (code + data + walk-through).

What a timely post! The accidental president of the United States hungers for legitimacy and views a military parade, Cold War style, as a way to achieve that end.

If it weren’t for all those pesky cable news channels, the military could station the reviewing stand in a curve and run the same tanks, same missiles, same troops past the review stand until the president gets bored.

A sensible plan won’t suggest itself to them so expect it to be a more traditional and expensive parade.

Just in case you want to plan other “festivities” at or to intersect with those planned for the president, the data at the OpenStreetMap will prove helpful.

Once the city and parade route becomes known, what questions would you ask of OpenStreetMap data?

January 24, 2018

Visualizing trigrams with the Tidyverse (Who Reads Jane Austen?)

Filed under: Literature,R,Visualization — Patrick Durusau @ 4:41 pm

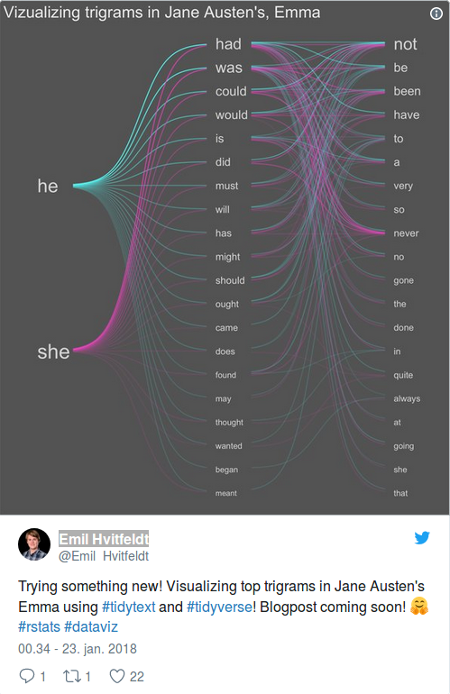
Visualizing trigrams with the Tidyverse by Emil Hvitfeldt.

From the post:

In this post I’ll go though how I created the data visualization I posted yesterday on twitter:

Great post and R code, but who reads Jane Austen? 😉

I have a serious weakness for academic and ancient texts so the Jane Austen question is meant in jest.

The more direct question is to what other texts would you apply this trigram/visualization technique?

Suggestions?

I have some texts in mind but defer mentioning them while I prepare a demonstration of Hvitfeldt’s technique to them.

PS: I ran across an odd comment in the janeaustenr package:

Each text is in a character vector with elements of about 70 characters.

You have to hunt for a bit but 70 characters is the default plain text line length at Gutenberg. Some poor decisions are going to be with us for a very long time.

January 6, 2018

21 Recipes for Mining Twitter Data with rtweet

Filed under: R,Social Media,Tweets,Twitter — Patrick Durusau @ 5:26 pm

21 Recipes for Mining Twitter Data with rtweet by Bob Rudis.

From the preface:

I’m using this as way to familiarize myself with bookdown so I don’t make as many mistakes with my web scraping field guide book.

It’s based on Matthew R. Russell’s book. That book is out of distribution and much of the content is in Matthew’s “Mining the Social Web” book. There will be many similarities between his “21 Recipes” book and this book on purpose. I am not claiming originality in this work, just making an R-centric version of the cookbook.

As he states in his tome, “this intentionally terse recipe collection provides you with 21 easily adaptable Twitter mining recipes”.

Rudis has posted about this editing project at: A bookdown “Hello World” : Twenty-one (minus two) Recipes for Mining Twitter with rtweet, which you should consult if you want to contribute to this project.

Working through 21 Recipes for Mining Twitter Data with rtweet will give you experience proofing a text and if you type in the examples (no cut-n-paste), you’ll develop rtweet muscle memory.

Enjoy!

January 4, 2018

Who’s on everyone’s 2017 “hit list”?

Filed under: R,Web Server — Patrick Durusau @ 8:10 pm

Who’s on everyone’s 2017 “hit list”? by Suzan Baert.

From the post:

At the end of the year, everyone is making lists. And radio stations are no exceptions.
Many of our radio stations have a weekly “people’s choice” music chart. Throughout the week, people submit their top 3 recent songs, and every week those votes turn into a music chart. At the end of the year, they collapse all those weekly charts into a larger one covering the entire year.

I find this one quite interesting: it’s not dependent on what music people buy, it’s determined by what the audience of that station wants to hear. So what are the differences between these stations? And do they match up with what I would expect?

What was also quite intriguing: in Dutch we call it a hit lijst and if you translate that word for word you get: hit list. Which at least one radio station seems to do…

Personally, when I hear the word hit list, music is not really what comes to mind, but hey, let’s roll with it: which artists are on everyone’s ‘hit list’?

A delightful scraping of four (4) radio station “hit lists,” which uses rOpenSci robotstxt, rvest, xml2, dplyr, tidyr, ggplot2, phantomJS, and collates the results.

Music doesn’t come to mind for me when I hear “hit list.”

For me “hit list” means what Google wasn’t you to know about subject N.

You?

December 27, 2017

Game of Thrones DVDs for Christmas?

Filed under: R,Text Mining — Patrick Durusau @ 10:40 am

Mining Game of Thrones Scripts with R by Gokhan Ciflikli

If you are serious about defeating all comers to Game of Thrones trivia, then you need to know the scripts cold. (sorry)

Ciflikli introduces you to the quanteda and analysis of the Game of Thrones scripts in a single post saying:

I meant to showcase the quanteda package in my previous post on the Weinstein Effect but had to switch to tidytext at the last minute. Today I will make good on that promise. quanteda is developed by Ken Benoit and maintained by Kohei Watanabe – go LSE! On that note, the first 2018 LondonR meeting will be taking place at the LSE on January 16, so do drop by if you happen to be around. quanteda v1.0 will be unveiled there as well.

Given that I have already used the data I had in mind, I have been trying to identify another interesting (and hopefully less depressing) dataset for this particular calling. Then it snowed in London, and the dire consequences of this supernatural phenomenon were covered extensively by the r/CasualUK/. One thing led to another, and before you know it I was analysing Game of Thrones scripts:

2018, with its mid-term congressional elections, will be a big year for leaked emails, documents, in addition to the usual follies of government.

Text mining/analysis skills you gain with the Game of Thrones scripts will be in high demand by partisans, investigators, prosecutors, just about anyone you can name.

From the quanteda documentation site:


quanteda is principally designed to allow users a fast and convenient method to go from a corpus of texts to a selected matrix of documents by features, after defining what the documents and features. The package makes it easy to redefine documents, for instance by splitting them into sentences or paragraphs, or by tags, as well as to group them into larger documents by document variables, or to subset them based on logical conditions or combinations of document variables. The package also implements common NLP feature selection functions, such as removing stopwords and stemming in numerous languages, selecting words found in dictionaries, treating words as equivalent based on a user-defined “thesaurus”, and trimming and weighting features based on document frequency, feature frequency, and related measures such as tf-idf.
… (emphasis in original)

Once you follow the analysis of the Game of Thrones scripts, what other texts or features of quanteda will catch your eye?

Enjoy!

December 26, 2017

Geocomputation with R – Open Book in Progress – Contribute

Filed under: Geographic Data,Geography,Geospatial Data,R — Patrick Durusau @ 8:57 pm

Geocomputation with R by Robin Lovelace, Jakub Nowosad, Jannes Muenchow.

Welcome to the online home of Geocomputation with R, a forthcoming book with CRC Press.

Development

p>Inspired by bookdown and other open source projects we are developing this book in the open. Why? To encourage contributions, ensure reproducibility and provide access to the material as it evolves.

The book’s development can be divided into four main phases:

  1. Foundations
  2. Basic applications
  3. Geocomputation methods
  4. Advanced applications

Currently the focus is on Part 2, which we aim to be complete by December. New chapters will be added to this website as the project progresses, hosted at geocompr.robinlovelace.net and kept up-to-date thanks to Travis….

Speaking of R and geocomputation, I’ve been trying to remember to post about Geocomputation with R since I encountered it a week or more ago. Not what I expect from CRC Press. That got my attention right away!

Part II, Basic Applications has two chapters, 7 Location analysis and 8 Transport applications.

Layering display of data from different sources should be included under Basic Applications. For example, relying on but not displaying topographic data to calculate line of sight between positions. Perhaps the base display is a high-resolution image overlaid with GPS coordinates at intervals and structures have the line of site colored on their structures.

Other “basic applications” you would suggest?

Looking forward to progress on this volume!

All targets have spatial-temporal locations.

Filed under: Geographic Data,Geography,Geophysical,Geospatial Data,R,Spatial Data — Patrick Durusau @ 5:29 pm

r-spatial

From the about page:

r-spatial.org is a website and blog for those interested in using R to analyse spatial or spatio-temporal data.

Posts in the last six months to whet your appetite for this blog:

The budget of a government for spatial-temporal software is no indicator of skill with spatial and spatial-temporal data.

How are yours?

December 21, 2017

Learn to Write Command Line Utilities in R

Filed under: Programming,R — Patrick Durusau @ 7:58 pm

Learn to Write Command Line Utilities in R by Mark Sellors.

From the post:

Do you know some R? Have you ever wanted to write your own command line utilities, but didn’t know where to start? Do you like Harry Potter?

If the answer to these questions is “Yes!”, then you’ve come to the right place. If the answer is “No”, but you have some free time, stick around anyway, it might be fun!

Sellors invokes the tradition of *nix command line tools saying: “The thing that most [command line] tools have in common is that they do a small number of things really well.”

The question to you is: What small things do you want to do really well?

December 14, 2017

Spatial Microsimulation with R – Public Policy Advocates Take Note

Filed under: Environment,R,Simulations — Patrick Durusau @ 11:28 am

Spatial Microsimulation with R by Robin Lovelace and Morgane Dumont.

Apologies for the long quote below but spatial microsimulation is unfamiliar enough that it merited an introduction in the authors’ own prose.

We have all attended public meetings where developers, polluters, landfill operators, etc., had charts, studies, etc., and the public was armed with, well, its opinions.

Spatial Microsimulation with R can put you in a position to offer alternative analysis, meaningfully ask for data used in other studies, in short, arm yourself with weapons long abused in public policy discussions.

From Chapter 1, 1.2 Motivations:


Imagine a world in which data on companies, households and governments were widely available. Imagine, further, that researchers and decision-makers acting in the public interest had tools enabling them to test and model such data to explore different scenarios of the future. People would be able to make more informed decisions, based on the best available evidence. In this technocratic dreamland pressing problems such as climate change, inequality and poor human health could be solved.

These are the types of real-world issues that we hope the methods in this book will help to address. Spatial microsimulation can provide new insights into complex problems and, ultimately, lead to better decision-making. By shedding new light on existing information, the methods can help shift decision-making processes away from ideological bias and towards evidence-based policy.

The ‘open data’ movement has made many datasets more widely available. However, the dream sketched in the opening paragraph is still far from reality. Researchers typically must work with data that is incomplete or inaccessible. Available datasets often lack the spatial or temporal resolution required to understand complex processes. Publicly available datasets frequently miss key attributes, such as income. Even when high quality data is made available, it can be very difficult for others to check or reproduce results based on them. Strict conditions inhibiting data access and use are aimed at protecting citizen privacy but can also serve to block democratic and enlightened decision making.

The empowering potential of new information is encapsulated in the saying that ‘knowledge is power’. This helps explain why methods such as spatial microsimulation, that help represent the full complexity of reality, are in high demand.

Spatial microsimulation is a growing approach to studying complex issues in the social sciences. It has been used extensively in fields as diverse as transport, health and education (see Chapter ), and many more applications are possible. Fundamental to the approach are approximations of individual level data at high spatial resolution: people allocated to places. This spatial microdata, in one form or another, provides the basis for all spatial microsimulation research.

The purpose of this book is to teach methods for doing (not reading about!) spatial microsimulation. This involves techniques for generating and analysing spatial microdata to get the ‘best of both worlds’ from real individual and geographically-aggregated data. Population synthesis is therefore a key stage in spatial microsimulation: generally real spatial microdata are unavailable due to concerns over data privacy. Typically, synthetic spatial microdatasets are generated by combining aggregated outputs from Census results with individual level data (with little or no geographical information) from surveys that are representative of the population of interest.

The resulting spatial microdata are useful in many situations where individual level and geographically specific processes are in operation. Spatial microsimulation enables modelling and analysis on multiple levels. Spatial microsimulation also overlaps with (and provides useful initial conditions for) agent-based models (see Chapter 12).

Despite its utility, spatial microsimulation is little known outside the fields of human geography and regional science. The methods taught in this book have the potential to be useful in a wide range of applications. Spatial microsimulation has great potential to be applied to new areas for informing public policy. Work of great potential social benefit is already being done using spatial microsimulation in housing, transport and sustainable urban planning. Detailed modelling will clearly be of use for planning for a post-carbon future, one in which we stop burning fossil fuels.

For these reasons there is growing interest in spatial microsimulation. This is due largely to its practical utility in an era of ‘evidence-based policy’ but is also driven by changes in the wider research environment inside and outside of academia. Continued improvements in computers, software and data availability mean the methods are more accessible than ever. It is now possible to simulate the populations of small administrative areas at the individual level almost anywhere in the world. This opens new possibilities for a range of applications, not least policy evaluation.

Still, the meaning of spatial microsimulation is ambiguous for many. This book also aims to clarify what the method entails in practice. Ambiguity surrounding the term seems to arise partly because the methods are inherently complex, operating at multiple levels, and partly due to researchers themselves. Some uses of the term ‘spatial microsimulation’ in the academic literature are unclear as to its meaning; there is much inconsistency about what it means. Worse is work that treats spatial microsimulation as a magical black box that just ‘works’ without any need to describe, or more importantly make reproducible, the methods underlying the black box. This book is therefore also about demystifying spatial microsimulation.

If that wasn’t impressive enough, the authors:


We’ve put Spatial Microsimulation with R on-line because we want to reduce barriers to learning. We’ve made it open source via a GitHub repository because we believe in reproducibility and collaboration. Comments and suggests are most welcome there. If the content of the book helps your research, please cite it (Lovelace and Dumont, 2016).

How awesome is that!

Definitely a model for all of us to emulate!

December 12, 2017

Connecting R to Keras and TensorFlow

Filed under: Deep Learning,R,TensorFlow — Patrick Durusau @ 7:42 pm

Connecting R to Keras and TensorFlow by Joseph Rickert.

From the post:

It has always been the mission of R developers to connect R to the “good stuff”. As John Chambers puts it in his book Extending R:

One of the attractions of R has always been the ability to compute an interesting result quickly. A key motivation for the original S remains as important now: to give easy access to the best computations for understanding data.

From the day it was announced a little over two years ago, it was clear that Google’s TensorFlow platform for Deep Learning is good stuff. This September (see announcment), J.J. Allaire, François Chollet, and the other authors of the keras package delivered on R’s “easy access to the best” mission in a big way. Data scientists can now build very sophisticated Deep Learning models from an R session while maintaining the flow that R users expect. The strategy that made this happen seems to have been straightforward. But, the smooth experience of using the Keras API indicates inspired programming all the way along the chain from TensorFlow to R.

The Redditor deepfakes, of AI-Assisted Fake Porn fame mentions Keras as one of his tools. Is that an endorsement?

Rickert’s post is a quick start to Keras and Tensorflow but he does mention:

the MEAP from the forthcoming Manning Book, Deep Learning with R by François Chollet, the creator of Keras, and J.J. Allaire.

I’ve had good luck with Manning books in general so am looking forward to this one as well.

December 9, 2017

Introducing Data360R — data to the power of R [On Having an Agenda]

Filed under: Open Data,R — Patrick Durusau @ 9:06 pm

Introducing Data360R — data to the power of R

From the post:

Last January 2017, the World Bank launched TCdata360 (tcdata360.worldbank.org/), a new open data platform that features more than 2,000 trade and competitiveness indicators from 40+ data sources inside and outside the World Bank Group. Users of the website can compare countries, download raw data, create and share data visualizations on social media, get country snapshots and thematic reports, read data stories, connect through an application programming interface (API), and more.

The response to the site has been overwhelmingly enthusiastic, and this growing user base continually inspires us to develop better tools to increase data accessibility and usability. After all, open data isn’t useful unless it’s accessed and used for actionable insights.

One such tool we recently developed is data360r, an R package that allows users to interact with the TCdata360 API and query TCdata360 data, metadata, and more using easy, single-line functions.

So long as you remember the World Bank has an agenda and all the data it releases serves that agenda, you should suffer no permanent harm.

Don’t take that as meaning other sources of data have less of an agenda, although you may find their agendas differ from that of the World Bank.

The recent “discovery” that machine learning algorithms can conceal social or racist bias, was long overdue.

Anyone who took survey work in social science methodology in the last half of the 20th century would report that data collection itself, much less its processing, is fraught with unavoidable bias.

It is certainly possible, in the physical sense, to give students standardized tests, but what test results mean for any given question, such as teacher competence, is far from clear.

Or to put it differently, just because something can be measured is no guarantee the measurement is meaningful. The same applied to the data that results from any measurement process.

Take advantage of data360r certainly, but keep a wary eye on data from any source.

December 5, 2017

Building a Telecom Dictionary scraping web using rvest in R [Tunable Transparency]

Filed under: Dictionary,R,Web Scrapers — Patrick Durusau @ 8:04 pm

Building a Telecom Dictionary scraping web using rvest in R by Abdul Majed Raja.

From the post:

One of the biggest problems in Business to carry out any analysis is the availability of Data. That is where in many cases, Web Scraping comes very handy in creating that data that’s required. Consider the following case: To perform text analysis on Textual Data collected in a Telecom Company as part of Customer Feedback or Reviews, primarily requires a dictionary of Telecom Keywords. But such a dictionary is hard to find out-of-box. Hence as an Analyst, the most obvious thing to do when such dictionary doesn’t exist is to build one. Hence this article aims to help beginners get started with web scraping with rvest in R and at the same time, building a Telecom Dictionary by the end of this exercise.

Great for scraping an existing glossary but as always, it isn’t possible to extract information that isn’t captured by the original glossary.

Things like the scope of applicability for the terms, language, author, organization, even characteristics of the subjects the terms represent.

Of course, if your department invested in collecting that information for every subject in the glossary, there is no external requirement that on export all that information be included.

That is your “data silo” can have tunable transparency, that is you enable others to use your data with as much or as least semantic friction as the situation merits.

For some data borrowers, they get opaque spreadsheet field names, column1, column2, etc.

Other data borrowers, perhaps those willing to help defray the cost of semantic annotation, well, they get a more transparent view of the data.

One possible method of making semantic annotation and its maintenance a revenue center as opposed to a cost one.

Australian Census Data and Same Sex Marriage

Filed under: Census Data,R — Patrick Durusau @ 5:59 pm

Combining Australian Census data with the Same Sex Marriage Postal Survey in R by Miles McBain.

Last week I put out a post that showed you how to tidy the Same Sex Marriage Postal Survey Data in R. In this post we’ll visualise that data in combination with the 2016 Australian Census. Note to people just here for the R — the main challenge here is actually just navigating the ABS’s Census DataPack, but I’ve tried to include a few pearls of wisdom on joining datasets to keep things interesting for you.

Decoding the “datapack” is an early task:


The datapack consists of 59 encoded csv files and 3 metadata excel files that will help us decode their meaning. What? You didn’t think this was going to be straight forward did you?

When I say encoded, I mean the csv’s have inscrutable names like ‘2016Census_G09C.csv’ and contain column names like ‘Se_d_r_or_t_h_t_Tot_NofB_0_ib’ (H.T. @hughparsonage).

Two of the metadata files in /Metadata/ have useful applications for us. ‘2016Census_geog_desc_1st_and_2nd_release.xlsx’ will help us resolve encoded geographic areas to federal electorate names. ‘Metadata_2016_GCP_DataPack.xlsx’ lists the topics of each of the 59 tables and will allow us to replace a short and uninformative column name with a much longer, and slightly more informative name….

Followed by the joys of joining and analyzing the data sets.

McBain develops original analysis of the data that demonstrates a relationship between having children and opinions on the impact of same sex marriage on children.

No, I won’t repeat his insight. Read his post, it’s quite entertaining.

Name a bitch badder than Taylor Swift

Filed under: Feminism,R,Twitter — Patrick Durusau @ 4:27 pm

It all began innocently enough, a tweet with this image and title by Nutella.

Maëlle Salmon reports in Names of b…..s badder than Taylor Swift, a class in women’s studies? that her first pass on tweets quoting Nutella’s tweet, netted 15,653 tweets! (Salmon posted on 05 December 2017 so a later tweet count will be higher.)

Salmon uses rtweet to obtain the tweets, cleanNLP to extract entities, and then enhances those entities with Wikidata.

There’s a lot going on in this one post!

Enjoy the post and remember to follow Maëlle Salmon on Twitter!

Other value-adds for this data set?

November 30, 2017

Over Thinking Secret Santa ;-)

Filed under: Graphs,R — Patrick Durusau @ 10:27 am

Secret Santa is a graph traversal problem by Tristan Mahr.

From the post:

Last week at Thanksgiving, my family drew names from a hat for our annual game of Secret Santa. Actually, it wasn’t a hat but you know what I mean. (Now that I think about it, I don’t think I’ve ever seen names drawn from a literal hat before!) In our family, the rules of Secret Santa are pretty simple:

  • The players’ names are put in “a hat”.
  • Players randomly draw a name from a hat, become that person’s Secret Santa, and get them a gift.
  • If a player draws their own name, they draw again.

Once again this year, somebody asked if we could just use an app or a website to handle the drawing for Secret Santa. Or I could write a script to do it I thought to myself. The problem nagged at the back of my mind for the past few days. You could just shuffle the names… no, no, no. It’s trickier than that.

In this post, I describe a couple of algorithms for Secret Santa sampling using R and directed graphs. I use the DiagrammeR package which creates graphs from dataframes of nodes and edges, and I liberally use dplyr verbs to manipulate tables of edges.

If you would like a more practical way to use R for Secret Santa, including automating the process of drawing names and emailing players, see this blog post.

If you haven’t done your family Secret Santa yet, you are almost late! (November 30, 2017)

Enjoy!

November 15, 2017

A Docker tutorial for reproducible research [Reproducible Reporting In The Future?]

Filed under: R,Replication,Reporting,Science — Patrick Durusau @ 10:07 am

R Docker tutorial: A Docker tutorial for reproducible research.

From the webpage:

This is an introduction to Docker designed for participants with knowledge about R and RStudio. The introduction is intended to be helping people who need Docker for a project. We first explain what Docker is and why it is useful. Then we go into the the details on how to use it for a reproducible transportable project.

Six lessons, instructions for installing Docker, plus zip/tar ball of the materials. What more could you want?

Science has paid lip service to the idea of replication of results for centuries but with the sharing of data and analysis, reproducible research is becoming a reality.

Is reproducible reporting in the near future? Reporters preparing their analysis and releasing raw data and their extraction methods?

Or will selective releases of data, when raw data is released at all, continue to be the norm?

Please let @ICIJorg know how you feel about data hoarding, #ParadisePapers, #PanamaPapers, when data and code sharing are becoming the norm in science.

November 6, 2017

Data Munging with R (MEAP)

Filed under: Data Science,R — Patrick Durusau @ 2:21 pm

Data Munging with R (MEAP) by Dr. Jonathan Carroll.

From the description:

Data Munging with R shows you how to take raw data and transform it for use in computations, tables, graphs, and more. Whether you already have some programming experience or you’re just a spreadsheet whiz looking for a more powerful data manipulation tool, this book will help you get started. You’ll discover the ins and outs of using the data-oriented R programming language and its many task-specific packages. With dozens of practical examples to follow, learn to fill in missing values, make predictions, and visualize data as graphs. By the time you’re done, you’ll be a master munger, with a robust, reproducible workflow and the skills to use data to strengthen your conclusions!

Five (5) out of eleven (11) parts available now under the Manning Early Access Program (MEAP). Chapter one, Introducing Data and the R Language is free.

Even though everyone writes books from front to back (or at least claim to), it would be nice to see a free “advanced” chapter every now and again. There’s not much you can say about an introductory chapter other than it’s an introductory chapter. That’s no different here.

I suspect you will get a better idea about Dr. Carroll’s writing from his blog, Irregularly Scheduled Programming or by following him on Twitter: @carroll_jono.

October 13, 2017

A cRyptic crossword with an R twist

Filed under: Games,Humor,R — Patrick Durusau @ 3:14 pm

A cRyptic crossword with an R twist

From the post:

Last week’s R-themed crossword from R-Ladies DC was popular, so here’s another R-related crossword, this time by Barry Rowlingson and published on page 39 of the June 2003 issue of R-news (now known as the R Journal). Unlike the last crossword, this one follows the conventions of a British cryptic crossword: the grid is symmetrical, and eschews 4×4 blocks of white or black squares. Most importantly, the clues are in the cryptic style: rather than being a direct definition, cryptic clues pair wordplay (homonyms, anagrams, etc) with a hidden definition. (Wikipedia has a good introduction to the types of clues you’re likely to find.) Cryptic crosswords can be frustrating for the uninitiated, but are fun and rewarding once you get to into it.

In fact, if you’re unfamiliar with cryptic crosswords, this one is a great place to start. Not only are many (but not all) of the answers related in some way to R, Barry has helpfully provided the answers along with an explanation of how the cryptic clue was formed. There’s no shame in peeking, at least for a few, to help you get your legs with the cryptic style.

Another R crossword for your weekend enjoyment!

Enjoy!

October 6, 2017

A cRossword about R [Alternative to the NYTimes Sunday Crossword Puzzle]

Filed under: Crossword Puzzle,R — Patrick Durusau @ 8:25 pm

A cRossword about R by David Smith.

From the post:

The members of the R Ladies DC user group put together an R-themed crossword for a recent networking event. It’s a fun way to test out your R knowledge. (Click to enlarge, or download a printable version here.)

Maybe not a complete alternative to the NYTimes Sunday Crossword Puzzle but R enthusiasts will enjoy it.

I suspect the exercise of writing a crossword puzzle is a greater learning experience than solving it.

Thoughts?

September 26, 2017

Exploratory Data Analysis of Tropical Storms in R

Filed under: Programming,R,Weather Data — Patrick Durusau @ 7:52 pm

Exploratory Data Analysis of Tropical Storms in R by Scott Stoltzman.

From the post:

The disastrous impact of recent hurricanes, Harvey and Irma, generated a large influx of data within the online community. I was curious about the history of hurricanes and tropical storms so I found a data set on data.world and started some basic Exploratory data analysis (EDA).

EDA is crucial to starting any project. Through EDA you can start to identify errors & inconsistencies in your data, find interesting patterns, see correlations and start to develop hypotheses to test. For most people, basic spreadsheets and charts are handy and provide a great place to start. They are an easy-to-use method to manipulate and visualize your data quickly. Data scientists may cringe at the idea of using a graphical user interface (GUI) to kick-off the EDA process but those tools are very effective and efficient when used properly. However, if you’re reading this, you’re probably trying to take EDA to the next level. The best way to learn is to get your hands dirty, let’s get started.

The original source of the data was can be found at DHS.gov.

Great walk through on exploratory data analysis.

Everyone talks about the weather but did you know there is a forty (40) year climate lag between cause and effect?

The human impact on the environment today, won’t be felt for another forty (40) years.

Can to predict the impact of a hurricane in 2057?

Some other data/analysis resources on hurricanes, Climate Prediction Center, Hurricane Forecast Computer Models, National Hurricane Center.

PS: Is a Category 6 Hurricane Possible? by Brian Donegan is an interesting discussion on going beyond category 5 for hurricanes. For reference on speeds, see: Fujita Scale (tornadoes).

September 18, 2017

RStartHere

Filed under: Programming,R — Patrick Durusau @ 4:42 pm

RStartHere by Garrett Grolemund.

R packages organized by their role in data science:

This is very cool! Use and share!

Older Posts »

Powered by WordPress