Another Word For It Patrick Durusau on Topic Maps and Semantic Diversity

August 22, 2018

Battle of Impressively Bad Military Graphics

Filed under: Communication,Graphics,Visualization — Patrick Durusau @ 3:32 pm

Cav The Knife started a thread on Twitter with this image:

The original can be found in Joint Intelligence Preparation of the Operational Environment, page I-3.

Rob Levinson counters with:

The original can be found in Dynamic Planning for COIN in Afghanistan at page 22. The slide deck includes numerous other offenses against the art of explanation and visualization.

The contest is somewhat unfair because the Joint Intelligence graphic was composed by military lifers versus the COIN in Afghanistan, created by professionals at PA Consulting Group.

For my money, COIN in Afghanistan takes the prize in this comparison as the worst graphic, but Joint Intelligence should get a “best in amateur class” mention.

Other contestants?

January 11, 2018

The David Attenborough Style of Scientific Presentation (Historic First for Balisage?)

Filed under: Communication,Conferences,Presentation — Patrick Durusau @ 4:17 pm

The David Attenborough Style of Scientific Presentation by Will Ratcliff.

From the post:

One of the biggest hurdles to giving a good talk is convincing people that it’s worth their mental energy to listen to you. This approach to speaking is designed to get that buy-in from the audience, without them even realizing they are doing so. The key to this is exploitation of a simple fact: people are curious creatures by nature and will pay attention to a cool story as long as that story remains absolutely clear.

In the D.A. style of speaking, you are the narrator of an interesting story. The goal is to have a visually streamlined talk where the audience is so engaged with your presentation that they forget you’re standing in front of them speaking. Instead, they’re listening to your narrative and seeing the visuals that accompany your story, at no point do they have to stop and try to make sense of what you just said.

A captivating two (2) page summary of the David Attenborough (DA) style for presentations, but at first, since I don’t travel any longer, I wasn’t going to mention it.

On a second or third read, the blindingly obvious hit me:

Rules that work for live conference presentations, also work for video podcasts, lectures, client presentations, anywhere you are seeking to effectively communicate to others. (I guess that rules out White House press briefings.)

Paper submission dates aren’t out yet for Balisage 2018 but your use of DA style for your presentation would be a historic first, so far as I know. 😉

No promises but a video in “normal” style with the same presentation in DA style, for the same presentation, could be an interesting data point.

February 13, 2017

How to Listen Better [Not Just For Reporters]

Filed under: Communication,Journalism,News,Reporting — Patrick Durusau @ 9:42 pm

How to Listen Better by Josh Stearns.

From the post:

In my weekly newsletter, The Local Fix, I compiled a list of guides, tools, and examples of how newsrooms can listen more deeply to local communities. I’m sharing it here in case it can be useful to others, and to encourage people to add to the list.

See which of Josh’s resources resonate with you.

These resources are in the context of news/reporting but developing good listening skills is an asset in any field.

Here’s a free tip since you are likely sitting in front of your computer monitor:

If someone comes to talk to you, turn away from your monitor and pay attention to the person speaking.

Seriously, try that for a week and see if your communication with co-workers improves.

PS: Do read posts before you tweet responses to them. As they say, “reading is fundamental.”

June 25, 2016

The Science of Scientific Writing

Filed under: Communication,Writing — Patrick Durusau @ 4:23 pm

The Science of Scientific Writing by George D. Gopen and Judith A. Swan.

From the paper:

Science is often hard to read. Most people assume that its difficulties are born out of necessity, out of the extreme complexity of scientific concepts, data and analysis. We argue here that complexity of thought need not lead to impenetrability of expression; we demonstrate a number of rhetorical principles that can produce clarity in communication without oversimplifying scientific issues. The results are substantive, not merely cosmetic: Improving the quality of writing actually improves the quality of thought.

The fundamental purpose of scientific discourse is not the mere presentation of information and thought, but rather its actual communication. It does not matter how pleased an author might be to have converted all the right data into sentences and paragraphs; it matters only whether a large majority of the reading audience accurately perceives what the author had in mind. Therefore, in order to understand how best to improve writing, we would do well to understand better how readers go about reading. Such an understanding has recently become available through work done in the fields of rhetoric, linguistics and cognitive psychology. It has helped to produce a methodology based on the concept of reader expectations.

What? Evidence-based authoring? Isn’t that like evidence-based interface design?

Trying to communicate with readers on their own terms and not forcing them to tough it out?

Next thing you know, Gopen will be saying that failures to communicate in writing, are the author’s fault!

Wait!

He does:


On first reading, however, many of us arrive at the paragraph’s end without a clear sense of where we have been or where we are going. When that happens, we tend to berate ourselves for not having paid close enough attention. In reality, the fault lies not with us, but with the author. (page 9 of the pdf)

“The Science of Scientific Writing” is a great authoring by example guide.

Spending time with it can only make you a better writer.

You will be disappointed if you try to find this item from the bibliography:

Gopen, George D. 1990. The Common Sense of Writing: Teaching Writing from the Reader’s Perspective. To be published.

Worldcat.org reports one (1) copy of The Common Sense of Writing: Teaching Writing from the Reader’s Perspective is held by the Seattle University
Law Library. Good luck!

I located an interview with Dr. Gopen, which identifies these two very similar volumes:

Expectations: Teaching Writing from the Reader’s Perspective by George D. Gopen, ISBN-13: 978-0205296170, at 416 pages, 2004. (The complete story.)

The Sense of Structure: Writing from the Reader’s Perspective by George D. Gopen, ISBN-13: 978-0205296323, at 256 pages, 2004. (A textbook based on “Expectations….”)

Neither volume is cheap but when I do order, I’m going for Expectations: Teaching Writing from the Reader’s Perspective.

In the mean time, there’s enough poor writing on the Internet to keep me practicing the lessons of The Science of Scientific Writing for the foreseeable future.

March 5, 2016

4 [5] ways to misinterpret your measurement

Filed under: Communication,Measurement — Patrick Durusau @ 4:07 pm

4 ways to misinterpret your measurement by Katie Paine.

I mention this primarily because of the great graphic and a fifth way to misinterpret data that Katie doesn’t mention.

messages-mom

The misinterpretations Katie mentions are important and see her post for those.

The graphic, on the other hand, illustrates misinterpretation by not understanding the data.

The use of English, integers, etc., provides no assurances you will “understand” the data.

Not “understanding” the data, you are almost certain to misinterpret it.

I first saw this in a tweet by Kirk Borne.

January 31, 2015

Effective Communication with Colleagues, the Public, Students and Users

Filed under: Communication,Teaching — Patrick Durusau @ 4:55 pm

I chose the tile of this post as a replacement for: Synthesis of the Value and Benefits of SoTL (Scholarship of Teaching and Learning)Experienced by the Contributors. I know, it’s hard to get past the title but if you do, Rick Reis advises:

The posting below is Chapter 20 of the book, Doing the Scholarship of Teaching and Learning (SoTL) in Mathematics. It has implications well beyond the teaching of mathematics and represents the synthesis of the editors, Jacqueline Dewar and Curtis Bennett of Loyola Marymount University, of the contributing authors’ perceptions of the value of SoTL. In it, they reinterpret Shulman’s (1999) “taxonomy of pedago-pathology” consisting of amnesia, fantasia, and inertia, which he had used to describe pitfalls of student learning, to show how the same 3 labels can describe pathologies of teaching, and then discuss how SoTL can operate as an antidote for these. Dewar, J., & Bennett, C. (Eds.). (2015). Doing the scholarship of teaching and learning in mathematics. Washington, DC: Mathematical Association of America. Copyright © 2015. Mathematical Association of America. (http://www.maa.org/publications/ebooks/doing-the-scholarship-of-teaching-and-learning-in-mathematics). All rights reserved. Reprinted with permission.

The triple, “amnesia, fantasia, and inertia” originally were references to:

  • Amnesia – inability of students to remember what they have learned
  • Fantasia – remembering of incorrect information by students
  • Inertia – student’s inability to apply what they have learned

The essays turn the tables on professors who teach classes where:

  • Amnesia – inability of a professor to remember what worked or what didn’t in prior courses
  • Fantasia – relying on assumptions about students rather than exploring why they haven’t mastered material
  • Inertia – teaching classes the same way, even though prior students failed to master the materials

I can see that triple, “amnesia, fantasia, and inertia” in the treatment of users:

  • Amnesia – inability to remember what has worked in the past for users
  • Fantasia – no user testing of UI and/or documentation, “just not trying hard enough.”
  • Inertia – writing poor or no documentation, “this time will be different”

I suppose the inertia part is also a reference to how we all take every opportunity to be lazy if at all possible.

I am sure the techniques for SoTL aren’t directly transferable to CS in academia or in practice but every nudge in a better direction helps.

The MAA page offers this description:

The four chapters in Part I provide background on this form of scholarship and specific instructions for undertaking a SoTL investigation in mathematics. Part II contains fifteen examples of SoTL projects in mathematics from fourteen different institutions, both public and private, spanning the spectrum of higher educational institutions from community colleges to research universities. These chapters “reveal the process of doing SoTL” by illustrating many of the concepts, issues, methods and procedures discussed in Part I. An Editors’ Commentary opens each contributed chapter to highlight one or more aspects of the process of doing SoTL revealed within. Toward the end of each chapter the contributing authors describe the benefits that accrued to them and their careers from participating in SoTL.

In PDF it is only $23.00 and appears to be worth every penny of it.

December 27, 2014

Accidental vs Deliberate Context

Filed under: Communication,Communities of Practice,Context,Diversity,Topic Maps — Patrick Durusau @ 2:16 pm

Accidental vs Deliberate Context by Jessica Kerr.

From the post:

In all decisions, we bring our context with us. Layers of context, from what we read about that morning to who our heroes were growing up. We don’t realize how much context we assume in our communications, and in our code.

One time I taught someone how to make the Baby Vampire face. It involves poking out both corners of my lower lip, so they stick up like poky gums. Very silly. To my surprise, the person couldn’t do it. They could only poke one side of the lower lip out at a time.

Hotel-Transylvania-Castle-1280x1024-Wallpaper-ToonsWallpapers.com-

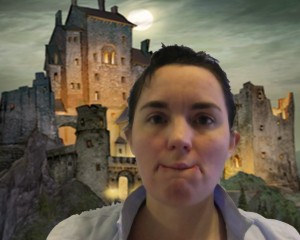
Turns out, few outside my family can make this face. My mom can do it, my sister can do it, my daughters can do it – so it came as a complete surprise to me when someone couldn’t. There is a lip-flexibility that’s part of my context, always has been, and I didn’t even realize it.

Jessica goes on to illustrate that communication depends upon the existence of some degree of shared context and that additional context can be explained to others, as on a team.

She distinguishes between “incidental” shared contexts and “deliberate” shared contexts. Incidental contexts arising from family or long association with friends. Common/shared experiences form an incidental context.

Deliberate contexts, on the other hand, are the intentional melding of a variety of contexts, in her examples, the contexts of biologists and programmers. Who at the outset, lacked a common context in which to communicate.

Forming teams with diverse backgrounds is a way to create a “deliberate” context, but my question would be how to preserve that “deliberate” context for others? It becomes an “incidental” context if others must join the team in order to absorb the previously “deliberate” context. If that is a requirement, then others will not be able to benefit from deliberately created contexts in which they did not participate.

If the process and decisions made in forming a “deliberate” context were captured by a topic map, then others could apply this “new” deliberate context to develop other “deliberate” contexts. Perhaps some of the decisions or mappings made would not suit another “deliberate” context but perhaps some would. And perhaps other “deliberate” contexts would evolve beyond the end of their inputs.

The point being that unless these “deliberate” contexts are captured, to whatever degree of granularity is desired, every “deliberate” context for say biologists and programmers is starting off at ground zero. Have you ever heard of a chemistry experiment starting off by recreating the periodic table? I haven’t. Perhaps we should abandon that model in the building of “deliberate” contexts as well.

Not to mention that re-usable “deliberate” contexts might enable greater diversity in teams.

Topic maps anyone?

PS: I suggest topic maps to capture “deliberate” context because topic maps are not constrained by logic. You can capture any subject and any relationship between subjects, logical or not. For example, a user of a modern dictionary, which lists words in alphabetical order, would be quite surprised if given a dictionary of Biblical Hebrew and asked to find a word (assuming they know the alphabet). The most common dictionaries of Biblical Hebrew list words by their roots and not as they appear to the common reader. There are arguments to be made for each arrangement but neither one is a “logical” answer.

The arrangement of dictionaries is another example of differing contexts. With a topic map I can offer a reader whichever Biblical Hebrew dictionary is desired, with only one text underlying both displays. As opposed to the printed version which can offer only one context or another.

U&lc (volumes 1-24)

Filed under: Communication,Graphics,Typography — Patrick Durusau @ 1:36 pm

U&lc (volumes 1-24)

A remarkable collection of back issues of U&lc.

To best explain the almost twenty-seven year run of U&lc, I offer this editorial from volume 1, issue 1:

Why U&lc?

The world of graphic arts is alive today with new technological advances, so vast and difficult to comprehend, that they strain the imagination of even the most knowledgeable and creatively gifted among us. New materials, new tools, new ways to plan work are becoming mandatory for efficiency, quality, economy—presenting problems for all—printers, typesetters, artists, writers, advertisers, publishers—all the creative people who have anything to do with preparation of the visual word.

How to keep up? How to stay in touch with what is current? How to plan for tomorrow? To envision a future essential to decision making today?

Vital questions for the interested professional. Yet where can he find the most recent information on trends, styles, fashions? Where can he read about all and everything that is happening in the graphic arts and sciences?

To help make this broad body of knowledge and information available—and, hopefully, to provide some answers— International Typeface Corporation introduces this first issue of “U&/c,”the International Journal of Typo/Graphics, designed by Herb Lubalin and distributed worldwide.

“U&lc”will have broad general appeal, covering important graphic events and presenting original articles by world leaders in the typographic arts, as well as reprints of articles of importance that have appeared in other publications.

“U&/c”will feature outstanding examples of typographic design in all fields of visual communication, from the best-known creators to the undiscovered shops.

“U&lc” will offer in-depth analysis of the material presented and study the direction of current work and developments in typographic technology.

In brief, “U&k”will provide a panoramic window, a showcase for the world of graphic arts—a clearinghouse for the international exchange of ideas and information.

It is the intent of the editorial staff and the directors of ITC that “U&/c” will come to serve as the international journal for all who want to have their finger on “what is new’,’ “what is happening’: and “what to look for” in the world of typographics.

The Editors

Fonts, graphics, page layout as as important to communication as language, grammar, style, content, experience, context and a host of other known and unknown factors. Life may or may not be a miracle. But that communication happens at all, is certainly a miracle.

Fonts and graphic layout are two known factors that impact communication and you would do well to appreciate them, even as you seek the advice of experts for screen or print communication with users.

Enjoy!

PS: This remarkable collection is hosted at Fonts.com. A remarkable collection of information on typography in its own right.

December 14, 2014

How Scientists Are Learning to Write

Filed under: Communication,Writing — Patrick Durusau @ 5:39 pm

How Scientists Are Learning to Write by Alexandra Ossola.

From the post:

The students tried not to look sheepish as their professor projected the article on the whiteboard, waiting for their work to be devoured by their classmates. It was the second class for the nine students, all of whom are Ph.D. candidates or post-doctoral fellows. Their assignment had been to distill their extensive research down to just three paragraphs so that the average person could understand it, and, as in any class, some showed more aptitude than others. The piece on the board was by one of the students, a Russian-born biologist.

The professor, the journalist and author Stephen Hall (with whom I took a different writing workshop last year), pointed to the word “sequencing.” “That’s jargon-ish,” he said, circling it on the board. “Even some people in the sciences don’t have an intuitive understanding of what that means.” He turned to another student in the class, an Italian native working on his doctorate in economics, for confirmation. “Yes, I didn’t know what was going on,” he said, turning to the piece’s author. The biology student wrote something in her notebook.

Why is better writing important?:

But explaining science is just as valuable for the lay public as it is for the scientists themselves. “Science has become more complex, more specialized—every sub-discipline has its own vocabulary,” Hall said. Scientists at all levels have to work hard to explain niche research to the general public, he added, but it’s increasingly important for the average person to understand. That’s because their research has become central to many other elements of society, influencing realms that may have previously seemed far from scientific rigors.

Olivia Wilkins, a post-doctoral fellow who studies plant genetics at New York University’s Center for Genomics and Systems Biology, recently took Hall’s four-session workshop. She wanted to be a better writer, she said, because she wanted her research to matter. “Science is a group effort. We may be in different labs at different universities, but ultimately, many of us are working towards the same goals. I want to get other people as excited about my work as I am, and I believe that one of the ways to do this is through better writing.”

How about that? Communicating with other people who are just as bright as you, but who don’t share the same vocabulary? Does that sound like a plausible reason to you?

I really like the closer:

“…Writing takes a lot of practice like anything else—if you don’t do it, you don’t get better. (emphasis added)

I review standards and even offer editing advice from time to time. If you think scientists aren’t born with the ability to write, you should check out standards drafts by editors unfamiliar with how to write standards.

Citations in a variety of home grown formats, to publications that may or may not exist or be suitable for normative citation, to terminology that isn’t defined, anywhere, to contradictions between different parts, to conformance clauses that are too vague for anyone to know what is required, and many things in between.

If anything should be authored with clarity, considering that conformance should make applications interoperable, it is IT standards. Take the advice in Alexandra’s post to heart and seek out a writing course near you.

I edit and review standards so ping me if you want an estimate on how to improve your latest standard draft. (References available on request.)

I first saw this in a tweet by Gretchen Ritter.

November 24, 2014

It seemed like a good idea at the time

Filed under: Communication,Programming — Patrick Durusau @ 11:38 am

It seemed like a good idea at the time by Tessa Thornton.

From the post:

I was reading through some of the on-boarding docs my first day at Shopify, and came across a reference to something called the “Retrospective Prime Directive”, which really appealed to me (initially because Star Trek):

Regardless of what we discover, we understand and truly believe that everyone did the best job they could, given what they knew at the time, their skills and abilities, the resources available, and the situation at hand.

This made me think of something I’ve been reminding myself of a lot over the past year, which started out as a joke but I’ve come to think of it as my own directive when it comes to reading other people’s code: It probably seemed like a good idea at the time.

Tessa’s point that understanding what someone was trying to accomplish, as opposed to mocking their efforts, is more productive is useful.

Not only can it lead to deeper understanding of the problem but you won’t waste time complaining about your predecessors being idiots.

I first saw this in a tweet by Julie Evans.

September 9, 2014

Instructor Hangouts, Landing this Friday

Filed under: Communication,Teaching — Patrick Durusau @ 6:54 pm

Instructor Hangouts, Landing this Friday by Bill Mills.

From the post:

I’m pleased to announce that this Friday, 12 Sept, will be the first offering of a new twice-monthly event hosted by the Mozilla Science Lab: Instructor Hangouts.

There is a growing number of fantastic workshop-oriented software and data education programs out there to spool learners up on the ideas and skills we’d like to share. In our Instructor Hangouts, instructors from all these initiatives will be invited to share ideas, discuss skills and strategies, and most importantly, get to know one another. By being part of a diverse but federated community, we all stand to learn from each other’s experience.

Happening twice every other Friday, at 9 AM and 9 PM Pacific (UTC -8), I’ll be inviting instructors from Software Carpentry, Ladies Learning Code, rOpenSci, PyLadies, the School of Data, Code4Lib and more to spend an hour welcoming new instructors to our ranks, discussing lessons learned from recent workshops, and diving deep on all matters of instruction.

Cool!

If you want to educate others, this is a perfect opportunity to sharpen your skills.

I first saw this in a tweet by Mozilla Science Lab.

June 27, 2014

Communicating and resolving entity references

Filed under: Communication,Entity Resolution,Shannon,Subject Identity — Patrick Durusau @ 1:17 pm

Communicating and resolving entity references by R.V. Guha.

Abstract:

Statements about entities occur everywhere, from newspapers and web pages to structured databases. Correlating references to entities across systems that use different identifiers or names for them is a widespread problem. In this paper, we show how shared knowledge between systems can be used to solve this problem. We present “reference by description”, a formal model for resolving references. We provide some results on the conditions under which a randomly chosen entity in one system can, with high probability, be mapped to the same entity in a different system.

An eye appointment is going to prevent me from reading this paper closely today.

From a quick scan, do you think Guha is making a distinction between entities and subjects (in the topic map sense)?

What do you make of literals having no identity beyond their encoding? (page 4, #3)

Redundant descriptions? (page 7) Would you say that defining a set of properties that must match would qualify? (Or even just additional subject indicators?)

Expect to see a lot more comments on this paper.

Enjoy!

I first saw this in a tweet by Stefano Bertolo.

June 5, 2014

Presenting: structure story and support

Filed under: Communication,Presentation — Patrick Durusau @ 3:13 pm

Presenting: structure story and support by Felienne Hermans.

From the description:

Conference presentations are the moment to share your results, and to connect with researchers about future directions. However, presentations are often created as an afterthought and as a result they are often not as exciting as they could be.

In this slidedeck Felienne Hermans shares hands-on techniques to engage an audience.

The talk covers the entire spectrum of presenting: we start with advice on how to structure a talk and how to incorporate a core message into it. Once we have addressed the right structure for a talk, we will work on adding stories and arcs of tension to your presentation. Finally, to really perform as a presenter, we will talk about how slide design and body language can support your presentation.

If you want to effectively present topic maps or other technologies, this is a slide deck you cannot miss!

If Felienne Hermans is presenting this or some future version of this presentation at a conference, that alone is a reason to register.

Seriously.

I first saw this in a tweet by Olga Liskin.

May 6, 2014

Cyberterrorists vs. Squirrels

Filed under: Communication,Cybersecurity — Patrick Durusau @ 7:18 pm

power outages

From a tweet by Eli Dourado with the note: “Everything you need to know about cyberterrorism in one chart.”

It would be helpful to have a chart like this one for several topics. Terrorism, cyberterrorism, crime, etc.

This is one aspect of what is called “risk assessment.”

Risk assessment would say that a wandering planet crashing into the Earth is a very bad thing, the odds of that happening are very low and the likelihood of an effective response is nil.

Accurate risk assessments could reduce the waste of resources on improbable incidents or those for which there is no effective response.

May 4, 2014

What I Said Is Not What You Heard

Filed under: Communication,Language — Patrick Durusau @ 1:22 pm

Another example of where semantic impedance can impair communication, not to mention public policy decisions:

science-public-disconnect

Those are just a few terms that are used in public statements from scientists.

I can hardly imagine the disconnect between lawyers and the public. Or economists and the public.

To say nothing of computer science in general and the public.

I’m not sold on the solution to bias being heard as distortion, political motive, is: offset from an observation.

Literally true but I’m not sure omitting the reason for the offset is all that helpful.

Something more along the lines of: “test A misses the true value B by C, so we (subtract/add) C to A to get a more correct value.”

A lot more words but clearer.

The image is from: Communicating the science of climate change by Richard C. J. Somerville and Susan Joy Hassol. A very good article on the perils of trying to communicate with the general public about climate change.

But it isn’t just the general public that has difficulty understanding scientists. Scientists have difficulty understanding other scientists, particularly if the scientists in question are from different domains or even different fields within a domain.

All of which has to make you wonder: If human beings, including scientists fail to understand each other on a regular basis, who is watching for misunderstandings between computers?

I first saw this in a tweet by Austin Frakt.

PS: Pointers to research on words that fail to communicate greatly appreciated.

May 1, 2014

The Pocket Guide to Bullshit Prevention

Filed under: Communication,Marketing — Patrick Durusau @ 7:10 pm

The Pocket Guide to Bullshit Prevention by Michelle Nijhuis.

From the post:

bs-detector

I am often wrong. I misunderstand; I misremember; I believe things I shouldn’t. I’m overly optimistic about the future quality of Downton Abbey, and inexact in my recall of rock-star shenanigans. But I am not often—knock wood—wrong in print, and that’s because, as a journalist, I’ve had advanced training in Bullshit Prevention Protocol (BPP).

Lately, as I’ve watched smarter and better-dressed friends believe all manner of Internet nonsense, I’ve come to appreciate my familiarity with BPP. Especially because we’re all publishers now. (Sharing a piece of news with 900 Facebook friends is not talking. It’s publishing.) And publishing bullshit is extremely destructive: It makes it harder for the rest of us to distinguish between bogus news and something real, awful, and urgent.

While BPP is not failsafe, generations of crotchety, underpaid, truth-loving journalists have found that it dramatically reduces one’s chances of publishing bullshit.

So I believe that everyone should practice BPP before publishing. No prior experience is required: Though it’s possible to spend a lifetime debating the finer points of BPP (and the sorely-needed news literacy movement wants high-school and college students to spend at least a semester doing so) its general principles, listed in a handy, portable, and free—free!—form above, are simple.

Here’s how they work in practice.

This rocks!

Michelle’s post is a must read to get the maximum benefit from the Pocket Guide to Bullshit Prevention (PGBP).

If I could equip every librarian with one and only one resource for evaluating technologies, it would be this pocket guide.

The 49 words of the PGBP will serve you better than any technology review, guide, article, or testimonial.

It takes effort on your part but the choice is effort on your part or your being taken advantage of by others.

Your call.

I first saw this in a tweet by Neil Saunders.

April 26, 2014

The Feynman Lectures on Physics

Filed under: Communication,Science — Patrick Durusau @ 4:08 pm

The Feynman Lectures on Physics Online, Free!

From the webpage:

Caltech and The Feynman Lectures Website are pleased to present this online edition of The Feynman Lectures on Physics. Now, anyone with internet access and a web browser can enjoy reading a high quality up-to-date copy of Feynman’s legendary lectures.

The lectures:

Feynman writes in volume 1, 1-1:

You might ask why we cannot teach physics by just giving the basic laws on page one and then showing how they work in all possible circumstances, as we do in Euclidean geometry, where we state the axioms and then make all sorts of deductions. (So, not satisfied to learn physics in four years, you want to learn it in four minutes?) We cannot do it in this way for two reasons. First, we do not yet know all the basic laws: there is an expanding frontier of ignorance. Second, the correct statement of the laws of physics involves some very unfamiliar ideas which require advanced mathematics for their description. Therefore, one needs a considerable amount of preparatory training even to learn what the words mean. No, it is not possible to do it that way. We can only do it piece by piece. (emphasis added)

A remarkable parallel to the use of “logic” on the WWW.

First, logic is only a small part of human reasoning, as Boole acknowledges in the “Laws of Thought.” Second, a “considerable amount of preparatory training” is required to use it.

Feynman has a real talent for explanation. Enjoy!

PS: A disclosed mapping of Feynman’s terminology to current physics would make an interesting project.

April 19, 2014

12 Things TEDx Speakers do that Preachers Don’t.

Filed under: Communication — Patrick Durusau @ 6:55 pm

12 Things TEDx Speakers do that Preachers Don’t.

From the post:

Ever seen a TEDx talk? They’re pretty great. Here’s one I happen to enjoy, and have used in a couple of sermons. I’ve wondered for a long time, “How in the world do each of these talks end up consistently blowing me away?” So I did some research, and found the TEDx talk guidelines for speakers. Some of the advice was basic – but some of it was unexpected. Much of it, I think, is a welcome wake up call to preachers who are communicating in a 21st century postmodern, post-Christian context. Obviously, some of this doesn’t fit with a preacher’s ethos: but much of it does.

That said, here are 12 things TEDx speakers do that preachers usually don’t:

A great retelling of the guidelines for TEDx speakers!

With the conference season (summer) rapidly approaching, now is the time to take this advice to heart!

Imagine a conference presentation without the filler than everyone in the room already knows (or should to be attending the conference). I keep longing for papers that don’t repeat largely the same introduction as every other paper in the area.

Yes, graphs have nodes/vertices, edges/arcs and you are g-o-i-n-g t-o l-a-b-e-l t-h-e-m. 😉

The advice for TEDx speakers is equally applicable to webcasts and podcasts.

February 23, 2014

…Into Dreamscapes

Filed under: Communication,Graphics,Visualization — Patrick Durusau @ 10:43 am

A Stunning App That Turns Radiohead Songs Into Dreamscapes by Liz Stinson.

From the post:

There’s something about a good Radiohead song that lets your mind roam. And if you could visualize what a world in which Radiohead were the only soundtrack, it would look a lot like the world Universal Everything created for the band’s newly released app PolyFauna (available on iOS and Android). Which is to say, a world that’s full of cinematic landscapes and bizarre creatures that only reside in our subconscious minds.

“I got an email out of nowhere from Thom [Yorke], who’d seen a few projects we’d done,” says Universal Everything founder Matt Pyke. Radiohead was looking to design a digital experience for its 2011 King of Limbs session that departed from the typical music apps available, which tend to put emphasis on discography or tour dates. Instead, the band wanted an audio/visual piece that was more digital art than serviceable app.

Pyke met with Yorke and Stanley Donwood, the artist who’s been responsible for crafting Radiohead’s breed of peculiar, moody aesthetics. “We had a really good chat about how we could push this into a really immersive atmospheric audio/visual environment,” says Pyke. What they came up with was PolyFauna, a gorgeously weird interactive experience based on the skittish beats and melodies of “Bloom,” the first track off of King of Limbs.

Does this suggest a way to visualize financial or business data? Everyone loves staring at rows and rows of spreadsheet numbers, but just for a break, what if you visualized the information corridors for departments in an annual (internal) report? Where each corridors is as wide or narrow as access by other departments to their data?

Or approval processes where gate-keepers are trolls by bridges?

I wouldn’t do an entire report that way but one or two slide or two images could leave a lasting impression.

Remembering the more powerfully you communicate information, the more powerful the information becomes.

February 22, 2014

MathDL Mathematical Communication

Filed under: Communication,Mathematics,Statistics — Patrick Durusau @ 3:53 pm

MathDL Mathematical Communication

From the post:

MathDL Mathematical Communication is a developing collection of resources for engaging students in writing and speaking about mathematics, whether for the purpose of learning mathematics or of learning to communicate as mathematicians.

This site addresses diverse aspects of mathematical communication, including

Here is a brief summary of suggestions to consider as you design a mathematics class that includes communication.

This site originated at M.I.T. so most of the current content is for teaching upper-level undergraduates to communicate as mathematicians.

The site is now yours. Contribute materials! Suggest improvements!

I discovered this site from a reference at Project Laboratory in Mathematics.

As the complexity of data and data analysis increases, so is you need to communicate mathematics and mathematics-based concepts to lay persons. There is much here that may assist in that task.

With enough experience: The wise you can persuade and the lesser folks you can daunt. 😉

February 18, 2014

Writing about Math…

Filed under: Communication,Mathematics,Writing — Patrick Durusau @ 11:02 am

Writing about Math for the Perplexed and the Traumatized by Steven Strogatz.

From the introduction:

In the summer of 2009 I received an unexpected email from David Shipley, the editor of the op-ed page for the New York Times. He invited me to look him up next time I was in the city and said there was something he’d like to discuss.

Over lunch at the Oyster Bar restaurant in Grand Central Station, he asked whether I’d ever have time to write a series about the elements of math aimed at people like him. He said he’d majored in English in college and hadn’t studied math since high school. At some point he’d lost his way and given up. Although he could usually do what his math teachers had asked of him, he’d never really seen the point of it. Later in life he’d been puzzled to hear math described as beautiful. Could I convey some of that beauty to his readers, many of whom, he suspected, were as lost he was?

I was thrilled by his proposition. I love math, but even more than that, I love trying to explain it. Here I’d like to touch on a few of the writing challenges that this opportunity entailed, along with the goals I set for myself, and then describe how, by borrowing from three great science writers, I tried to meet those challenges. I’m not sure if any of my suggestions will help other mathematicians who’d like to share their own love of math with the public, but that’s my hope.

If you are looking for tips and examples of how to explain computer science topics, you have arrived!

Not only is this essay by Strogatz highly useful and entertaining, you can also consult his fifteen (15) part series on math that appeared in the New York Times.

The New York Times series ended in 2010 but you can following Steven at: @stevenstrogatz and at RadioLab.

I first saw this in a tweet by Michael Nielsen.

BTW, if you have contacts at the New York Times, would you mention that including hyperlinks for Twitter handles and websites is a matter of common courtesy? Thanks!

January 15, 2014

Marin’s Year on SlideShare

Filed under: Communication,Marketing — Patrick Durusau @ 7:24 pm

Marin’s Year on SlideShare

Marin Dimitrov tweeted today:

SlideShare says my content is among the top 1% of most viewed on SlideShare in 2013

Since I am interested in promoting topic maps and SlideShare is a venue for that, I checked the Slideshare summary, looking for clues.

First, Marin hasn’t overloaded SlideShare, some 14 slideshares to date.

Second, none of the slideshares with high ratings are particularly recent (2010).

Third, 19.5 slides per presentation against the average of 14.4.

Fourth, average words per slide, 35.4 compared to average slideshare of 10.

Is that the magic bullet?

We have all been told to avoid “death by powerpoint.”

There is a presentation with that name: Death by PowerPoint (and how to fight it) by Alexei Kapterev. (July 31, 2007)

Great presentation but at slide 40 Alexei says:

People read faster than you speak. This means you are useless.

(written over a solid text background)

How to explain Marin’s high amount of text versus Alexei saying to not have much text?

Marin’s NoSQL Databases, most of the sixty (60) slides are chock full of text. Useful text to be sure but very full of it.

My suspicion is that what works for a presentation to a live audience, were you can fill out the points, explain pictures, etc., isn’t the same thing as a set of slides for readers who didn’t see the floor show.

Readers who didn’t hear the details are likely to find “great” slides for a live presentation to be too sparse to be useful.

So my working theory is that slides for live presentations should be quite different from slides for posting to Slideshare. What can be left for you to ad lib for the live audience should be spelled out on the slides. (my working hypothesis)

Suggestions/comments?

PS: I intend to test this theory with some slides on topic maps at the end of January.

September 19, 2013

Pixar’s 22 Rules of Storytelling

Filed under: Communication,Marketing — Patrick Durusau @ 6:26 pm

Pixar’s 22 Rules of Storytelling by DinoIgnacio.

From the webpage:

Former Pixar story artist Emma Coats tweeted this series of “story basics” in 2011. https://twitter.com/lawnrocket These were guidelines that she learned from her more senior colleagues on how to create appealing stories. I superimposed all 22 rules over stills from Pixar films to help me remember them. All Disney copyrights, trademarks, and logos are owned by The Walt Disney Company.

If you find the rules hard to read with the picture backgrounds (I do), see the text version: http://imgur.com/a/MRfTb.

While cast as rules for “storytelling,” these are rules for effective communication in any context.

August 15, 2013

Five tips for Delivering a Presentation

Filed under: Communication,Marketing — Patrick Durusau @ 3:29 pm

Five tips for Delivering a Presentation by Hugh E. Williams.

From the post:

I wrote a few weeks ago on writing a presentation. This week, I offer a few thoughts on delivering one – in no particular order. I’m working on my sequel to my post on performance reviews — expect it next week!

Hugh covers:

  1. Eye Contact
  2. Body Language
  3. Don’t Read Notes (or Memorize)
  4. Don’t Read Slides
  5. It’s (almost) Impossible to Speak Too Slowly

Same top tips that we covered in my first speech class in high school.

Well, except for the one about reading slides. 😉 It would have been:

Don’t Read the Overhead Slides.

Technology has changed but poor presenting has not.

The same is true for poor sales technique.

Such as trying to sell customers what you are interested in selling, not what the customer is interested in buying.

That sounds like a bad plan to me.

July 15, 2013

Corporate Culture Clash:…

Filed under: Communication,Diversity,Heterogeneous Data,Language,Marketing,Semantics — Patrick Durusau @ 3:05 pm

Corporate Culture Clash: Getting Data Analysts and Executives to Speak the Same Language by Drew Rockwell

From the post:

A colleague recently told me a story about the frustration of putting in long hours and hard work, only to be left feeling like nothing had been accomplished. Architecture students at the university he attended had scrawled their frustrations on the wall of a campus bathroom…“I wanted to be an architect, but all I do is create stupid models,” wrote students who yearned to see their ideas and visions realized as staples of metropolitan skylines. I’ve heard similar frustrations expressed by business analysts who constantly face the same uphill battle. In fact, in a recent survey we did of 600 analytic professionals, some of the biggest challenges they cited were “getting MBAs to accept advanced methods”, getting executives to buy into the potential of analytics, and communicating with “pointy-haired” bosses.

So clearly, building the model isn’t enough when it comes to analytics. You have to create an analytics-driven culture that actually gets everyone paying attention, participating and realizing what analytics has to offer. But how do you pull that off? Well, there are three things that are absolutely critical to building a successful, analytics-driven culture. Each one links to the next and bridges the gap that has long divided analytics professionals and business executives.

Some snippets to attract you to this “must read:”

(…)
In the culinary world, they say you eat with your eyes before your mouth. A good visual presentation can make your mouth water, while a bad one can kill your appetite. The same principle applies when presenting data analytics to corporate executives. You have to show them something that stands out, that they can understand and that lets them see with their own eyes where the value really lies.
(…)
One option for agile integration and analytics is data discovery – a type of analytic approach that allows business people to explore data freely so they can see things from different perspectives, asking new questions and exploring new hypotheses that could lead to untold benefits for the entire organization.
(…)
If executives are ever going to get on board with analytics, the cost of their buy-in has to be significantly lowered, and the ROI has to be clear and substantial.
(…)

I did pick the most topic map “relevant” quotes but they are as valid for topic maps as any other approach.

Seeing from different perspectives sounds like on-the-fly merging to me.

How about you?

May 31, 2013

Creating Effective Slides

Filed under: Communication,Presentation — Patrick Durusau @ 3:35 pm

A lecture given by Jean-luc Doumont on April 4, 2013 – Clark Center Stanford Univeristy.

Description:

Those of us who frequently attend presentations probably agree that most slides out there are ineffective, often detracting from what presenters are saying instead of enhancing their presentation. Slides have too much text for us to want to read them, or not enough for us to understand the point. They impress us with colors, clip art, and special effects, but not with content. As a sequence of information chunks, they easily create a feeling of tedious linearity. Based on Dr Doumont’s book, Trees, maps, and theorems about “effective communication for rational minds,” this lecture will discuss how to create more effective slides. Building on three simple yet solid principles, it will establish what (not) to include on a slide and why, how to optimize the slide’s layout to get the message across effectively, and how to use slides appropriately when delivering the presentation.

A truly delightful presentation on creating effective slides.

Even has three laws:

  1. Adapt to your audience
  2. Maximize the signal/noise ratio
  3. Use effective redundancy

Should be required viewing for conference presenters, at least annually.

Website with more resources: Principiæ.

I first saw this at Creating effective slides: Design, Construction, and Use in Science by Bruce Berriman.

April 20, 2013

Data Storytelling: The Ultimate Collection of Resources

Filed under: Communication,Data,Data Storytelling — Tags: — Patrick Durusau @ 9:47 am

Data Storytelling: The Ultimate Collection of Resources by Zach Gemignani.

From the post:

The hot new concept in data visualization is “data storytelling”; some are calling it the next evolution of visualization (I’m one of them). However, we’re early in the discussion and there are more questions than answers:

  • Is data storytelling more than a catchy phrase?
  • Where does data storytelling fit into the broader landscape of data exploration, visualization, and presentation?
  • How can the traditional tools of storytelling improve how we communicate with data?
  • Is it more about story-telling or story-finding?

Many of the bright minds in the data visualization field have started to tackle these questions — and it is something that we’ve been exploring at Juice in our work. Below you’ll find a collection of some of the best blog posts, presentations, research papers, and other resources that take on this topic.

I count ten (10) blog posts, four (4) presentations, five (5) papers and eight (8) tools, examples and other resources.

Get yourself a fresh cup of coffee. You are going to be here a while.

PS: I don’t know that “data storytelling” is new or if the last century or so suffered a real drought in “data storytelling.”

Medieval cathedrals were exercises in storytelling but a modern/literate audience fails to appreciate them as designed.

March 30, 2013

When Presenting Your Data…

Filed under: Communication,Graphics,Presentation,Visualization — Patrick Durusau @ 10:46 am

When Presenting Your Data, Get to the Point Fast by Nancy Duarte.

From the post:

Projecting your data on slides puts you at an immediate disadvantage: When you’re giving a presentation, people can’t pull the numbers in for a closer look or take as much time to examine them as they can with a report or a white paper. That’s why you need to direct their attention. What do you want people to get from your data? What’s the message you want them to take away?

Data slides aren’t really about the data. They’re about the meaning of the data. And it’s up to you to make that meaning clear before you click away. Otherwise, the audience won’t process — let alone buy — your argument.

Nancy starts off with a fairly detailed table full of numbers, that is less complex than some topic map diagrams I have seen. 😉

Moves onto the infamous pie chart* and then to a bar chart.

The lesson being to present information in a way it can be immediately comprehended by your audience.

Here’s a non-topic map illustration, explaining time dilation:

Time Dilation

Here’s another explanation of time dilation:

Time Dilation

Both “explain” time dilation but one to c-suite types and the other to techies.

Problem: C-suite types control the purse strings.

Question: What issues do c-suite types see that topic maps can address?


*Leland Wilkinson in The Grammar of Graphics, 2nd ed., writes of pie charts:

A pie chart is perhaps the most ubiquitous of modern graphics. It has been reviled by statisticians (unjustifiably) and adored by managers (unjustifiably).

So far (I am at chapter 3), Wilkinson doesn’t elaborate on his response to criticisms of pie charts by statisticians.

Not important for this discussion but one of those tidbits that livens up a classroom discussion.

I first saw this in a tweet by Gregory Piatetsky.

March 27, 2013

….Like A Child’s Story Book [Visual Storytelling]

Filed under: Communication,Interface Research/Design,Users — Patrick Durusau @ 7:10 pm

Articulating Your Content Strategy Like A Child’s Story Book by Michael Brito.

From the post:

I used to read “Love You Forever” to both of my girls when they were little. Even thinking about it today, I still get choked up. It’s really a heartfelt story. What I remember the most about it is that it uses imagery to tell a very significant story (as with most children’s books). The story is about a mother’s unconditional love for her son; and then chronicles her son’s life growing to an adult and starting his own family. The sad conclusion shows how he reciprocates his love to his mother who has grown to be an elderly woman. There are just a few sentences on each page but the story and illustration is powerful and you can even follow along without even reading the text.

Michael makes a great case for visual storytelling and includes a Slideshare presentation by Stefanos Karagos to underline his point.

Before you view the slides!

Ask yourself what percent of users have a great experience with your product?

The slides reveal what percent of users share your opinion.

I doubt you have noticed that I am really a “text” sort of person. 😉

The lesson here isn’t any more foreign to you than it is to me.

But I think the author has a very good point, assuming our goal is to communicate with others.

Can’t communicate with others as we would like for them to be.

At least not successfully.

March 21, 2013

FORCE 11

Filed under: Communication,Publishing — Patrick Durusau @ 5:19 am

FORCE 11

Short description:

Force11 (the Future of Research Communications and e-Scholarship) is a virtual community working to transform scholarly communications toward improved knowledge creation and sharing. Currently, we have 315 active members.

A longer description from the “about” page:

Research and scholarship lead to the generation of new knowledge. The dissemination of this knowledge has a fundamental impact on the ways in which society develops and progresses; and at the same time, it feeds back to improve subsequent research and scholarship. Here, as in so many other areas of human activity, the Internet is changing the way things work: it opens up opportunities for new processes that can accelerate the growth of knowledge, including the creation of new means of communicating that knowledge among researchers and within the wider community. Two decades of emergent and increasingly pervasive information technology have demonstrated the potential for far more effective scholarly communication. However, the use of this technology remains limited; research processes and the dissemination of research results have yet to fully assimilate the capabilities of the Web and other digital media. Producers and consumers remain wedded to formats developed in the era of print publication, and the reward systems for researchers remain tied to those delivery mechanisms.

Force11 is a community of scholars, librarians, archivists, publishers and research funders that has arisen organically to help facilitate the change toward improved knowledge creation and sharing. Individually and collectively, we aim to bring about a change in modern scholarly communications through the effective use of information technology. Force11 has grown from a small group of like-minded individuals into an open movement with clearly identified stakeholders associated with emerging technologies, policies, funding mechanisms and business models. While not disputing the expressive power of the written word to communicate complex ideas, our foundational assumption is that scholarly communication by means of semantically enhanced media-rich digital publishing is likely to have a greater impact than communication in traditional print media or electronic facsimiles of printed works. However, to date, online versions of ‘scholarly outputs’ have tended to replicate print forms, rather than exploit the additional functionalities afforded by the digital terrain. We believe that digital publishing of enhanced papers will enable more effective scholarly communication, which will also broaden to include, for example, the publication of software tools, and research communication by means of social media channels. We see Force11 as a starting point for a community that we hope will grow and be augmented by individual and collective efforts by the participants and others. We invite you to join and contribute to this enterprise.

Force11 grew out of the FORC Workshop held in Dagstuhl, Germany in August 2011.

FORCE11 is a movement of people interested in furthering the goals stated in the FORCE11 manifesto. An important part of our work is information gathering and dissemination. We invite anyone with relevant information to provide us links which we may include on our websites. We ask anyone with similar and/or related efforts to include links to FORCE11. We are a neutral information market, and do not endorse or seek to block any relevant work.

The Tools and Resources page is particularly interesting.

Current divisions are:

  • Alternative metrics
  • Author Identification
  • Annotation
  • Authoring tools
  • Citation analysis
  • Computational Linguistics/Text Mining Efforts
  • Data citation
  • Ereaders
  • Hypothesis/claim-based representation of the rhetorical structure of a scientific paper
  • Mapping initiatives between ontologies
  • Metadata standards and ontologies
  • Modular formats for science publishing
  • Open Citations
  • Peer Review: New Models
  • Provenance
  • Publications and reports relevant to scholarly digital publication and data
  • Semantic publishing initiatives and other enriched forms of publication
  • Structured Digital Abstracts – modeling science (especially biology) as triples
  • Structured experimental methods and workflows
  • Text Extraction

Topic maps fit into communication agendas quite easily.

The first step in communication is capturing something to say.

The second step in communication is expressing what has been captured so it can be understood by others (or yourself next week).

Topic maps do both quite nicely.

I first saw this in a tweet by Anita de Waard.

Older Posts »

Powered by WordPress