Another Word For It Patrick Durusau on Topic Maps and Semantic Diversity

August 20, 2016

Everybody Discusses The Weather In R (+ Trigger Warning)

Filed under: Climate Data,Climate Informatics,R,Weather Data — Patrick Durusau @ 3:01 pm

Well, maybe not everybody but if you are interested in weather statistics, there’s a trio of posts at R-Bloggers made for you.

Trigger Warning: If you are a climate change denier, you won’t like the results presented by the posts cited below. Facts dead ahead.

Tracking Precipitation by Day-of-Year

From the post:

Plotting cumulative day-of-year precipitation can helpful in assessing how the current year’s rainfall compares with long term averages. This plot shows the cumulative rainfall by day-of-year for Philadelphia International Airports rain gauge.

Checking Historical Precipitation Data Quality

From the post:

I am interested in evaluating potential changes in precipitation patterns caused by climate change. I have been working with daily precipitation data for the Philadelphia International Airport, site id KPHL, for the period 1950 to present time using R.

I originally used the Pennsylvania State Climatologist web site to download a CSV file of daily precipitation data from 1950 to the present. After some fits and starts analyzing this data set, I discovered that data for January was missing for the period 1950 – 1969. This data gap seriously limited the usable time record.

John Yagecic, (Adventures In Data) told me about the weatherData package which provides easy to use functions to retrieve Weather Underground data. I have found several precipitation data quality issues that may be of interest to other investigators.

Access and Analyze 170 Monthly Climate Time Series Using Simple R Scripts

From the post:

Open Mind, a climate trend data analysis blog, has a great Climate Data Service that provides updated consolidated csv file with 170 monthly climate time series. This is a great resource for those interested in studying climate change. Quick, reliable access to 170 up-to-date climate time series will save interested analysts hundreds – thousands of data wrangling hours of work.

This post presents a simple R script to show how a user can select one of the 170 data series and generate a time series plot like this:

All of these posts originated at RClimate, a new blog that focuses on R and climate data.

Drop by to say hello to D Kelly O’Day, PE (professional engineer) Retired.

Relevant searches at R-Bloggers (as of today):

Climate – 218 results

Flood – 61 results

Rainfall – 55 results

Weather – 291 results

Caution: These results contain duplicates.

Enjoy!
April 10, 2016

Climate Change: Earth Surface Temperature Data

Filed under: Climate Data,Modeling — Patrick Durusau @ 4:17 pm

Climate Change: Earth Surface Temperature Data by Berkeley Earth.

From the webpage:

Some say climate change is the biggest threat of our age while others say it’s a myth based on dodgy science. We are turning some of the data over to you so you can form your own view.

Even more than with other data sets that Kaggle has featured, there’s a huge amount of data cleaning and preparation that goes into putting together a long-time study of climate trends. Early data was collected by technicians using mercury thermometers, where any variation in the visit time impacted measurements. In the 1940s, the construction of airports caused many weather stations to be moved. In the 1980s, there was a move to electronic thermometers that are said to have a cooling bias.

Given this complexity, there are a range of organizations that collate climate trends data. The three most cited land and ocean temperature data sets are NOAA’s MLOST, NASA’s GISTEMP and the UK’s HadCrut.

We have repackaged the data from a newer compilation put together by the Berkeley Earth, which is affiliated with Lawrence Berkeley National Laboratory. The Berkeley Earth Surface Temperature Study combines 1.6 billion temperature reports from 16 pre-existing archives. It is nicely packaged and allows for slicing into interesting subsets (for example by country). They publish the source data and the code for the transformations they applied. They also use methods that allow weather observations from shorter time series to be included, meaning fewer observations need to be thrown away.

All the computation on climate change is ironic in the face of a meteorologist, Edward R. Lorenz, publishing in 1963, Deterministic Nonperiodic Flow.

You may know that better as the “butterfly effect.” That very small changes in starting conditions can result in very large final states, which are not subject to prediction.

If you find Lorenz’s original paper tough sledding, you may enjoy When the Butterfly Effect Took Flight by Peter Dizikes. (Be aware the links to Lorenz papers in that post are broken, or at least appear to be today.)

In debates about limiting the increase in global temperature, recall that no one knows where any “tipping points” may lie along the way. That is the recognition of “tipping points” is always post tipping.

Given the multitude of uncertainties in modeling climate and the money to be made by solutions chosen or avoided, what do you think will be driving climate research? National interests and priorities or some other criteria?

PS: Full disclosure. Humanity has had, is having an impact on the climate and not for the better, at least in terms of human survival. Whether we are capable of changing human behavior enough to alter results that won’t be seen for fifty or more years remains to be seen.

December 10, 2014

Student Data Sets

Filed under: Climate Data,Dataset — Patrick Durusau @ 5:47 pm

Christopher Lortie tweeted today that his second year ecology students have posted 415 datasets this year!

Which is a great example for others!

However, how do other people find these and similar datasets?

Not a criticism of the students or their datasets but a reminder that findability remains an unsolved issue.

A Tranche of Climate Data

Filed under: Climate Data,Government,Government Data — Patrick Durusau @ 3:35 pm

FACT SHEET: Harnessing Climate Data to Boost Ecosystem & Water Resilience

From the document:

Today, the Administration is making a new tranche of data about ecosystems and water resilience available as part of the Climate Data Initiative—including key datasets related water quality, streamflow, land cover, soils, and biodiversity.

In addition to the datasets being added today to climate.data.gov, the Department of Interior (DOI) is launching a suite of geospatial mapping tools on ecosystems.data.gov that will enable users to visualize and overlay datasets related to ecosystems, land use, water, and wildlife. Together, the data and tools unleashed today will help natural-resource managers, decision makers, and communities on the front lines of climate change build resilience to climate impacts and better plan for the future. (emphasis added)

I had to look up “tranche.” Google offers: “a portion of something, especially money.”

Assume that your contacts and interactions with both sites are monitored and recorded.

June 24, 2014

Virtual Workshop and Challenge (NASA)

Open NASA Earth Exchange (NEX) Virtual Workshop and Challenge 2014

From the webpage:

President Obama has announced a series of executive actions to reduce carbon pollution and promote sound science to understand and manage climate impacts for the U.S.

Following the President’s call for developing tools for climate resilience, OpenNEX is hosting a workshop that will feature:

  1. Climate science through lectures by experts
  2. Computational tools through virtual labs, and
  3. A challenge inviting participants to compete for prizes by designing and implementing solutions for climate resilience.

Whether you win any of the $60K in prize money or not, this looks like a great way to learn about climate data, approaches to processing climate data and the Amazon cloud all at one time!

Processing in the virtual labs is on the OpenNEX (Open NASA Earth Exchange) nickel. You can experience cloud computing without fear of the bill for computing services. Gain valuable cloud experience and possibly make a contribution to climate science.

Enjoy!

January 10, 2014

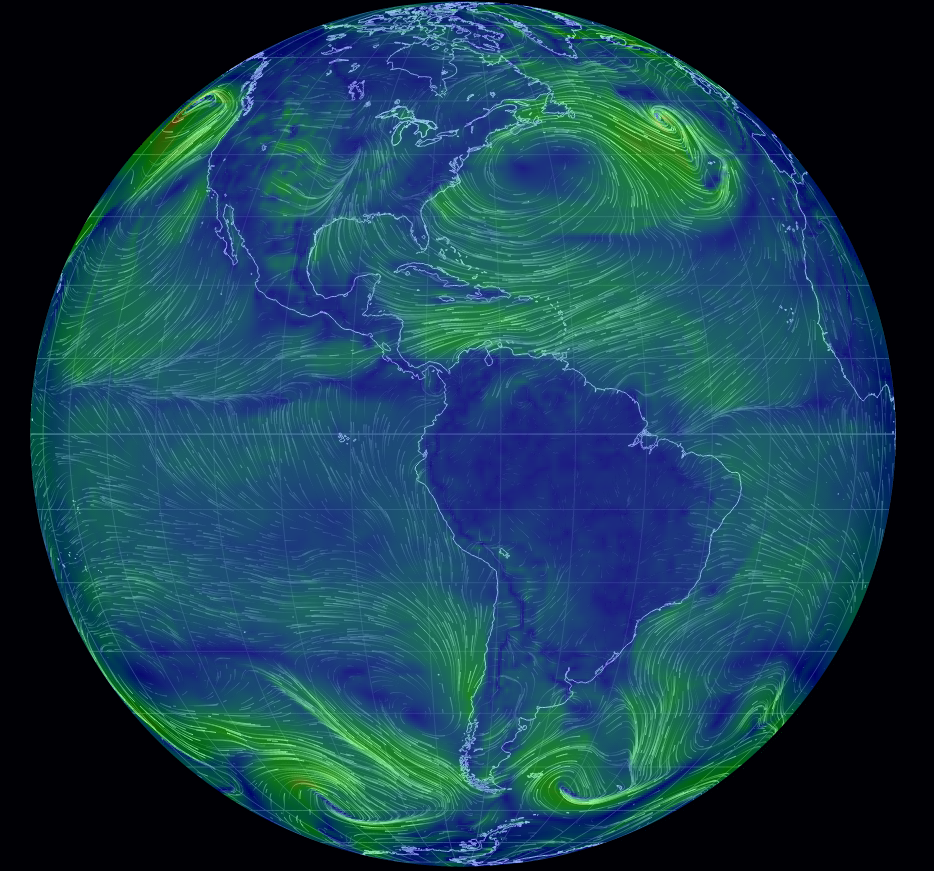
Dirty Wind Paths

Filed under: Climate Data,Climate Informatics,Graphics,Visualization,Weather Data — Patrick Durusau @ 6:38 pm

earth wind patterns

Interactive display of wind patterns on the Earth. Turn the globe, zoom in, etc.

Useful the next time a nuclear power plant cooks off.

If you doubt the “next time” part of that comment, review Timeline: Nuclear plant accidents from the BBC.

I count eleven (11) “serious” incidents between 1957 and 2014.

Highly dangerous activities are subject to catastrophic failure. Not every time or even often.

On the other hand, how often is an equivalent to the two U.S. space shuttle failures acceptable with a nuclear power plant?

If I were living nearby or in the wind path from a nuclear accident, I would say never.

You?

According to Dustin Smith at Chart Porn, where I first saw this, the chart updates every three hours.

January 9, 2014

The Rain Project:…

Filed under: Climate Data,Data,Weather Data — Patrick Durusau @ 7:30 pm

The Rain Project: An R-based Open Source Analysis of Publicly Available Rainfall Data by Gopi Goteti.

From the post:

Rainfall data used by researchers in academia and industry does not always come in the same format. Data is often in atypical formats and in extremely large number of files and there is not always guidance on how to obtain, process and visualize the data. This project attempts to resolve this issue by serving as a hub for the processing of such publicly available rainfall data using R.

The goal of this project is to reformat rainfall data from their native format to a consistent format, suitable for use in data analysis. Within this project site, each dataset is intended to have its own wiki. Eventually, an R package would be developed for each data source.

Currently R code is available to process data from three sources – Climate Prediction Center (global coverage), US Historical Climatology Network (USA coverage) and APHRODITE (Asia/Eurasia and Middle East).

The project home page is here – http://rationshop.github.io/rain_r/

Links to the original sources:

Climate Prediction Center

US Historical Climatology Network

APHRODITE

There are five (5) other sources listed at the project home page “to be included in the future.”

All of these datasets were “transparent” to someone, once upon a time.

Restoring them to transparency is a good deed.

Preventing datasets from going dark is an even better one.

November 14, 2013

Global Forest Change

Filed under: Climate Data,Environment,Mapping,Maps,Visualization — Patrick Durusau @ 7:46 pm

The first detailed maps of global forest change by Matt Hansen and Peter Potapov, University of Maryland; Rebecca Moore and Matt Hancher, Google.

From the post:

Most people are familiar with exploring images of the Earth’s surface in Google Maps and Earth, but of course there’s more to satellite data than just pretty pictures. By applying algorithms to time-series data it is possible to quantify global land dynamics, such as forest extent and change. Mapping global forests over time not only enables many science applications, such as climate change and biodiversity modeling efforts, but also informs policy initiatives by providing objective data on forests that are ready for use by governments, civil society and private industry in improving forest management.

In a collaboration led by researchers at the University of Maryland, we built a new map product that quantifies global forest extent and change from 2000 to 2012. This product is the first of its kind, a global 30 meter resolution thematic map of the Earth’s land surface that offers a consistent characterization of forest change at a resolution that is high enough to be locally relevant as well. It captures myriad forest dynamics, including fires, tornadoes, disease and logging.

Global map of forest change: http://earthenginepartners.appspot.com/science-2013-global-forest

If you are curious to learn more, tune in next Monday, November 18 to a live-streamed, online presentation and demonstration by Matt Hansen and colleagues from UMD, Google, USGS, NASA and the Moore Foundation:

Live-stream Presentation: Mapping Global Forest Change
Live online presentation and demonstration, followed by Q&A
Monday, November 18, 2013 at 1pm EST, 10am PST
Link to live-streamed event: http://goo.gl/JbWWTk
Please submit questions here: http://goo.gl/rhxK5X

For further results and details of this study, see High-Resolution Global Maps of 21st-Century Forest Cover Change in the November 15th issue of the journal Science.

These maps make it difficult to ignore warnings about global forest change. Forests not as abstractions but living areas that recede before your eyes.

The enhancement I would like to see to these maps is the linking of the people responsible with name, photo and last known location.

Deforestation doesn’t happen because of “those folks in government,” or “people who work for timber companies,” or “economic forces,” although all those categories of anonymous groups are used to avoid moral responsibility.

No, deforestation happens because named individuals in government, business, manufacturing, farming, have made individual decisions to exploit the forests.

With enough data on the individuals who made those decisions, the rest of us could make decisions too.

Such as how to treat people guilty of committing and conspiring to commit ecocide.

November 13, 2013

Amazon Hosting 20 TB of Climate Data

Filed under: Amazon Web Services AWS,Climate Data,NASA — Patrick Durusau @ 7:37 pm

Amazon Hosting 20 TB of Climate Data by Isaac Lopez.

From the post:

Looking to save the world through data? Amazon, in conjunction with the NASA Earth Exchange (NEX) team, today released over 20 terabytes of NASA-collected climate data as part of its OpenNEX project. The goal, they say, is to make important datasets accessible to a wide audience of researchers, students, and citizen scientists in order to facilitate discovery.

“Up until now, it has been logistically difficult for researchers to gain easy access to this data due to its dynamic nature and immense size,” writes Amazon’s Jeff Barr in the Amazon blog. “Limitations on download bandwidth, local storage, and on-premises processing power made in-house processing impractical. Today we are publishing an initial collection of datasets available (over 20 TB), along with Amazon Machine Images (AMIs), and tutorials.”

The OpenNEX project aims to give open access to resources to aid earth science researchers, including data, virtual labs, lectures, computing and more.

Excellent!

Isaac also reports that NASA will be hosting workshops on the data.

Anyone care to wager on the presence of semantic issues in the data sets? 😉

May 9, 2013

Help Map Historical Weather From Ship Logs

Filed under: Climate Data,Crowd Sourcing,History,Topic Maps — Patrick Durusau @ 1:05 pm

Help Map Historical Weather From Ship Logs by Caitlin Dempsey.

From the post:

The Old Weather project is a crowdsourcing data gathering endeavor to understand and map historical weather variability. The data collected will be used to understand past weather patterns and extremes in order to better predict future weather and climate. The project is headed by a team of collaborators from a range of agencies such as NOAA, the Met Office, the National Archives, and the National Maritime Museum.

Information about historical weather, in the form of temperature and pressure measurements, can be gleaned from old ship logbooks. For example, Robert Fitzory, the Captain of the Beagle, and his crew recorded weather conditions in their logs at every point the ship visited during Charles Darwin’s expedition. The English East India from the 1780s to the 1830s made numerous trips between the United Kingdom and China and India, with the ship crews recording weather measurements in their log books. Other expeditions to Antarctica provide rare historical measurements for that region of the world.

By utilizing a crowdsourcing approach, the Old Weather project team aims to use the collective efforts of public participation to gather data and to fact check data recorded from log books. There are 250,000 log books stored in the United Kingdom alone. Clive Wilkinson, a climate historian and research manager for the Recovery of Logbooks and International Marine Data (RECLAIM) Project, a part of NOAA’s Climate Database Modernisation Program, notes there are billions of unrecorded weather observations stored in logbooks around the world that could be captured and use to better climate prediction models.

In addition to climate data, I suspect that ships logs would make interesting records to dovetail, using a topic map, with other records, such as of ports, along their voyages.

Tracking the identities of passengers and crew, cargoes, social events/conditions along the way.

Standing on their own, logs and other historical materials are of interest, but integrated with other historical records a fuller historical tapestry emerges.

March 22, 2013

DataONE

Filed under: Climate Data,Environment — Patrick Durusau @ 9:13 am

DataONE

From the “about” page:

Data Observation Network for Earth (DataONE) is the foundation of new innovative environmental science through a distributed framework and sustainable cyberinfrastructure that meets the needs of science and society for open, persistent, robust, and secure access to well-described and easily discovered Earth observational data.

Supported by the U.S. National Science Foundation (Grant #OCI-0830944) as one of the initial DataNets, DataONE will ensure the preservation, access, use and reuse of multi-scale, multi-discipline, and multi-national science data via three primary cyberinfrastucture elements and a broad education and outreach program.

“…preservation, access, use and reuse of multi-scale, multi-discipline, and multi-national science data….”

Sounds like they are playing our song!

See also: DataONE: Survey of Earth Scientists, To Share or Not to Share Data, abstract of a poster from the American Geophysical Union, Fall Meeting 2010, abstract #IN11A-1062.

Interesting summary of the current data habits and preferences of scientists.

Starting point for shaping a topic map solution to problems as perceived by a group of users.

November 26, 2012

Climate Data Guide:…

Filed under: Climate Data,Data — Patrick Durusau @ 5:35 am

Climate Data Guide: Climate data strengths, limitations and applications

From the homepage:

Like an insider’s guidebook to an unexplored country, the Climate Data Guide provides the key insights needed to select the data that best align with your goals, including critiques of data sets by experts from the research community. We invite you to learn from their insights and share your own.

There are one hundred and eleven data sets as of today on this site. Some satellite based sets, other from other sources.

Another resource that you may want to map together with other resources.

Produced by the National Center for Atmospheric Research.

Public FLUXNET Dataset Information

Filed under: Climate Data,Data — Patrick Durusau @ 5:33 am

Public FLUXNET Dataset Information

From the webpage:

Flux and meteorological data, collected world‐wide, are submitted to this central database (www.fluxdata.org). These data are: a) checked for quality; b) gaps are filled; c) valueadded products, like ecosystem photosynthesis and respiration, are produced; and d) daily and annual sums, or averages, are computed [Agarwal et al., 2010]. The resulting datasets are available through this site for data synthesis. This page provides information about the FLUXNET synthesis datasets, the sites that contributed data, how to use the datasets, and the synthesis efforts using the datasets.

I encountered this while searching for more information on biological flux data and thought I should pass it along.

If you are interested in climate data, definitely a stop you want to make!

Powered by WordPress