Another Word For It Patrick Durusau on Topic Maps and Semantic Diversity

February 1, 2017

Staying Current in Bioinformatics & Genomics: 2017 Edition

Filed under: Bioinformatics,Genomics — Patrick Durusau @ 8:31 pm

Staying Current in Bioinformatics & Genomics: 2017 Edition by Stephen Turner.

From the post:

A while back I wrote this post about how I stay current in bioinformatics & genomics. That was nearly five years ago. A lot has changed since then. A few links are dead. Some of the blogs or Twitter accounts I mentioned have shifted focus or haven’t been updated in years (guilty as charged). The way we consume media has evolved — Google thought they could kill off RSS (long live RSS!), there are many new literature alert services, preprints have really taken off in this field, and many more scientists are engaging via social media than before.

People still frequently ask me how I stay current and keep a finger on the pulse of the field. I’m not claiming to be able to do this well — that’s a near-impossible task for anyone. Five years later and I still run our bioinformatics core, and I’m still mostly focused on applied methodology and study design rather than any particular phenotype, model system, disease, or specific method. It helps me to know that transcript-level estimates improve gene-level inferences from RNA-seq data, and that there’s software to help me do this, but the details underlying kmer shredding vs pseudoalignment to a transcriptome de Bruijn graph aren’t as important to me as knowing that there’s a software implementation that’s well documented, actively supported, and performs well in fair benchmarks. As such, most of what I pay attention to is applied/methods-focused.

What follows is a scattershot, noncomprensive guide to the people, blogs, news outlets, journals, and aggregators that I lean on in an attempt to stay on top of things. I’ve inevitably omitted some key resources, so please don’t be offended if you don’t see your name/blog/Twitter/etc. listed here (drop a link in the comments!). Whatever I write here now will be out of date in no time, so I’ll try to write an update post every year instead of every five.
… (emphasis in original)

Pure gold as is always the case with Stephen’s posts.

Stephen spends an hour everyday scanning his list of resources.

Taking his list as a starting point, what capabilities would you build into a dashboard to facilitate that daily review?

January 12, 2017

Applied Computational Genomics Course at UU: Spring 2017

Filed under: Bioinformatics,Computational Biology,Genomics — Patrick Durusau @ 9:39 pm

Applied Computational Genomics Course at UU: Spring 2017 by Aaron Quinlan.

I initially noticed this resource from posts on the two part Introduction to Unix (part 1) and Introduction to Unix (part 2).

Both of which are too elementary for you but something you can pass onto others. They do give you an idea of the Unix skill level required for the rest of the course.

From the GitHub page:

This course will provide a comprehensive introduction to fundamental concepts and experimental approaches in the analysis and interpretation of experimental genomics data. It will be structured as a series of lectures covering key concepts and analytical strategies. A diverse range of biological questions enabled by modern DNA sequencing technologies will be explored including sequence alignment, the identification of genetic variation, structural variation, and ChIP-seq and RNA-seq analysis. Students will learn and apply the fundamental data formats and analysis strategies that underlie computational genomics research. The primary goal of the course is for students to be grounded in theory and leave the course empowered to conduct independent genomic analyses. (emphasis in the original)

I take it successful completion will also enable you to intelligently question genomic analyses by others.

The explosive growth of genomics makes that a valuable skill in public discussions as well something nice for your toolbox.

February 24, 2016

Open-Source Sequence Clustering Methods Improve the State Of the Art

Open-Source Sequence Clustering Methods Improve the State Of the Art by Evguenia Kopylova et al.

Abstract:

Sequence clustering is a common early step in amplicon-based microbial community analysis, when raw sequencing reads are clustered into operational taxonomic units (OTUs) to reduce the run time of subsequent analysis steps. Here, we evaluated the performance of recently released state-of-the-art open-source clustering software products, namely, OTUCLUST, Swarm, SUMACLUST, and SortMeRNA, against current principal options (UCLUST and USEARCH) in QIIME, hierarchical clustering methods in mothur, and USEARCH’s most recent clustering algorithm, UPARSE. All the latest open-source tools showed promising results, reporting up to 60% fewer spurious OTUs than UCLUST, indicating that the underlying clustering algorithm can vastly reduce the number of these derived OTUs. Furthermore, we observed that stringent quality filtering, such as is done in UPARSE, can cause a significant underestimation of species abundance and diversity, leading to incorrect biological results. Swarm, SUMACLUST, and SortMeRNA have been included in the QIIME 1.9.0 release.

IMPORTANCE Massive collections of next-generation sequencing data call for fast, accurate, and easily accessible bioinformatics algorithms to perform sequence clustering. A comprehensive benchmark is presented, including open-source tools and the popular USEARCH suite. Simulated, mock, and environmental communities were used to analyze sensitivity, selectivity, species diversity (alpha and beta), and taxonomic composition. The results demonstrate that recent clustering algorithms can significantly improve accuracy and preserve estimated diversity without the application of aggressive filtering. Moreover, these tools are all open source, apply multiple levels of multithreading, and scale to the demands of modern next-generation sequencing data, which is essential for the analysis of massive multidisciplinary studies such as the Earth Microbiome Project (EMP) (J. A. Gilbert, J. K. Jansson, and R. Knight, BMC Biol 12:69, 2014, http://dx.doi.org/10.1186/s12915-014-0069-1).

Bioinformatics has specialized clustering issues but improvements in clustering algorithms are likely to have benefits for others.

Not to mention garage gene hackers, who may benefit more directly.

February 8, 2016

Fast search of thousands of short-read sequencing experiments [NEW! Sequence Bloom Tree]

Filed under: Bioinformatics,Genomics — Patrick Durusau @ 8:02 pm

Fast search of thousands of short-read sequencing experiments by Brad Solomon & Carl Kingsford.

Abstract from the “official” version at Nature Biotechnology (2016):

The amount of sequence information in public repositories is growing at a rapid rate. Although these data are likely to contain clinically important information that has not yet been uncovered, our ability to effectively mine these repositories is limited. Here we introduce Sequence Bloom Trees (SBTs), a method for querying thousands of short-read sequencing experiments by sequence, 162 times faster than existing approaches. The approach searches large data archives for all experiments that involve a given sequence. We use SBTs to search 2,652 human blood, breast and brain RNA-seq experiments for all 214,293 known transcripts in under 4 days using less than 239 MB of RAM and a single CPU. Searching sequence archives at this scale and in this time frame is currently not possible using existing tools.

That will set you back $32 for the full text and PDF.

Or, you can try the unofficial version:

Abstract:

Enormous databases of short-read RNA-seq sequencing experiments such as the NIH Sequence Read Archive (SRA) are now available. However, these collections remain difficult to use due to the inability to search for a particular expressed sequence. A natural question is which of these experiments contain sequences that indicate the expression of a particular sequence such as a gene isoform, lncRNA, or uORF. However, at present this is a computationally demanding question at the scale of these databases.

We introduce an indexing scheme, the Sequence Bloom Tree (SBT), to support sequence-based querying of terabase-scale collections of thousands of short-read sequencing experiments. We apply SBT to the problem of finding conditions under which query transcripts are expressed. Our experiments are conducted on a set of 2652 publicly available RNA-seq experiments contained in the NIH for the breast, blood, and brain tissues, comprising 5 terabytes of sequence. SBTs of this size can be queried for a 1000 nt sequence in 19 minutes using less than 300 MB of RAM, over 100 times faster than standard usage of SRA-BLAST and 119 times faster than STAR. SBTs allow for fast identification of experiments with expressed novel isoforms, even if these isoforms were unknown at the time the SBT was built. We also provide some theoretical guidance about appropriate parameter selection in SBT and propose a sampling-based scheme for potentially scaling SBT to even larger collections of files. While SBT can handle any set of reads, we demonstrate the effectiveness of SBT by searching a large collection of blood, brain, and breast RNA-seq files for all 214,293 known human transcripts to identify tissue-specific transcripts.

The implementation used in the experiments below is in C++ and is available as open source at http://www.cs.cmu.edu/∼ckingsf/software/bloomtree.

You will probably be interested in review comments by C. Titus Brown, Thoughts on Sequence Bloom Trees.

As of today, the exact string “Sequence Bloom Tree” gathers only 207 “hits” so the literature is still small enough to be read.

Don’t delay overlong pursuing this new search technique!

I first saw this in a tweet by Stephen Turner.

January 22, 2015

The Leek group guide to genomics papers

Filed under: Computational Biology,Genomics — Patrick Durusau @ 2:54 pm

The Leek group guide to genomics papers by Jeff Leek.

From the webpage:

When I was a student, my advisor John Storey made a list of papers for me to read on nights and weekends. That list was incredibly helpful for a couple of reasons.

  • It got me caught up on the field of computational genomics
  • It was expertly curated, so it filtered a lot of papers I didn’t need to read
  • It gave me my first set of ideas to try to pursue as I was reading the papers

I have often thought I should make a similar list for folks who may want to work wtih me (or who want to learn about statistical genomics). So this is my attempt at that list. I’ve tried to separate the papers into categories and I’ve probably missed important papers. I’m happy to take suggestions for the list, but this is primarily designed for people in my group so I might be a little bit parsimonious.

(reading list follows)

A very clever idea!

The value of such a list, when compared to the World Wide Web is that it is “curated.” Someone who knows the field has chosen and hopefully chosen well, from all the possible resources you could consult. By attending to those resources and not the page rank randomness of search results, you should get a more rounded view of a particular area.

I find such lists from time to time but they are often not maintained. Which seriously diminishes their value.

Perhaps the value-add proposition is shifting from making more data (read data, publications, discussion forums) available to filtering the sea of data into useful sized chunks. The user can always seek out more, but is enabled to start with a manageable and useful portion at first.

Hmmm, think of it as a navigational map, which lists longitude/latitude and major features. A that as you draw closer to any feature or upon request, can change its “resolution” to disclose more information about your present and impeding location.

For what area would you want to build such a navigational map?

I first saw this in a tweet by Christophe Lalanne

January 14, 2015

ExAC Browser (Beta) | Exome Aggregation Consortium

Filed under: Bioinformatics,Genome,Genomics — Patrick Durusau @ 4:38 pm

ExAC Browser (Beta) | Exome Aggregation Consortium

From the webpage:

The Exome Aggregation Consortium (ExAC) is a coalition of investigators seeking to aggregate and harmonize exome sequencing data from a wide variety of large-scale sequencing projects, and to make summary data available for the wider scientific community.

The data set provided on this website spans 61,486 unrelated individuals sequenced as part of various disease-specific and population genetic studies. The ExAC Principal Investigators and groups that have contributed data to the current release are listed here.

All data here are released under a Fort Lauderdale Agreement
for the benefit of the wider biomedical community – see the terms of use here.

Sign up for our mailing list for future release announcements here.

“Big data” is so much more than “likes,” “clicks,” “visits,” “views,” etc.

I first saw this in a tweet by Mark McCarthy.

January 6, 2015

Google Maps For The Genome

Filed under: Deep Learning,Genomics,Machine Learning — Patrick Durusau @ 2:28 pm

This man is trying to build Google Maps for the genome by Daniela Hernandez.

From the post:

The Human Genome Project was supposed to unlock all of life’s secrets. Once we had a genetic roadmap, we’d be able to pinpoint why we got ill and figure out how to fix our maladies.

That didn’t pan out. Ten years and more than $4 billion dollars later, we got the equivalent of a medieval hand-drawn map when what we needed was Google Maps.

“Even though we had the text of the genome, people didn’t know how to interpret it, and that’s really puzzled scientists for the last decade,” said Brendan Frey, a computer scientist and medical researcher at the University of Toronto. “They have no idea what it means.”

For the past decade, Frey has been on a quest to build scientists a sort of genetic step-by-step navigation system for the genome, powered by some of the same artificial-intelligence systems that are now being used by big tech companies like Google, Facebook, Microsoft, IBM and Baidu for auto-tagging images, processing language, and showing consumers more relevant online ads.

Today Frey and his team are unveiling a new artificial intelligence system in the top-tier academic journal Science that’s capable of predicting how mutations in the DNA affect something called gene splicing in humans. That’s important because many genetic diseases–including cancers and spinal muscular atrophy, a leading cause of infant mortality–are the result of gene splicing gone wrong.

“It’s a turning point in the field,” said Terry Sejnowski, a computational neurobiologist at the Salk Institute in San Diego and a long-time machine learning researcher. “It’s bringing to bear a completely new set of techniques, and that’s when you really make advances.”

Those leaps could include better personalized medicine. Imagine you have a rare disease doctors suspect might be genetic but that they’ve never seen before. They could sequence your genome, feed the algorithm your data, and, in theory, it would give doctors insights into what’s gone awry with your genes–maybe even how to fix things.

For now, the system can only detect one minor genetic pathway for diseases, but the platform can be generalized to other areas, says Frey, and his team is already working on that.

I really like the line:

Ten years and more than $4 billion dollars later, we got the equivalent of a medieval hand-drawn map when what we needed was Google Maps.

Daniela gives a high level view of deep learning and its impact on genomic research. There is still much work to be done but it sounds very promising.

I tried to find a non-paywall copy of Frey’s most recent publication in Science but to no avail. After all, the details of such a break trough couldn’t possibly interest anyone other than subscribers to Science.

In lieu of the details, I did find an image on the Frey Lab. Probabilistic and Statistical Inference Group, University of Toronto page:

Frey-genomics

I am very sympathetic to publishers making money. At one time I worked for a publisher and they have to pay for staff and that involves making money. However, hoarding information to which publishers contribute so little, isn’t a good model. Leaving public access to one side, specialty publishers have a fragile economic position based on their subscriber base.

An alternative model to managing individual and library subscriptions would be to site license their publications to national governments over the WWW. Their publications would become expected resources in every government library and used by everyone who had an interest in the subject. A stable source of income (governments), becoming part of the expected academic infrastructure, much wider access to a broader audience, with additional revenue from anyone who wanted a print copy.

Sorry, a diversion from the main point, which is an important success story about deep learning.

I first saw this in a tweet by Nikhil Buduma.

December 19, 2014

A non-comprehensive list of awesome things other people did in 2014

Filed under: Data Analysis,Genomics,R,Statistics — Patrick Durusau @ 1:38 pm

A non-comprehensive list of awesome things other people did in 2014 by Jeff Leek.

Thirty-eight (38) top resources from 2014! Ranging from data analysis and statistics to R and genomics and places in between.

If you missed or overlooked any of these resources during 2014, take the time to correct that error!

Thanks Jeff!

I first saw this in a tweet by Nicholas Horton.

October 23, 2014

Avoiding “Hive” Confusion

Filed under: BigData,Bioinformatics,Genomics,Hive — Patrick Durusau @ 6:46 pm

Depending on your community, when you hear “Hive,” you think “Apache Hive:”

The Apache Hive ™ data warehouse software facilitates querying and managing large datasets residing in distributed storage. Hive provides a mechanism to project structure onto this data and query the data using a SQL-like language called HiveQL. At the same time this language also allows traditional map/reduce programmers to plug in their custom mappers and reducers when it is inconvenient or inefficient to express this logic in HiveQL.

But, there is another “Hive,” which handles large datasets:

High-performance Integrated Virtual Environment (HIVE) is a specialized platform being developed/implemented by Dr. Simonyan’s group at FDA and Dr. Mazumder’s group at GWU where the storage library and computational powerhouse are linked seamlessly. This environment provides web access for authorized users to deposit, retrieve, annotate and compute on HTS data and analyze the outcomes using web-interface visual environments appropriately built in collaboration with research scientists and regulatory personnel.

I ran across this potential source of confusion earlier today and haven’t run it completely to ground but wanted to share some of what I have found so far.

Inside the HIVE, the FDA’s Multi-Omics Compute Architecture by Aaron Krol.

From the post:

“HIVE is not just a conventional virtual cloud environment,” says Simonyan. “It’s a different system that virtualizes the services.” Most cloud systems store data on multiple servers or compute units until users want to run a specific application. At that point, the relevant data is moved to a server that acts as a node for that computation. By contrast, HIVE recognizes which storage nodes contain data selected for analysis, then transfers executable code to those nodes, a relatively small task that allows computation to be performed wherever the data is stored. “We make the computations on exactly the machines where the data is,” says Simonyan. “So we’re not moving the data to the computational unit, we are moving computation to the data.”

When working with very large packets of data, cloud computing environments can sometimes spend more time on data transfer than on running code, making this “virtualized services” model much more efficient. To function, however, it relies on granular and readily-accessed metadata, so that searching for and collecting together relevant data doesn’t consume large quantities of compute time.

HIVE’s solution is the honeycomb data model, which stores raw NGS data and metadata together on the same network. The metadata — information like the sample, experiment, and run conditions that produced a set of NGS reads — is stored in its own tables that can be extended with as many values as users need to record. “The honeycomb data model allows you to put the entire database schema, regardless of how complex it is, into a single table,” says Simonyan. The metadata can then be searched through an object-oriented API that treats all data, regardless of type, the same way when executing search queries. The aim of the honeycomb model is to make it easy for users to add new data types and metadata fields, without compromising search and retrieval.

Popular consumption piece so next you may want to visit the HIVE site proper.

From the webpage:

HIVE is a cloud-based environment optimized for the storage and analysis of extra-large data, like Next Generation Sequencing data, Mass Spectroscopy files, Confocal Microscopy Images and others.

HIVE uses a variety of advanced scientific and computational visualization graphics, to get the MOST from your HIVE experience you must use a supported browser. These include Internet Explore 8.0 or higher (Internet Explorer 9.0 is recommended), Google Chrome, Mozilla Firefox and Safari.

A few exemplary analytical outputs are displayed below for your enjoyment. But before you can take advantage of all that HIVE has to offer and create these objects for yourself, you’ll need to register.

With A framework for organizing cancer-related variations from existing databases, publications and NGS data using a High-performance Integrated Virtual Environment (HIVE) by Tsung-Jung Wu, et al., you are starting to approach the computational issues of interest for data integration.

From the article:

The forementioned cooperation is difficult because genomics data are large, varied, heterogeneous and widely distributed. Extracting and converting these data into relevant information and comparing results across studies have become an impediment for personalized genomics (11). Additionally, because of the various computational bottlenecks associated with the size and complexity of NGS data, there is an urgent need in the industry for methods to store, analyze, compute and curate genomics data. There is also a need to integrate analysis results from large projects and individual publications with small-scale studies, so that one can compare and contrast results from various studies to evaluate claims about biomarkers.

See also: High-performance Integrated Virtual Environment (Wikipedia) for more leads to the literature.

Heterogeneous data is still at large and people are building solutions. Rather than either/or, what do you think topic maps could bring as a value-add to this project?

I first saw this in a tweet by ChemConnector.
October 13, 2014

The Dirty Little Secret of Cancer Research

Filed under: BigData,Bioinformatics,Genomics,Medical Informatics — Patrick Durusau @ 8:06 pm

The Dirty Little Secret of Cancer Research by Jill Neimark.

From the post:


Across different fields of cancer research, up to a third of all cell lines have been identified as imposters. Yet this fact is widely ignored, and the lines continue to be used under their false identities. As recently as 2013, one of Ain’s contaminated lines was used in a paper on thyroid cancer published in the journal Oncogene.

“There are about 10,000 citations every year on false lines—new publications that refer to or rely on papers based on imposter (human cancer) celllines,” says geneticist Christopher Korch, former director of the University of Colorado’s DNA Sequencing Analysis & Core Facility. “It’s like a huge pyramid of toothpicks precariously and deceptively held together.”

For all the worry about “big data,” where is the concern over “big bad data?”

Or is “big data” too big for correctness of the data to matter?

Once you discover that a paper is based on “imposter (human cancer) celllines,” how do you pass that information along to anyone who attempts to cite the article?

In other words, where do you write down that data about the paper, where the paper is the subject in question?

And how do you propagate that data across a universe of citations?

The post ends on a high note of current improvements but it is far from settled how to prevent reliance on compromised research.

I first saw this in a tweet by Dan Graur

October 10, 2014

Recognizing patterns in genomic data

Filed under: Bioinformatics,Biomedical,Genomics,Medical Informatics — Patrick Durusau @ 3:13 pm

Recognizing patterns in genomic data – New visualization software uncovers cancer subtypes from a vast repository of biomedical information by Stephanie Dutchen.

From the post:

Much of biomedical research these days is about big data—collecting and analyzing vast, detailed repositories of information about health and disease. These data sets can be treasure troves for investigators, often uncovering genetic mutations that drive a particular kind of cancer, for example.

Trouble is, it’s impossible for humans to browse that much data, let alone make any sense of it.

“It’s [StratomeX] a tool to help you make sense of the data you’re collecting and find the right questions to ask,” said Nils Gehlenborg, research associate in biomedical informatics at HMS and co-senior author of the correspondence in Nature Methods. “It gives you an unbiased view of patterns in the data. Then you can explore whether those patterns are meaningful.”

The software, called StratomeX, was developed to help researchers distinguish subtypes of cancer by crunching through the incredible amount of data gathered as part of The Cancer Genome Atlas, a National Institutes of Health–funded initiative. Identifying distinct cancer subtypes can lead to more effective, personalized treatments.

When users input a query, StratomeX compares tumor data at the molecular level that was collected from hundreds of patients and detects patterns that might indicate significant similarities or differences between groups of patients. The software presents those connections in an easy-to-grasp visual format.

“It helps you make meaningful distinctions,” said co-first author Alexander Lex, a postdoctoral researcher in the Pfister group.

Other than the obvious merits of this project, note the the role of software as the assistant to the user. It crunches the numbers in a specific domain and presents those results in a meaningful fashion.

It is up to the user to decide which patters are useful and which are not. Shades of “recommending” other instances of the “same” subject?

StratomeX is available for download.

I first saw this in a tweet by Harvard SEAS.

October 2, 2014

Data Auditing and Contamination in Genome Databases

Filed under: Data Auditing,Data Contamination,Genome,Genomics — Patrick Durusau @ 3:50 pm

Contamination of genome databases highlight the need for data auditing trails.

Consider:

Abundant Human DNA Contamination Identified in Non-Primate Genome Databases by Mark S. Longo, Michael J. O’Neill, Rachel J. O’Neill (rachel.oneill@uconn.edu). (Longo MS, O’Neill MJ, O’Neill RJ (2011) Abundant Human DNA Contamination Identified in Non-Primate Genome Databases. PLoS ONE 6(2): e16410. doi:10.1371/journal.pone.0016410) (herein, Longo.

During routine screens of the NCBI databases using human repetitive elements we discovered an unlikely level of nucleotide identity across a broad range of phyla. To ascertain whether databases containing DNA sequences, genome assemblies and trace archive reads were contaminated with human sequences, we performed an in depth search for sequences of human origin in non-human species. Using a primate specific SINE, AluY, we screened 2,749 non-primate public databases from NCBI, Ensembl, JGI, and UCSC and have found 492 to be contaminated with human sequence. These represent species ranging from bacteria (B. cereus) to plants (Z. mays) to fish (D. rerio) with examples found from most phyla. The identification of such extensive contamination of human sequence across databases and sequence types warrants caution among the sequencing community in future sequencing efforts, such as human re-sequencing. We discuss issues this may raise as well as present data that gives insight as to how this may be occurring.

Mining of public sequencing databases supports a non-dietary origin for putative foreign miRNAs: underestimated effects of contamination in NGS. by Tosar JP, Rovira C, Naya H, Cayota A. (RNA. 2014 Jun;20(6):754-7. doi: 10.1261/rna.044263.114. Epub 2014 Apr 11.)

The report that exogenous plant miRNAs are able to cross the mammalian gastrointestinal tract and exert gene-regulation mechanism in mammalian tissues has yielded a lot of controversy, both in the public press and the scientific literature. Despite the initial enthusiasm, reproducibility of these results was recently questioned by several authors. To analyze the causes of this unease, we searched for diet-derived miRNAs in deep-sequencing libraries performed by ourselves and others. We found variable amounts of plant miRNAs in publicly available small RNA-seq data sets of human tissues. In human spermatozoa, exogenous RNAs reached extreme, biologically meaningless levels. On the contrary, plant miRNAs were not detected in our sequencing of human sperm cells, which was performed in the absence of any known sources of plant contamination. We designed an experiment to show that cross-contamination during library preparation is a source of exogenous RNAs. These contamination-derived exogenous sequences even resisted oxidation with sodium periodate. To test the assumption that diet-derived miRNAs were actually contamination-derived, we sought in the literature for previous sequencing reports performed by the same group which reported the initial finding. We analyzed the spectra of plant miRNAs in a small RNA sequencing study performed in amphioxus by this group in 2009 and we found a very strong correlation with the plant miRNAs which they later reported in human sera. Even though contamination with exogenous sequences may be easy to detect, cross-contamination between samples from the same organism can go completely unnoticed, possibly affecting conclusions derived from NGS transcriptomics.

Whether the contamination of these databases is significant or not, is a matter for debate. See the comments to Longo.

Even if errors are “easy to spot,” the question remains for both users and curators of these databases, how to provide data auditing for corrections/updates?

At a minimum, one would expect to know:

  • Database/dataset values for any given date?
  • When values changed?
  • What values changed?
  • Who changed those values?
  • On what basis were the changes made?
  • Comments on the changes
  • Links to literature concerning the changes
  • Do changes have an “audit” trail that includes both the original and new values?

If there is no “audit” trail, on what basis would I “trust” the data on a particular date?

Suggestions on current correction practices?

I first saw this in a post by Mick Watson.

October 1, 2014

FOAM (Functional Ontology Assignments for Metagenomes):…

Filed under: Bioinformatics,Genomics,Ontology — Patrick Durusau @ 4:43 pm

FOAM (Functional Ontology Assignments for Metagenomes): a Hidden Markov Model (HMM) database with environmental focus by Emmanuel Prestat, et al. (Nucl. Acids Res. (2014) doi: 10.1093/nar/gku702 )

Abstract:

A new functional gene database, FOAM (Functional Ontology Assignments for Metagenomes), was developed to screen environmental metagenomic sequence datasets. FOAM provides a new functional ontology dedicated to classify gene functions relevant to environmental microorganisms based on Hidden Markov Models (HMMs). Sets of aligned protein sequences (i.e. ‘profiles’) were tailored to a large group of target KEGG Orthologs (KOs) from which HMMs were trained. The alignments were checked and curated to make them specific to the targeted KO. Within this process, sequence profiles were enriched with the most abundant sequences available to maximize the yield of accurate classifier models. An associated functional ontology was built to describe the functional groups and hierarchy. FOAM allows the user to select the target search space before HMM-based comparison steps and to easily organize the results into different functional categories and subcategories. FOAM is publicly available at http://portal.nersc.gov/project/m1317/FOAM/.

Aside from its obvious importance for genomics and bioinformatics, I mention this because the authors point out:

A caveat of this approach is that we did not consider the quality of the tree in the tree-splitting step (i.e. weakly supported branches were equally treated as strongly supported ones), producing models of different qualities. Nevertheless, we decided that the approach of rational classification is better than no classification at all. In the future, the groups could be recomputed, or split more optimally when more data become available (e.g. more KOs). From each cluster related to the KO in process, we extracted the alignment from which HMMs were eventually built.

I take that to mean that this “ontology” represents no unchanging ground truth but rather an attempt to enhance the “…screening of environmental metagenomic and metatranscriptomic sequence datasets for functional genes.”

As more information is gained, the present “ontology” can and will change. Those future changes create the necessity to map those changes and the facts that drove them.

I first saw this in a tweet by Jonathan Eisen

August 28, 2014

Thou Shalt Share!

Filed under: Bioinformatics,Genome,Genomics,Open Data — Patrick Durusau @ 1:46 pm

NIH Tells Genomic Researchers: ‘You Must Share Data’ by Paul Basken.

From the post:

Scientists who use government money to conduct genomic research will now be required to quickly share the data they gather under a policy announced on Wednesday by the National Institutes of Health.

The data-sharing policy, which will take effect with grants awarded in January, will give agency-financed researchers six months to load any genomic data they collect—from human or nonhuman subjects—into a government-established database or a recognized alternative.

NIH officials described the move as the latest in a series of efforts by the federal government to improve the efficiency of taxpayer-financed research by ensuring that scientific findings are shared as widely as possible.

“We’ve gone from a circumstance of saying, ‘Everybody should share data,’ to now saying, in the case of genomic data, ‘You must share data,’” said Eric D. Green, director of the National Human Genome Research Institute at the NIH.

A step in the right direction!

Waiting for other government funding sources and private funders (including in the humanities) to take the same step.

I first saw this in a tweet by Kevin Davies.

August 8, 2014

Genomics Standards Consortium

Filed under: Bioinformatics,Genomics — Patrick Durusau @ 4:13 pm

Genomics Standards Consortium

From the homepage:

The Genomic Standards Consortium ( GSC) is an open-membership working body formed in September 2005. The goal of this International community is to promote mechanisms that standardize the description of genomes and the exchange and integration of genomic data.

This was cited in Genomic Encyclopedia of Bacteria….

If you are interested in the “exchange and integration of genomic data,” you will find a number of projects of interest to you.

Naming issues are everywhere but they get more attention, at least for the moment, in science and related areas.

I would not push topic maps syntax but I would suggest that capturing what a reasonable person thinks when identifying a subject, their inner checklist of properties as it were, will assist others in comparing their internal checklist of properties.

If that “inner” list isn’t written down, there is nothing on which to make a comparison.

Genomic Encyclopedia of Bacteria…

Filed under: Bioinformatics,Biology,Genomics — Patrick Durusau @ 4:03 pm

Genomic Encyclopedia of Bacteria and Archaea: Sequencing a Myriad of Type Strains by Nikos C. Kyrpides, et al. (Kyrpides NC, Hugenholtz P, Eisen JA, Woyke T, Göker M, et al. (2014) Genomic Encyclopedia of Bacteria and Archaea: Sequencing a Myriad of Type Strains. PLoS Biol 12(8): e1001920. doi:10.1371/journal.pbio.1001920)

Abstract:

Microbes hold the key to life. They hold the secrets to our past (as the descendants of the earliest forms of life) and the prospects for our future (as we mine their genes for solutions to some of the planet’s most pressing problems, from global warming to antibiotic resistance). However, the piecemeal approach that has defined efforts to study microbial genetic diversity for over 20 years and in over 30,000 genome projects risks squandering that promise. These efforts have covered less than 20% of the diversity of the cultured archaeal and bacterial species, which represent just 15% of the overall known prokaryotic diversity. Here we call for the funding of a systematic effort to produce a comprehensive genomic catalog of all cultured Bacteria and Archaea by sequencing, where available, the type strain of each species with a validly published name (currently~11,000). This effort will provide an unprecedented level of coverage of our planet’s genetic diversity, allow for the large-scale discovery of novel genes and functions, and lead to an improved understanding of microbial evolution and function in the environment.

While I am a standards advocate, I have to disagree with some of the claims for standards:

Accurate estimates of diversity will require not only standards for data but also standard operating procedures for all phases of data generation and collection [33],[34]. Indeed, sequencing all archaeal and bacterial type strains as a unified international effort will provide an ideal opportunity to implement international standards in sequencing, assembly, finishing, annotation, and metadata collection, as well as achieve consistent annotation of the environmental sources of these type strains using a standard such as minimum information about any (X) sequence (MixS) [27],[29]. Methods need to be rigorously challenged and validated to ensure that the results generated are accurate and likely reproducible, without having to reproduce each point. With only a few exceptions [27],[29], such standards do not yet exist, but they are in development under the auspices of the Genomics Standards Consortium (e.g., the M5 initiative) (http://gensc.org/gc_wiki/index.php/M5) [35]. Without the vehicle of a grand-challenge project such as this one, adoption of international standards will be much less likely.

Some standardization will no doubt be beneficial but for the data that is collected, a topic map informed approach where critical subjects are identified not be surface tokens but by key/value pairs would be much better.

In part because there is always legacy data and too little time and funding to back fit every change in present terminology to past names. Or should I say it hasn’t happen outside of one specialized chemical index that comes to mind.

July 21, 2014

Christmas in July?

Filed under: Bioinformatics,Genome,Genomics — Patrick Durusau @ 4:18 pm

It won’t be Christmas in July but bioinformatics folks will feel like it with the release of the full annotation of the human genome assembly (GRCh38) due to drop at the end of July 2014.

Dan Murphy covers progress on the annotation and information about the upcoming release in: The new human annotation is almost here!

This is an important big data set.

How would you integrate it with other data sets?

I first saw this in a tweet by Neil Saunders.

July 2, 2014

circlize implements and enhances circular visualization in R

Filed under: Bioinformatics,Genomics,Multidimensional,R,Visualization — Patrick Durusau @ 6:03 pm

circlize implements and enhances circular visualization in R by Zuguang Gu, et al.

Abstract:

Summary: Circular layout is an efficient way for the visualization of huge amounts of genomic information. Here we present the circlize package, which provides an implementation of circular layout generation in R as well as an enhancement of available software. The flexibility of this package is based on the usage of low-level graphics functions such that self-defined high-level graphics can be easily implemented by users for specific purposes. Together with the seamless connection between the powerful computational and visual environment in R, circlize gives users more convenience and freedom to design figures for better understanding genomic patterns behind multi-dimensional data.

Availability and implementation: circlize is available at the Comprehensive R Archive Network (CRAN): http://cran.r-project.org/web/packages/circlize/

The article is behind a paywall but fortunately, the R code is not!

I suspect I know which one will get more “hits.” 😉

Useful for exploring multidimensional data as well as presenting multidimensional data encoded using a topic map.

Sometimes displaying information as nodes and edges isn’t the best display.

Remember the map of Napoleon’s invasion of Russia?

napoleon - russia

You could display the same information with nodes (topics) and associations (edges) but it would not be nearly as compelling.

Although, you could make the same map a “cover” for the topics (read people) associated with segments of the map, enabling a reader to take in the whole map and then drill down to the detail for any location or individual.

It would still be a topic map, even though its primary rendering would not be as nodes and edges.

April 20, 2014

Google Genomics Preview

Filed under: Bioinformatics,Genomics — Patrick Durusau @ 3:40 pm

Google Genomics Preview by Kevin.

From the post:

Welcome to the Google Genomics Preview! You’ve been approved for early access to the API.

The goal of the Genomics API is to encourage interoperability and build a foundation to store, process, search, analyze and share tens of petabytes of genomic data.

We’ve loaded sample data from public BAM files:

  • The complete 1000 Genomes Project
  • Selections from the Personal Genome Project

How to get started:

You will need to obtain an invitation to being playing.

Don’t be disappointed that Google is moving into genomics.

After all, gathering data and supplying a processing back-end for it is a critical task but not a terribly imaginative one.

The analysis you perform and the uses you enable, that’s the part that takes imagination.

April 14, 2014

tagtog: interactive and text-mining-assisted annotation…

Filed under: Annotation,Biomedical,Genomics,Text Mining — Patrick Durusau @ 8:55 am

tagtog: interactive and text-mining-assisted annotation of gene mentions in PLOS full-text articles by Juan Miguel Cejuela, et al.

Abstract:

The breadth and depth of biomedical literature are increasing year upon year. To keep abreast of these increases, FlyBase, a database for Drosophila genomic and genetic information, is constantly exploring new ways to mine the published literature to increase the efficiency and accuracy of manual curation and to automate some aspects, such as triaging and entity extraction. Toward this end, we present the ‘tagtog’ system, a web-based annotation framework that can be used to mark up biological entities (such as genes) and concepts (such as Gene Ontology terms) in full-text articles. tagtog leverages manual user annotation in combination with automatic machine-learned annotation to provide accurate identification of gene symbols and gene names. As part of the BioCreative IV Interactive Annotation Task, FlyBase has used tagtog to identify and extract mentions of Drosophila melanogaster gene symbols and names in full-text biomedical articles from the PLOS stable of journals. We show here the results of three experiments with different sized corpora and assess gene recognition performance and curation speed. We conclude that tagtog-named entity recognition improves with a larger corpus and that tagtog-assisted curation is quicker than manual curation.

Database URL: www.tagtog.net, www.flybase.org.

Encouraging because the “tagging” is not wholly automated nor is it wholly hand-authored. Rather the goal is to create an interface that draws on the strengths of automated processing as moderated by human expertise.

Annotation remains at a document level, which consigns subsequent users to mining full text but this is definitely a step in the right direction.

February 24, 2014

GenomeBrowse

Filed under: Bioinformatics,Genomics,Interface Research/Design,Visualization — Patrick Durusau @ 4:36 pm

GenomeBrowse

From the webpage:

Golden Helix GenomeBrowse® visualization tool is an evolutionary leap in genome browser technology that combines an attractive and informative visual experience with a robust, performance-driven backend. The marriage of these two equally important components results in a product that makes other browsers look like 1980s DOS programs.

Visualization Experience Like Never Before

GenomeBrowse makes the process of exploring DNA-seq and RNA-seq pile-up and coverage data intuitive and powerful. Whether viewing one file or many, an integrated approach is taken to exploring your data in the context of rich annotation tracks.

This experience features:

  • Zooming and navigation controls that are natural as they mimic panning and scrolling actions you are familiar with.
  • Coverage and pile-up views with different modes to highlight mismatches and look for strand bias.
  • Deep, stable stacking algorithms to look at all reads in a pile-up zoom, not just the first 10 or 20.
  • Context-sensitive information by clicking on any feature. See allele frequencies in control databases, functional predictions of a non-synonymous variants, exon positions of genes, or even details of a single sequenced read.
  • A dynamic labeling system which gives optimal detail on annotation features without cluttering the view.
  • The ability to automatically index and compute coverage data on BAM or VCF files in the background.

I’m very interested in seeing how the interface fares in the bioinformatics domain. Every domain is different but there may be some cross-over in term of popular UI features.

I first saw this in a tweet by Neil Saunders.

February 23, 2014

Data Analysis for Genomics MOOC

Filed under: Data Analysis,Genomics,R — Patrick Durusau @ 2:48 pm

Data Analysis for Genomics MOOC by Stephen Turner.

HarvardX: Data Analysis for Genomics
April 7, 2014.

From the post:

Last month I told you about Coursera’s specializations in data science, systems biology, and computing. Today I was reading Jeff Leek’s blog post defending p-values and found a link to HarvardX’s Data Analysis for Genomics course, taught by Rafael Irizarry and Mike Love. Here’s the course description:

If you’ve ever wanted to get started with data analysis in genomics and you’d learn R along the way, this looks like a great place to start. The course is set to start April 7, 2014.

A threefer: genomics, R and noticing what subjects are unidentified in current genomics practices. Are those subjects important?

If you are worried about the PH207x prerequisite, take a look at: PH207x Health in Numbers: Quantitative Methods in Clinical & Public Health Research. It’s an archived course but still accessible for self-study.

A slow walk through Ph207x will give you a broad exposure to methods in clinical and public health research.

is t

January 26, 2014

EVEX

Filed under: Bioinformatics,Biomedical,Genomics — Patrick Durusau @ 8:25 pm

EVEX

From the about page:

EVEX is a text mining resource built on top of PubMed abstracts and PubMed Central full text articles. It contains over 40 million bio-molecular events among more than 76 million automatically extracted gene/protein name mentions. The text mining data further has been enriched with gene identifiers and gene families from Ensembl and HomoloGene, providing homology-based event generalizations. EVEX presents both direct and indirect associations between genes and proteins, enabling explorative browsing of relevant literature.

Ok, it’s not web-scale but it is important information. 😉

What I find the most interesting is the “…direct and indirect associations between genes and proteins, enabling explorative browsing of the relevant literature.”

See their tutorial on direct and indirect associations.

I think part of the lesson here is that no matter how gifted, a topic map with static associations limits a user’s ability to explore the infoverse.

That may work quite well where uniform advice, even if incorrect, is preferred over exploration. However, in rapidly changing areas like medical research, static associations could be more of a hindrance than a boon.

January 6, 2014

Needles in Stacks of Needles:…

Filed under: Bioinformatics,Biomedical,Genomics,Searching,Visualization — Patrick Durusau @ 3:33 pm

Needles in Stacks of Needles: genomics + data mining by Martin Krzywinski. (ICDM2012 Keynote)

Abstract:

In 2001, the first human genome sequence was published. Now, just over 10 years later, we capable of sequencing a genome in just a few days. Massive parallel sequencing projects now make it possible to study the cancers of thousands of individuals. New data mining approaches are required to robustly interrogate the data for causal relationships among the inherently noisy biology. How does one identify genetic changes that are specific and causal to a disease within the rich variation that is either natural or merely correlated? The problem is one of finding a needle in a stack of needles. I will provide a non-specialist introduction to data mining methods and challenges in genomics, with a focus on the role visualization plays in the exploration of the underlying data.

This page links to the slides Martin used in his presentation.

Excellent graphics and a number of amusing points, even without the presentation itself:

Cheap Data: A fruit fly that expresses high sensitivity to alcohol.

Kenny: A fruit fly without this gene dies in two days, named for the South Park character who dies in each episode.

Ken and Barbie: Fruit flys that fail to develop external genitalia.

One observation that rings true across disciplines:

Literature is still largely composed and published opaquely.

I searched for a video recording of the presentation but came up empty.

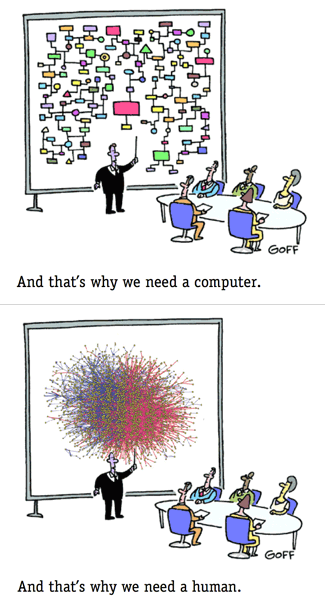
Need a Human

Filed under: Bioinformatics,Biomedical,Genomics — Patrick Durusau @ 11:38 am

Need a Human

Shamelessly stolen from Martin Krzywinski’s ICDM2012 Keynote — Needles in Stacks of Needles.

I am about to post on that keynote but thought the image merited a post of its own.

December 2, 2013

NIH deposits first batch of genomic data for Alzheimer’s disease

Filed under: Bioinformatics,Genomics,Medical Informatics — Patrick Durusau @ 5:44 pm

NIH deposits first batch of genomic data for Alzheimer’s disease

From the post:

Researchers can now freely access the first batch of genome sequence data from the Alzheimer’s Disease Sequencing Project (ADSP), the National Institutes of Health (NIH) announced today. The ADSP is one of the first projects undertaken under an intensified national program of research to prevent or effectively treat Alzheimer’s disease.

The first data release includes data from 410 individuals in 89 families. Researchers deposited completed WGS data on 61 families and have deposited WGS data on parts of the remaining 28 families, which will be completed soon. WGS determines the order of all 3 billion letters in an individual’s genome. Researchers can access the sequence data at dbGaP or the National Institute on Aging Genetics of Alzheimer’s Disease Data Storage Site (NIAGADS), https://www.niagads.org.

“Providing raw DNA sequence data to a wide range of researchers proves a powerful crowd-sourced way to find genomic changes that put us at increased risk for this devastating disease,” said NIH Director, Francis S. Collins, M.D., Ph.D., who announced the start of the project in February 2012. “The ADSP is designed to identify genetic risks for late-onset of Alzheimer’s disease, but it could also discover versions of genes that protect us. These insights could lead to a new era in prevention and treatment.”

As many as 5 million Americans 65 and older are estimated to have Alzheimer’s disease, and that number is expected to grow significantly with the aging of the baby boom generation. The National Alzheimer’s Project Act became law in 2011 in recognition of the need to do more to combat the disease. The law called for upgrading research efforts by the public and private sectors, as well as expanding access to and improving clinical and long term care. One of the first actions taken by NIH under Alzheimer’s Act was the allocation of additional funding in fiscal 2012 for a series of studies, including this genome sequencing effort. Today’s announcement marks the first data release from that project.

You will need to join with or enlist in a open project with bioinformatics and genmics expertise to make a contribution but the data is “out there.”

Not to mention the need to integrate existing medical literature, legacy data from prior patients, drug trials, etc., despite usual semantic confusion of the same.

November 26, 2013

Ten Quick Tips for Using the Gene Ontology

Filed under: Bioinformatics,Gene Ontology,Genomics,Ontology — Patrick Durusau @ 10:39 am

Ten Quick Tips for Using the Gene Ontology by Judith A. Blake.

From the post:

The Gene Ontology (GO) provides core biological knowledge representation for modern biologists, whether computationally or experimentally based. GO resources include biomedical ontologies that cover molecular domains of all life forms as well as extensive compilations of gene product annotations to these ontologies that provide largely species-neutral, comprehensive statements about what gene products do. Although extensively used in data analysis workflows, and widely incorporated into numerous data analysis platforms and applications, the general user of GO resources often misses fundamental distinctions about GO structures, GO annotations, and what can and can not be extrapolated from GO resources. Here are ten quick tips for using the Gene Ontology.

Tip 1: Know the Source of the GO Annotations You Use

Tip 2: Understand the Scope of GO Annotations

Tip 3: Consider Differences in Evidence Codes

Tip 4: Probe Completeness of GO Annotations

Tip 5: Understand the Complexity of the GO Structure

Tip 6: Choose Analysis Tools Carefully

Tip 7: Provide the Version of the Data/Tools Used

Tip 8: Seek Input from the GOC Community and Make Use of GOC Resources

Tip 9: Contribute to the GO

Tip 10: Acknowledge the Work of the GO Consortium

See Judith’s article for her comments and pointers under each tip.

The take away here is that an ontology may have the information you are looking for, but understanding what you have found is an entirely different matter.

For GO, follow Judith’s specific suggestions/tips, for any other ontology, take steps to understand the ontology before relying upon it.

I first saw this in a tweet by Stephen Turner.

November 12, 2013

Big Data – Genomics – Bio4j

Filed under: BigData,Bio4j,Bioinformatics,Genomics — Patrick Durusau @ 3:12 pm

Berkeley Phylogenomics Group receives an NSF grant to develop a graph DB for Big Data challenges in genomics building on Bio4j

From the post:

The Sjölander Lab at the University of California, Berkeley, has recently been awarded a 250K US dollars EAGER grant from the National Science Foundation to build a graph database for Big Data challenges in genomics. Naturally, they’re building on Bio4j.

The project “EAGER: Towards a self-organizing map and hyper-dimensional information network for the human genome” aims to create a graph database of genome and proteome data for the human genome and related species to allow biologists and computational biologists to mine the information in gene family trees, biological networks and other graph data that cannot be represented effectively in relational databases. For these goals, they will develop on top of the pioneering graph-based bioinformatics platform Bio4j.

We are excited to see how Bio4j is used by top research groups to build cutting-edge bioinformatics solutions” said Eduardo Pareja, Era7 Bioinformatics CEO. “To reach an even broader user base, we are pleased to announce that we now provide versions for both Neo4j and Titan graph databases, for which we have developed another layer of abstraction for the domain model using Blueprints.”

EAGER stands for Early-concept Grants for Exploratory Research”, explained Professor Kimmen Sjölander, head of the Berkeley Phylogenomics Group: “NSF awards these grants to support exploratory work in its early stages on untested, but potentially transformative, research ideas or approaches”. “My lab’s focus is on machine learning methods for Big Data challenges in biology, particularly for graphical data such as gene trees, networks, pathways and protein structures. The limitations of relational database technologies for graph data, particularly BIG graph data, restrict scientists’ ability to get any real information from that data. When we decided to switch to a graph database, we did a lot of research into the options. When we found out about Bio4j, we knew we’d found our solution. The Bio4j team has made our development tasks so much easier, and we look forward to a long and fruitful collaboration in this open-source project”.

Always nice to see great projects get ahead!

Kudos to the Berkeley Phylogenomics Group!

October 17, 2013

cudaMap:…

Filed under: Bioinformatics,CUDA,Genomics,GPU,NVIDIA,Topic Map Software,Topic Maps — Patrick Durusau @ 3:16 pm

cudaMap: a GPU accelerated program for gene expression connectivity mapping by Darragh G McArt, Peter Bankhead, Philip D Dunne, Manuel Salto-Tellez, Peter Hamilton, Shu-Dong Zhang.

Abstract:

BACKGROUND: Modern cancer research often involves large datasets and the use of sophisticated statistical techniques. Together these add a heavy computational load to the analysis, which is often coupled with issues surrounding data accessibility. Connectivity mapping is an advanced bioinformatic and computational technique dedicated to therapeutics discovery and drug re-purposing around differential gene expression analysis. On a normal desktop PC, it is common for the connectivity mapping task with a single gene signature to take > 2h to complete using sscMap, a popular Java application that runs on standard CPUs (Central Processing Units). Here, we describe new software, cudaMap, which has been implemented using CUDA C/C++ to harness the computational power of NVIDIA GPUs (Graphics Processing Units) to greatly reduce processing times for connectivity mapping.

RESULTS: cudaMap can identify candidate therapeutics from the same signature in just over thirty seconds when using an NVIDIA Tesla C2050 GPU. Results from the analysis of multiple gene signatures, which would previously have taken several days, can now be obtained in as little as 10 minutes, greatly facilitating candidate therapeutics discovery with high throughput. We are able to demonstrate dramatic speed differentials between GPU assisted performance and CPU executions as the computational load increases for high accuracy evaluation of statistical significance.

CONCLUSION: Emerging ‘omics’ technologies are constantly increasing the volume of data and information to be processed in all areas of biomedical research. Embracing the multicore functionality of GPUs represents a major avenue of local accelerated computing. cudaMap will make a strong contribution in the discovery of candidate therapeutics by enabling speedy execution of heavy duty connectivity mapping tasks, which are increasingly required in modern cancer research. cudaMap is open source and can be freely downloaded from http://purl.oclc.org/NET/cudaMap.

Or to put that in lay terms, the goal is to establish the connections between human diseases, genes that underlie them and drugs that treat them.

Going from several days to ten (10) minutes is quite a gain in performance.

This is processing of experimental data but is it a window into techniques for scaling topic maps?

I first saw this in a tweet by Stefano Bertolo.

October 16, 2013

Announcing BioCoder

Filed under: Bioinformatics,Biology,Genomics — Patrick Durusau @ 5:08 pm

Announcing BioCoder by Mike Loukides.

From the post:

We’re pleased to announce BioCoder, a newsletter on the rapidly expanding field of biology. We’re focusing on DIY bio and synthetic biology, but we’re open to anything that’s interesting.

Why biology? Why now? Biology is currently going through a revolution as radical as the personal computer revolution. Up until the mid-70s, computing was dominated by large, extremely expensive machines that were installed in special rooms and operated by people wearing white lab coats. Programming was the domain of professionals. That changed radically with the advent of microprocessors, the homebrew computer club, and the first generation of personal computers. I put the beginning of the shift in 1975, when a friend of mine built a computer in his dorm room. But whenever it started, the phase transition was thorough and radical. We’ve built a new economy around computing: we’ve seen several startups become gigantic enterprises, and we’ve seen several giants collapse because they couldn’t compete with the more nimble startups.

Bioinformatics and amateur genome exploration is growing hobby area. Yes, hobby area.

For background, see: Playing with genes by David Smith.

Your bioinformatics skills, which you learned for cross-over use in other fields, could come in handy.

A couple of resources to get you started:

DYIgenomics

DYI Genomics

Seems like a ripe field for mining and organization.

There is no publication date set on Weaponized Viruses in a Nutshell.

Older Posts »

Powered by WordPress