Lyra Gets its First Visualization Tutorial by Bryan Connor.
From the post:
Before the demo session even began, Tapestry was humming with talk of “Lyra.” A group gathered around Arvind Satyanarayan as he took us for a spin around the tool he helped developed at UW Interactive Data Lab.
It’s just a few day later and the tool’s open source code is up on Github. You can run the app yourself in the browser and now the first tutorial about Lyra has been written.
Jim Vallandingham’s Lyra tutorial is naturally a tentative investigation of an app that is in early alpha. It does a fantastic job of teasing apart the current features of Lyra and making predictions about how it can be used in the future. Some sections are highlighted below.
You will also want to visit:
The Lyra Visualization Design Environment (VDE) alpha by Arvind Satyanarayan, Kanit “Ham” Wongsuphasawat, Jeffrey Heer.
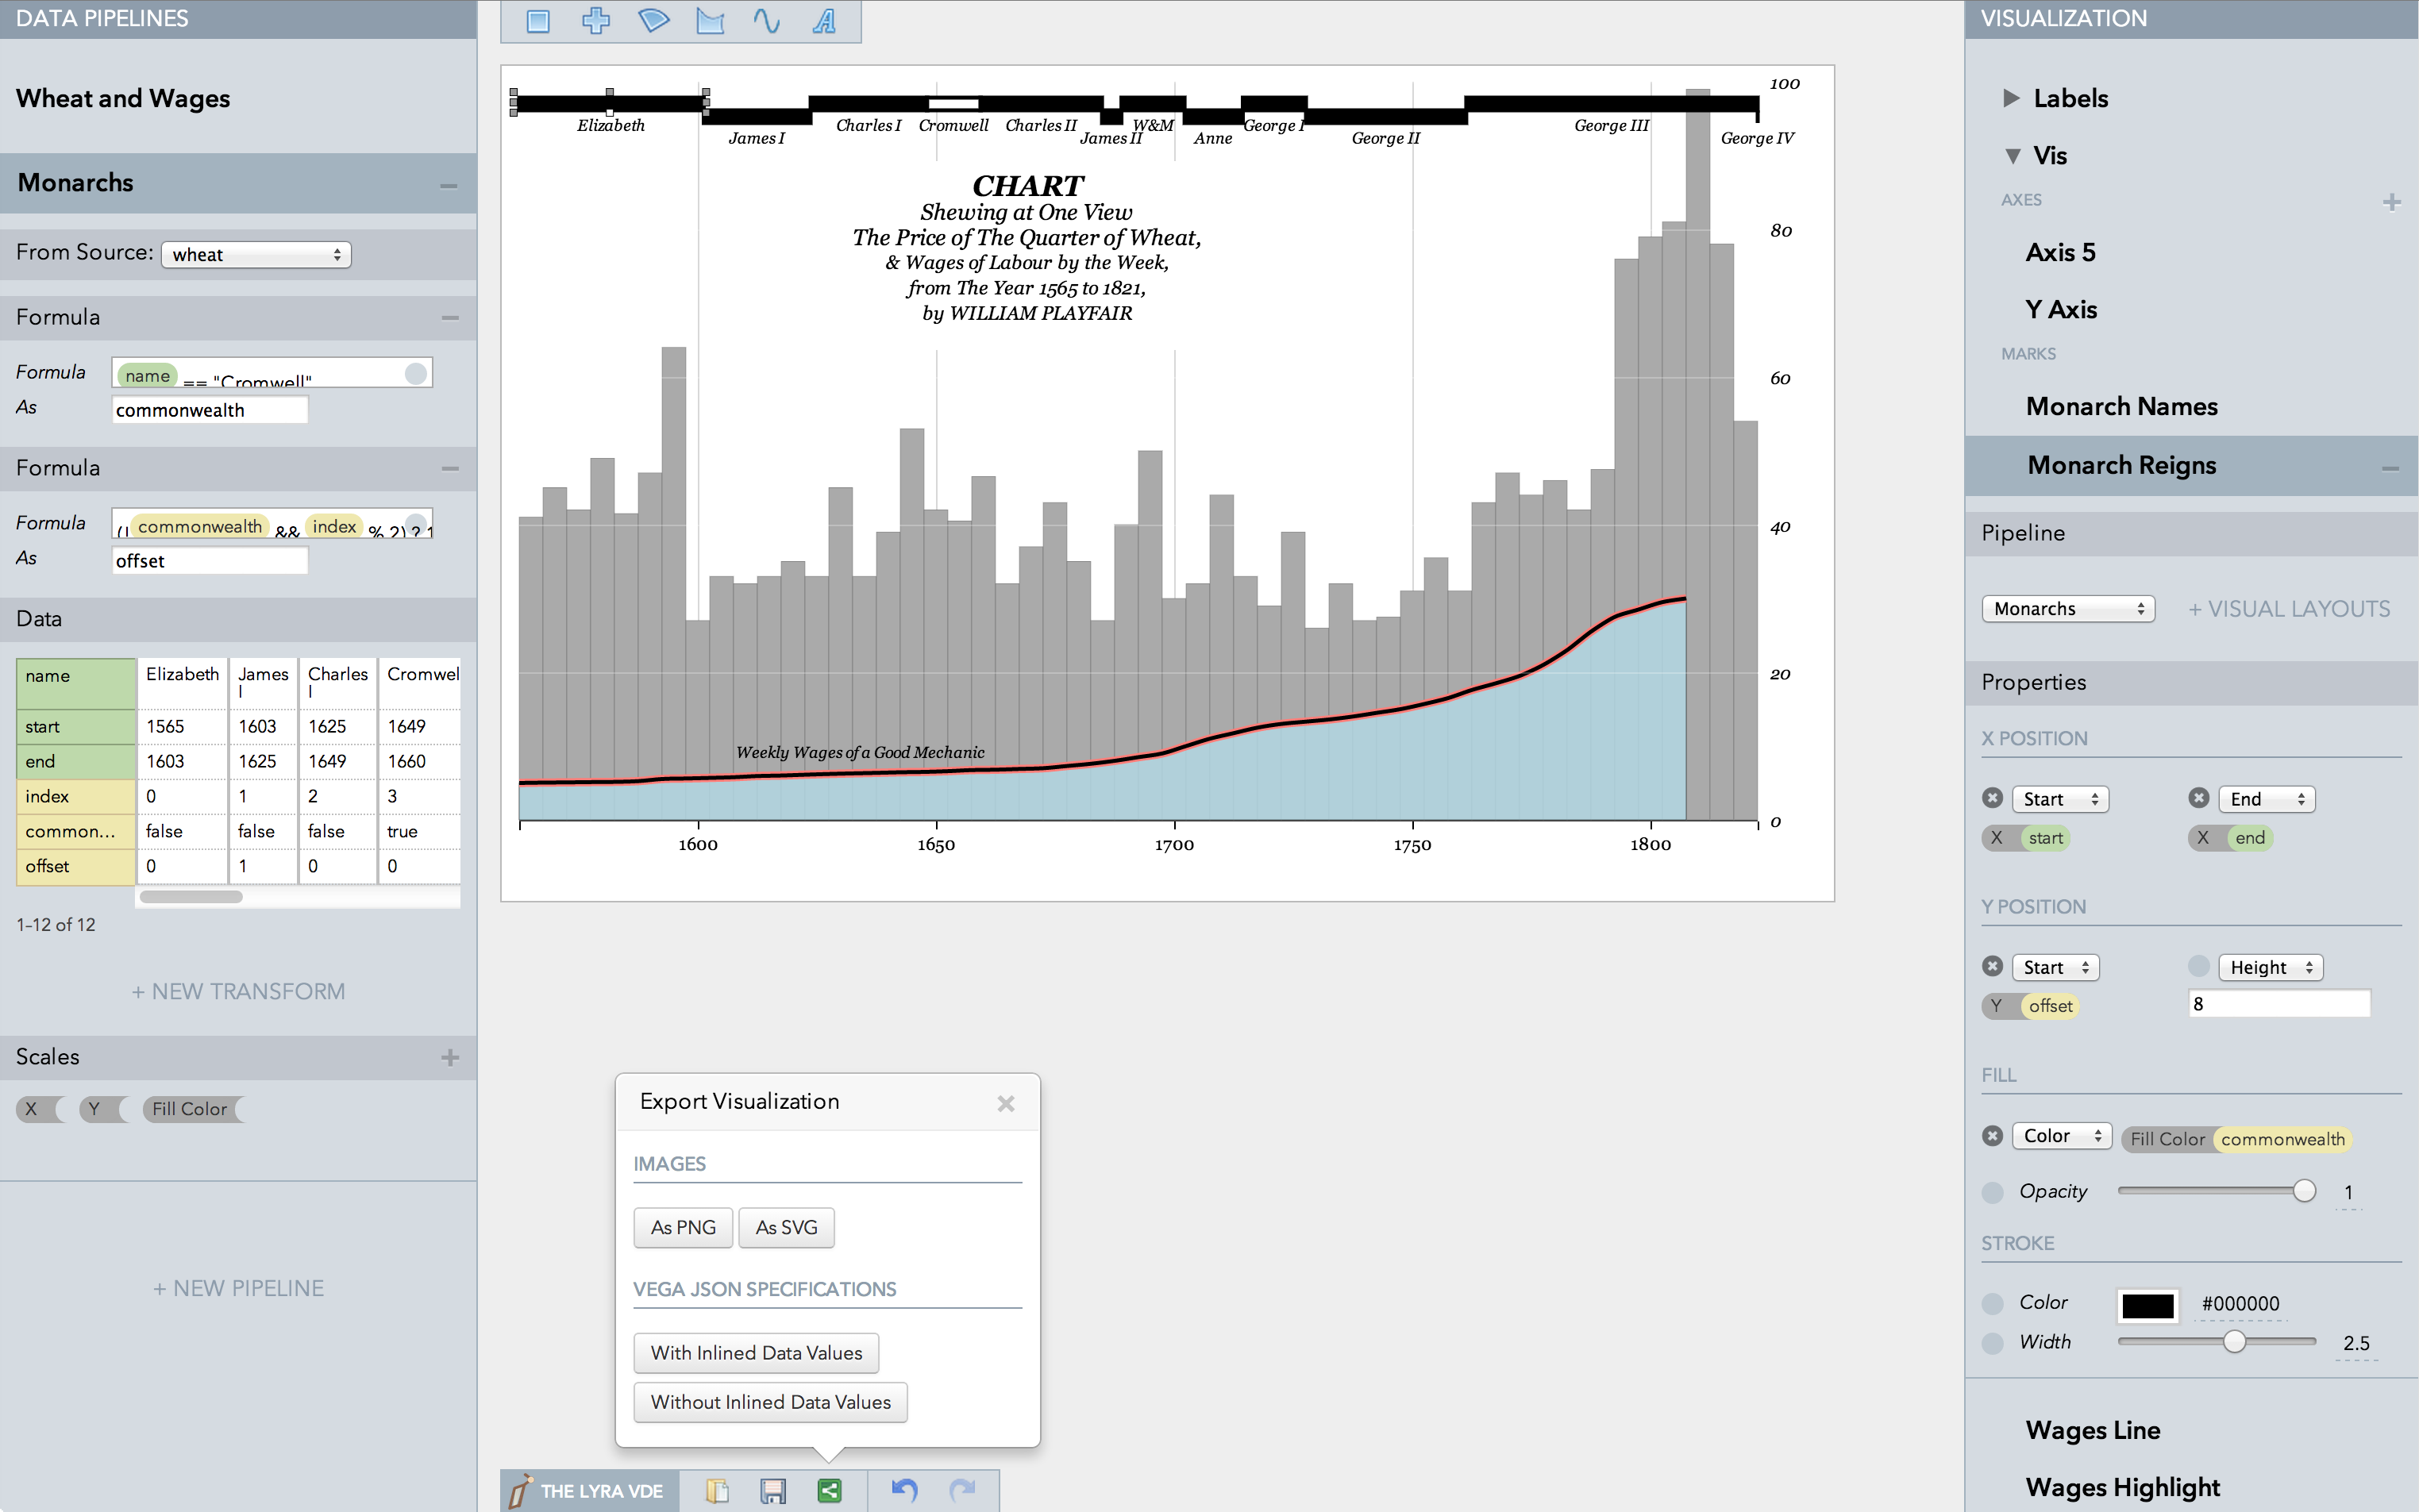
William Playfair’s classic chart comparing the price of wheat and wages in England recreated in the Lyra VDE.Lyra is an interactive environment that enables custom visualization design without writing any code. Graphical “marks” can be bound to data fields using property drop zones; dynamically positioned using connectors; and directly moved, rotated, and resized using handles. Lyra also provides a data pipeline interface for iterative visual specification of data transformations and layout algorithms. Lyra is more expressive than interactive systems like Tableau, allowing designers to create custom visualizations comparable to hand-coded visualizations built with D3 or Processing. These visualizations can then be easily published and reused on the Web.
This looks very promising!