Another Word For It Patrick Durusau on Topic Maps and Semantic Diversity

August 2, 2018

Visual Guide to Data Joins – Leigh Tami

Filed under: .Net,Data Aggregation,Data Integration,Data Science,Joins — Patrick Durusau @ 7:06 pm

Leigh Tami created a graphic involving a person and a coat to explain data set joins.

Scaling it down won’t do it justice here so see the original.

Preview any data science book with this image in mind. If it doesn’t match or exceed this explanation of joins, pass it by.

March 5, 2017

Why I Love XML (and Good Thing, It’s Everywhere) [Needs Subject Identity Too]

Filed under: Data Integration,Heterogeneous Data,XML — Patrick Durusau @ 9:39 pm

Why I Love XML (and Good Thing, It’s Everywhere) by Lee Pollington.

Lee makes a compelling argument for XML as the underlying mechanism for data integration when saying:

…Perhaps the data in your relational databases is structured. What about your knowledge management systems, customer information systems, document systems, CMS, mail, etc.? How do you integrate that data with structured data to get a holistic view of all your data? What do you do when you want to bring a group of relational schemas from different systems together to get that elusive 360 view – which is being demanded by the world’s regulators banks? Mergers and acquisitions drive this requirement too. How do you search across that data?

Sure there are solution stack answers. We’ve all seen whiteboards with ever growing number of boxes and those innocuous puny arrows between them that translate to teams of people, buckets of code, test and operations teams. They all add up to ever-increasing costs, complexity, missed deadlines & market share loss. Sound overly dramatic? Gartner calculated a worldwide spend of $5 Billion on data integration software in 2015. How much did you spend … would you know where to start calculating that cost?

While pondering what you spend on a yearly basis for data integration, contemplate two more questions from Lee:

…So take a moment to think about how you treat the data format that underpins your intellectual property? First-class citizen or after-thought?…

If you are treating your XML elements as first class citizens, do tell me that you created subject identity tests for those subjects?

So that a programmer new to your years of legacy XML will understand that <MFBM>, <MBFT> and <MBF> elements are all expressed in units of 1,000 board feet.

Yes?

Reducing the cost of data integration tomorrow, next year and five years after that, requires investment in the here and now.

Perhaps that is why data integration costs continue to climb.

Why pay for today what can be put off until tomorrow? (Future conversion costs are a line item in some future office holder’s budget.)

February 15, 2017

Unmet Needs for Analyzing Biological Big Data… [Data Integration #1 – Spells Market Opportunity]

Filed under: BigData,Bioinformatics,Biomedical,Data Integration,Data Management,Data Mining — Patrick Durusau @ 8:09 am

Unmet Needs for Analyzing Biological Big Data: A Survey of 704 NSF Principal Investigators by Lindsay Barone, Jason Williams, David Micklos.

Abstract:

In a 2016 survey of 704 National Science Foundation (NSF) Biological Sciences Directorate principle investigators (BIO PIs), nearly 90% indicated they are currently or will soon be analyzing large data sets. BIO PIs considered a range of computational needs important to their work, including high performance computing (HPC), bioinformatics support, multi-step workflows, updated analysis software, and the ability to store, share, and publish data. Previous studies in the United States and Canada emphasized infrastructure needs. However, BIO PIs said the most pressing unmet needs are training in data integration, data management, and scaling analyses for HPC, acknowledging that data science skills will be required to build a deeper understanding of life. This portends a growing data knowledge gap in biology and challenges institutions and funding agencies to redouble their support for computational training in biology.

In particular, needs topic maps can address rank #1, #2, #6, #7, and #10, or as found by the authors:


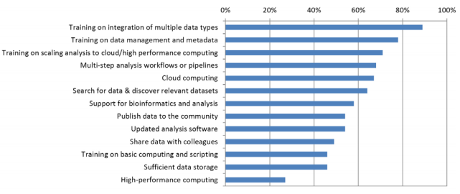
A majority of PIs—across bioinformatics/other disciplines, larger/smaller groups, and the four NSF programs—said their institutions are not meeting nine of 13 needs (Figure 3). Training on integration of multiple data types (89%), on data management and metadata (78%), and on scaling analysis to cloud/HP computing (71%) were the three greatest unmet needs. High performance computing was an unmet need for only 27% of PIs—with similar percentages across disciplines, different sized groups, and NSF programs.

or graphically (figure 3):

So, cloud, distributed, parallel, pipelining, etc., processing is insufficient?

Pushing undocumented and unintegratable data at ever increasing speeds is impressive but gives no joy?

This report will provoke another round of Esperanto fantasies, that is the creation of “universal” vocabularies, which if used by everyone and back-mapped to all existing literature, would solve the problem.

The number of Esperanto fantasies and the cost/delay of back-mapping to legacy data defeats all such efforts. Those defeats haven’t prevented repeated funding of such fantasies in the past, present and no doubt the future.

Perhaps those defeats are a question of scope.

That is rather than even attempting some “universal” interchange of data, why not approach it incrementally?

I suspect the PI’s surveyed each had some particular data set in mind when they mentioned data integration (which itself is a very broad term).

Why not seek out, develop and publish data integrations in particular instances, as opposed to attempting to theorize what might work for data yet unseen?

The need topic maps wanted to meet remains unmet. With no signs of lessening.

Opportunity knocks. Will we answer?

August 31, 2016

NiFi 1.0

Filed under: Data Integration,Data Management,NiFi — Patrick Durusau @ 9:02 pm

NiFi 1.0 (download page)

NiFi 1.0 dropped today!

From the NiFi homepage:

Apache NiFi supports powerful and scalable directed graphs of data routing, transformation, and system mediation logic. Some of the high-level capabilities and objectives of Apache NiFi include:

  • Web-based user interface
    • Seamless experience between design, control, feedback, and monitoring
  • Highly configurable
    • Loss tolerant vs guaranteed delivery
    • Low latency vs high throughput
    • Dynamic prioritization
    • Flow can be modified at runtime
    • Back pressure
  • Data Provenance
    • Track dataflow from beginning to end
  • Designed for extension
    • Build your own processors and more
    • Enables rapid development and effective testing
  • Secure
    • SSL, SSH, HTTPS, encrypted content, etc…
    • Multi-tenant authorization and internal authorization/policy management

I haven’t been following this project but the expression language for manipulation of data in a flow looks especially interesting.

April 27, 2016

Reboot Your $100+ Million F-35 Stealth Jet Every 10 Hours Instead of 4 (TM Fusion)

Filed under: Cybersecurity,Data Fusion,Data Integration,Data Science,Topic Maps — Patrick Durusau @ 10:07 am

Pentagon identifies cause of F-35 radar software issue

From the post:

The Pentagon has found the root cause of stability issues with the radar software being tested for the F-35 stealth fighter jet made by Lockheed Martin Corp, U.S. Defense Acquisition Chief Frank Kendall told a congressional hearing on Tuesday.

Last month the Pentagon said the software instability issue meant the sensors had to be restarted once every four hours of flying.

Kendall and Air Force Lieutenant General Christopher Bogdan, the program executive officer for the F-35, told a Senate Armed Service Committee hearing in written testimony that the cause of the problem was the timing of “software messages from the sensors to the main F-35” computer. They added that stability issues had improved to where the sensors only needed to be restarted after more than 10 hours.

“We are cautiously optimistic that these fixes will resolve the current stability problems, but are waiting to see how the software performs in an operational test environment,” the officials said in a written statement.
… (emphasis added)

At $100+ Million plane that requires rebooting every ten hours? I’m not a pilot but that sounds like a real weakness.

The precise nature of the software glitch isn’t described but you can guess one of the problems from Lockheed Martin’s, Software You Wish You Had: Inside the F-35 Supercomputer:


The human brain relies on five senses—sight, smell, taste, touch and hearing—to provide the information it needs to analyze and understand the surrounding environment.

Similarly, the F-35 relies on five types of sensors: Electronic Warfare (EW), Radar, Communication, Navigation and Identification (CNI), Electro-Optical Targeting System (EOTS) and the Distributed Aperture System (DAS). The F-35 “brain”—the process that combines this stellar amount of information into an integrated picture of the environment—is known as sensor fusion.

At any given moment, fusion processes large amounts of data from sensors around the aircraft—plus additional information from datalinks with other in-air F-35s—and combines them into a centralized view of activity in the jet’s environment, displayed to the pilot.

In everyday life, you can imagine how useful this software might be—like going out for a jog in your neighborhood and picking up on real-time information about obstacles that lie ahead, changes in traffic patterns that may affect your route, and whether or not you are likely to pass by a friend near the local park.

F-35 fusion not only combines data, but figures out what additional information is needed and automatically tasks sensors to gather it—without the pilot ever having to ask.
… (emphasis added)

The fusion of data from other in-air F-35s is a classic topic map merging of data problem.

You have one subject, say an anti-aircraft missile site, seen from up to four (in the F-35 specs) F-35s. As is the habit of most physical objects, it has only one geographic location but the fusion computer for the F-35 doesn’t come up with than answer.

Kris Osborn writes in Software Glitch Causes F-35 to Incorrectly Detect Targets in Formation:


“When you have two, three or four F-35s looking at the same threat, they don’t all see it exactly the same because of the angles that they are looking at and what their sensors pick up,” Bogdan told reporters Tuesday. “When there is a slight difference in what those four airplanes might be seeing, the fusion model can’t decide if it’s one threat or more than one threat. If two airplanes are looking at the same thing, they see it slightly differently because of the physics of it.”

For example, if a group of F-35s detect a single ground threat such as anti-aircraft weaponry, the sensors on the planes may have trouble distinguishing whether it was an isolated threat or several objects, Bogdan explained.

As a result, F-35 engineers are working with Navy experts and academics from John’s Hopkins Applied Physics Laboratory to adjust the sensitivity of the fusion algorithms for the JSF’s 2B software package so that groups of planes can correctly identify or discern threats.

“What we want to have happen is no matter which airplane is picking up the threat – whatever the angles or the sensors – they correctly identify a single threat and then pass that information to all four airplanes so that all four airplanes are looking at the same threat at the same place,” Bogdan said.

Unless Bogdan is using “sensitivity” in a very unusual sense, that doesn’t sound like the issue with the fusion computer of the F-35.

Rather the problem is the fusion computer has no explicit doctrine of subject identity to use when it is merging data from different F-35s, whether it be two, three, four or even more F-35s. The display of tactical information should be seamless to the pilot and without human intervention.

I’m sure members of Congress were impressed with General Bogdan using words like “angles” and “physics,” but the underlying subject identity issue isn’t hard to address.

At issue is the location of a potential target on the ground. Within some pre-defined metric, anything located within a given area is the “same target.”

The Air Force has already paid for this type of analysis and the mathematics of what is called Circular Error Probability (CEP) has been published in Use of Circular Error Probability in Target Detection by William Nelson (1988).

You need to use the “current” location of the detecting aircraft, allowances for inaccuracy in estimating the location of the target, etc., but once you call out the subject identity as an issue, its a matter of making choices of how accurate you want the subject identification to be.

Before you forward this to Gen. Bogdan as a way forward on the fusion computer, realize that CEP is only one aspect of target identification. But, calling the subject identity of targets out explicitly, enables reliable presentation of single/multiple targets to pilots.

Your call, confusing displays or a reliable, useful display.

PS: I assume military subject identity systems would not be running XTM software. Same principles apply even if the syntax is different.
February 9, 2016

Topic Maps: On the Cusp of Success (Curate in Place/Death of ETL?)

Filed under: Data Integration,Semantics,Topic Maps — Patrick Durusau @ 7:10 pm

The Bright Future of Semantic Graphs and Big Connected Data by Alex Woodie.

From the post:

Semantic graph technology is shaping up to play a key role in how organizations access the growing stores of public data. This is particularly true in the healthcare space, where organizations are beginning to store their data using so-called triple stores, often defined by the Resource Description Framework (RDF), which is a model for storing metadata created by the World Wide Web Consortium (W3C).

One person who’s bullish on the prospects for semantic data lakes is Shawn Dolley, Cloudera’s big data expert for the health and life sciences market. Dolley says semantic technology is on the cusp of breaking out and being heavily adopted, particularly among healthcare providers and pharmaceutical companies.

“I have yet to speak with a large pharmaceutical company where there’s not a small group of IT folks who are working on the open Web and are evaluating different technologies to do that,” Dolley says. “These are visionaries who are looking five years out, and saying we’re entering a world where the only way for us to scale….is to not store it internally. Even with Hadoop, the data sizes are going to be too massive, so we need to learn and think about how to federate queries.”

By storing healthcare and pharmaceutical data as semantic triples using graph databases such as Franz’s AllegroGraph, it can dramatically lower the hurdles to accessing huge stores of data stored externally. “Usually the primary use case that I see for AllegroGraph is creating a data fabric or a data ecosystem where they don’t have to pull the data internally,” Dolley tells Datanami. “They can do seamless queries out to data and curate it as it sits, and that’s quite appealing.

….

This is leading-edge stuff, and there are few mission-critical deployments of semantic graph technologies being used in the real world. However, there are a few of them, and the one that keeps popping up is the one at Montefiore Health System in New York City.

Montefiore is turning heads in the healthcare IT space because it was the first hospital to construct a “longitudinally integrated, semantically enriched” big data analytic infrastructure in support of “next-generation learning healthcare systems and precision medicine,” according to Franz, which supplied the graph database at the heart of the health data lake. Cloudera’s free version of Hadoop provided the distributed architecture for Montefiore’s semantic data lake (SDL), while other components and services were provided by tech big wigs Intel (NASDAQ: INTC) and Cisco Systems (NASDAQ: CSCO).

This approach to building an SDL will bring about big improvements in healthcare, says Dr. Parsa Mirhaji MD. PhD., the director of clinical research informatics at Einstein College of Medicine and Montefiore Health System.

“Our ability to conduct real-time analysis over new combinations of data, to compare results across multiple analyses, and to engage patients, practitioners and researchers as equal partners in big-data analytics and decision support will fuel discoveries, significantly improve efficiencies, personalize care, and ultimately save lives,” Dr. Mirhaji says in a press release. (emphasis added)

If I hadn’t known better, reading passages like:

the only way for us to scale….is to not store it internally

learn and think about how to federate queries

seamless queries out to data and curate it as it sits

I would have sworn I was reading a promotion piece for topic maps!

Of course, it doesn’t mention how to discover valuable data not written in your terminology, but you have to hold something back for the first presentation to the CIO.

The growth of data sets too large for ETL are icing on the cake for topic maps.

Why ETL when the data “appears” as I choose to view it? My topic map may be quite small, at least in relationship to the data set proper.

computer-money

OK, truth-in-advertising moment, it won’t be quite that easy!

And I don’t take small bills. 😉 Diamonds, other valuable commodities, foreign deposit arrangements can be had.
People are starting to think in a “topic mappish” sort of way. Or at least a way where topic maps deliver what they are looking for.

That’s the key: What do they want?

Then use a topic map to deliver it.

September 7, 2015

DataGraft: Initial Public Release

Filed under: Cloud Computing,Data Conversion,Data Integration,Data Mining — Patrick Durusau @ 3:21 pm

DataGraft: Initial Public Release

As a former resident of Louisiana and given my views on the endemic corruption in government contracts, putting “graft” in the title of anything is like waving a red flag at a bull!

From the webpage:

We are pleased to announce the initial public release of DataGraft – a cloud-based service for data transformation and data access. DataGraft is aimed at data workers and data developers interested in simplified and cost-effective solutions for managing their data. This initial release provides capabilities to:

  • Transform tabular data and share transformations: Interactively edit, host, execute, and share data transformations
  • Publish, share, and access RDF data: Data hosting and reliable RDF data access / data querying

Sign up for an account and try DataGraft now!

You may want to check out our FAQ, documentation, and the APIs. We’d be glad to hear from you – don’t hesitate to get in touch with us!

I followed a tweet from Kirk Borne recently to a demo of Pentaho on data integration. I mention that because Pentaho is a good representative of the commercial end of data integration products.

Oh, the demo was impressive, a visual interface selecting nicely styled icons from different data sources, integration, visualization, etc.

But, the one characteristic it shares with DataGraft is that I would be hard pressed to follow or verify your reasoning for the basis for integrating that particular data.

If it happens that both files have customerID and they both have the same semantic, by some chance, then you can glibly talk about integrating data from diverse resources. If not, well, then your mileage will vary a great deal.

The important point that is dropped by both Pentaho and DataGraft is that data integration isn’t just an issue for today, that same data integration must be robust long after I have moved onto another position.

Like spreadsheets, the next person in my position could just run the process blindly and hope that no one ever asks for a substantive change, but that sounds terribly inefficient.

Why not provide users with the ability to disclose the properties they “see” in the data sources and to indicate why they made the mappings they did?

That is make the mapping process more transparent.

July 20, 2015

Why Are Data Silos Opaque?

Filed under: Data Integration,Data Silos — Patrick Durusau @ 1:32 pm

As I pointed out in In Praise of the Silo [Listening NSA?], quoting Neil Ward-Dutton:

Every organisational feature – including silos – is an outcome of some kind of optimisation. By talking about trying to destroy silos, we’re denying the sometimes very rational reasons behind their creation.

While working on a presentation for Balisage 2015, it occurred to me to ask: Why Are Data Silos Opaque?

A popular search engine reports that sans duplicates, there were three hundred and thirty-three (333) “hits” on “data silo” that were updated in the last year. Far more reports than I want to list or that you want to read.

The common theme, of course, is the difficulty of accessing data silos.

OK, I’ll bite, why are data silos opaque?

Surely if our respective data silos are based on relational database technology, even with NoSQL, still a likely bet, don’t our programmers know about JDBC drivers? Doesn’t connecting to the data silo solve the problem?

Can we assume that data silos are not opaque due to accessibility? That is drivers exist for accessing data stores, modulo the necessity for system security. Yes?

Data silos aren’t opaque to the users who use them or the DBAs who maintain them. So opacity isn’t something inherent in the data silo itself because we know of people who successfully use what we call a data silo.

What do you think makes data silos opaque?

If we knew where the problem comes from, it might be possible to discuss solutions.

June 5, 2015

Global marine data to become unified, accessible

Filed under: Data Integration,Oceanography — Patrick Durusau @ 10:09 am

Global marine data to become unified, accessible

From the post:

An international project aims to enable the next great scientific advances in global marine research by making marine data sets more easily accessible to researchers worldwide.

Currently different data formats between research centres pose a challenge to oceanographic researchers, who need unified data sets to get the most complete picture possible of the ocean. This project, called ODIP II, aims to solve this problem using NERC’s world-class vocabulary server to ‘translate’ between these different data semantics. The vocabulary server, which is effectively now an international standard for a service of this kind, was developed by the British Oceanographic Data Centre (BODC); a national facility operated as part of the National Oceanography Centre (NOC).

That sounds promising, at least until you read:

By the time ODIP II is complete, in May 2018, it aims to have developed a means of seamlessly sharing and managing marine data between the EU, the USA and Australia, by co-ordinating the existing regional marine e-infrastructures.

I’ve never been really strong on geography but the last time I looked, “global” included more than the EU, USA and Australia.

Let’s be very generous and round the EU, USA and Australia population total up to 1 billion.

That leaves 6 billion people and hundreds of countries unaccounted for. Don’t know but some of those countries might have marine data. Won’t know if we don’t ask.

Still a great first step, but let’s not confuse the world with ourselves and what we know.

April 7, 2015

Federal Data Integration: Dengue Fever

The White House issued a press release today (April 7, 2015) titled: FACT SHEET: Administration Announces Actions To Protect Communities From The Impacts Of Climate Change.

That press release reads in part:


Unleashing Data: As part of the Administration’s Predict the Next Pandemic Initiative, in May 2015, an interagency working group co-chaired by OSTP, the CDC, and the Department of Defense will launch a pilot project to simulate efforts to forecast epidemics of dengue – a mosquito-transmitted viral disease affecting millions of people every year, including U.S. travelers and residents of the tropical regions of the U.S. such as Puerto Rico. The pilot project will consolidate data sets from across the federal government and academia on the environment, disease incidence, and weather, and challenge the research and modeling community to develop predictive models for dengue and other infectious diseases based on those datasets. In August 2015, OSTP plans to convene a meeting to evaluate resulting models and showcase this effort as a “proof-of-concept” for similar forecasting efforts for other infectious diseases.

I tried finding more details on earlier workshops in this effort but limiting the search to “Predict the Next Pandemic Initiative” and the domain to “.gov,” I got two “hits.” One of which was the press release I cite above.

I sent a message (webform) to the White House Office of Science and Technology Policy office and will update you with any additional information that arrives.

Of course my curiosity is about the means used to integrate the data sets. Once integrated, such data sets can be re-used, at least until it is time to integrate additional data sets. Bearing in mind that dirty data can lead to poor decision making, I would rather not duplicate the cleaning of data time after time.

March 20, 2015

Tamr Catalog Tool (And Email Harvester)

Filed under: BigData,Data Integration — Patrick Durusau @ 4:10 pm

Tamr to Provide Free, Standalone Version of Tamr Catalog Tool

From the webpage:


Tamr Catalog was announced in February as part of the Tamr Platform for enterprise data unification. Using Tamr Catalog, enterprises can quickly inventory all the data that exists in the enterprise, regardless of type, platform or source. With today’s announcement of a free, standalone version of Tamr Catalog, enterprises can now speed and standardize data inventorying, making more data visible and readily usable for analytics.

Tamr Catalog is a free, standalone tool that allows businesses to logically map the attributes and records of a given data source with the entity it actually represents. This speeds time-to- analytics by reducing the amount of time spent searching for data.

That all sounds interesting but rather short on how the Tamr Catalog Tool will make that happen.

Download the whitepaper? Its all of two (2) pages long. Genuflects to 90% of data being dark, etc. but not a whisper on how the Tamr Catalog Tool will cure that darkness.

Oh, it will cost you your email address to get the two page flyer and you won’t be any better informed than before.

Let’s all hope they discover how to make the Tamr Catalog Tool perform these miracles before it is released this coming summer.

I do think the increasing interest in “dark data” bodes well for topic maps.

November 11, 2014

Linked Data Integration with Conflicts

Filed under: Data Integration,Integration,Linked Data — Patrick Durusau @ 4:40 pm

Linked Data Integration with Conflicts by Jan Michelfeit, Tomáš Knap, Martin Nečaský.

Abstract:

Linked Data have emerged as a successful publication format and one of its main strengths is its fitness for integration of data from multiple sources. This gives them a great potential both for semantic applications and the enterprise environment where data integration is crucial. Linked Data integration poses new challenges, however, and new algorithms and tools covering all steps of the integration process need to be developed. This paper explores Linked Data integration and its specifics. We focus on data fusion and conflict resolution: two novel algorithms for Linked Data fusion with provenance tracking and quality assessment of fused data are proposed. The algorithms are implemented as part of the ODCleanStore framework and evaluated on real Linked Open Data.

Conflicts in Linked Data? The authors explain:

From the paper:

The contribution of this paper covers the data fusion phase with conflict resolution and a conflict-aware quality assessment of fused data. We present new algorithms that are implemented in ODCleanStore and are also available as a standalone tool ODCS-FusionTool.2

Data fusion is the step where actual data merging happens – multiple records representing the same real-world object are combined into a single, consistent, and clean representation [3]. In order to fulfill this definition, we need to establish a representation of a record, purge uncertain or low-quality values, and resolve identity and other conflicts. Therefore we regard conflict resolution as a subtask of data fusion.

Conflicts in data emerge during the data fusion phase and can be classified as schema, identity, and data conflicts. Schema conflicts are caused by di fferent source data schemata – di fferent attribute names, data representations (e.g., one or two attributes for name and surname), or semantics (e.g., units). Identity conflicts are a result of di fferent identifiers used for the same real-world objects. Finally, data conflicts occur when di fferent conflicting values exist for an attribute of one object.

Conflict can be resolved on entity or attribute level by a resolution function. Resolution functions can be classified as deciding functions, which can only choose values from the input such as the maximum value, or mediating functions, which may produce new values such as average or sum [3].

Oh, so the semantic diversity of data simply flowed into Linked Data representation.

Hmmm, watch for a basis for in the data for resolving schema, identity and data conflicts.

The related work section is particularly rich with references to non-Linked Data conflict resolution projects. Definitely worth a close read and chasing the references.

To examine the data fusion and conflict resolution algorithm the authors start by restating the problem:

  1. Diff erent identifying URIs are used to represent the same real-world entities.
  2. Diff erent schemata are used to describe data.
  3. Data conflicts emerge when RDF triples sharing the same subject and predicate have inconsistent values in place of the object.

I am skipping all the notation manipulation for the quads, etc., mostly because of the inputs into the algorithm:

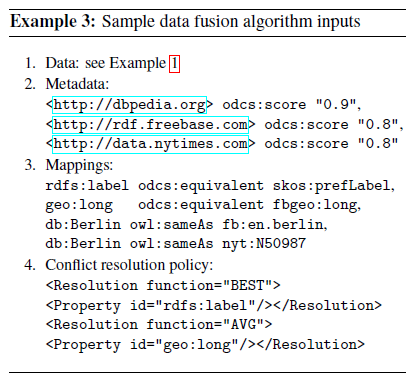
ld-input-resolution

As a result of human intervention, the different identifying URIs have been mapped together. Not to mention the weighting of the metadata and the desired resolution for data conflicts (location data).

With that intervention, the complex RDF notation and manipulation becomes irrelevant.

Moreover, as I am sure you are aware, there is more than one “Berlin” listed in DBpedia. Several dozen as I recall.

I mention that because the process as described does not say where the authors of the rules/mappings obtained the information necessary to distinguish one Berlin from another?

That is critical for another author to evaluate the correctness of their mappings.

At the end of the day, after the “resolution” proposed by the authors, we are in no better position to map their result to another than we were at the outset. We have bald statements with no additional data on which to evaluate those statements.

Give Appendix A. List of Conflict Resolution Functions, a close read. The authors have extracted conflict resolution functions from the literature. Should be a time saver as well as suggestive of other needed resolution functions.

PS: If you look for ODCS-FusionTool you will find LD-Fusion Tool (GitHub), which was renamed to ODCS-FusionTool a year ago. See also the official LD-FusionTool webpage.

November 8, 2014

Big Data Driving Data Integration at the NIH

Filed under: BigData,Data Integration,Funding,NIH — Patrick Durusau @ 5:17 pm

Big Data Driving Data Integration at the NIH by David Linthicum.

From the post:

The National Institutes of Health announced new grants to develop big data technologies and strategies.

“The NIH multi-institute awards constitute an initial investment of nearly $32 million in fiscal year 2014 by NIH’s Big Data to Knowledge (BD2K) initiative and will support development of new software, tools and training to improve access to these data and the ability to make new discoveries using them, NIH said in its announcement of the funding.”

The grants will address issues around Big Data adoption, including:

  • Locating data and the appropriate software tools to access and analyze the information.
  • Lack of data standards, or low adoption of standards across the research community.
  • Insufficient polices to facilitate data sharing while protecting privacy.
  • Unwillingness to collaborate that limits the data’s usefulness in the research community.

Among the tasks funded is the creation of a “Perturbation Data Coordination and Integration Center.” The center will provide support for data science research that focuses on interpreting and integrating data from different data types and databases. In other words, it will make sure the data moves to where it should move, in order to provide access to information that’s needed by the research scientist. Fundamentally, it’s data integration practices and technologies.

This is very interesting from the standpoint that the movement into big data systems often drives the reevaluation, or even new interest in data integration. As the data becomes strategically important, the need to provide core integration services becomes even more important.

The NIH announcement. NIH invests almost $32 million to increase utility of biomedical research data, reads in part:

Wide-ranging National Institutes of Health grants announced today will develop new strategies to analyze and leverage the explosion of increasingly complex biomedical data sets, often referred to as Big Data. These NIH multi-institute awards constitute an initial investment of nearly $32 million in fiscal year 2014 by NIH’s Big Data to Knowledge (BD2K) initiative, which is projected to have a total investment of nearly $656 million through 2020, pending available funds.

With the advent of transformative technologies for biomedical research, such as DNA sequencing and imaging, biomedical data generation is exceeding researchers’ ability to capitalize on the data. The BD2K awards will support the development of new approaches, software, tools, and training programs to improve access to these data and the ability to make new discoveries using them. Investigators hope to explore novel analytics to mine large amounts of data, while protecting privacy, for eventual application to improving human health. Examples include an improved ability to predict who is at increased risk for breast cancer, heart attack and other diseases and condition, and better ways to treat and prevent them.

And of particular interest:

BD2K Data Discovery Index Coordination Consortium (DDICC). This program will create a consortium to begin a community-based development of a biomedical data discovery index that will enable discovery, access and citation of biomedical research data sets.

Big data driving data integration. Who knew? 😉

The more big data the greater the pressure for robust data integration.

Sounds like they are playing the topic maps tune.

July 21, 2014

Hadoop Doesn’t Cure HIV

Filed under: Data Integration,Hadoop — Patrick Durusau @ 9:53 am

If I were Gartner, I could get IBM to support my stating the obvious. I would have to dress it up by repeating a lot of other obvious things but that seems to be the role for some “analysts.”

If you need proof of that claim, consider this report: Hadoop Is Not a Data Integration Solution. Really? Did any sane person familiar with Hadoop think otherwise?

The “key” findings from the report:

  • Many Hadoop projects perform extract, transform and load workstreams. Although these serve a purpose, the technology lacks the necessary key features and functions of commercially-supported data integration tools.
  • Data integration requires a method for rationalizing inconsistent semantics, which helps developers rationalize various sources of data (depending on some of the metadata and policy capabilities that are entirely absent from the Hadoop stack).
  • Data quality is a key component of any appropriately governed data integration project. The Hadoop stack offers no support for this, other than the individual programmer’s code, one data element at a time, or one program at a time.
  • Because Hadoop workstreams are independent — and separately programmed for specific use cases — there is no method for relating one to another, nor for identifying or reconciling underlying semantic differences.

All true, all obvious and all a function of Hadoop’s design. It never had data integration as a requirement so finding that it doesn’t do data integration isn’t a surprise.

If you switch “commercially-supported data integration tools,” you will be working “…one data element at a time,” because common data integration tools don’t capture their own semantics. Which means you can’t re-use your prior data integration with one tool when you transition to another. Does that sound like vendor lock-in?

Odd that Gartner didn’t mention that.

Perhaps that’s stating the obvious as well.

A topic mapping of your present data integration solution will enable you to capture and re-use your investment in its semantics, with any data integration solution.

Did I hear someone say “increased ROI?”

June 3, 2014

Talend 5.5 (DYI Data Integration)

Filed under: Data Integration,Integration,Talend — Patrick Durusau @ 3:09 pm

Talend Increases Big Data Integration Performance and Scalability by 45 Percent

From the post:

Only Talend 5.5 allows developers to generate high performance Hadoop code without needing to be an expert in MapReduce or Pig

(BUSINESS WIRE)–Hadoop Summit — Talend, the global big data integration software leader, today announced the availability of Talend version 5.5, the latest release of the only integration platform optimized to deliver the highest performance on all leading Hadoop distributions.

Talend 5.5 enhances Talend’s performance and scalability on Hadoop by an average of 45 percent. Adoption of Hadoop is skyrocketing and companies large and small are struggling to find enough knowledgeable Hadoop developers to meet this growing demand. Only Talend 5.5 allows any data integration developer to use a visual development environment to generate native, high performance and highly scalable Hadoop code. This unlocks a large pool of development resources that can now contribute to big data projects. In addition, Talend is staying on the cutting edge of new developments in Hadoop that allow big data analytics projects to power real-time customer interactions.

….

Version 5.5 of all Talend open source products is available for immediate download from Talend’s website, www.talend.com. Experimental support for Spark code generation is also available immediately and can be downloaded from the Talend Exchange on Talendforge.org. Version 5.5 of the commercial subscription products will be available within 3 weeks and will be provided to all existing Talend customers as part of their subscription agreement. Products can be also be procured through the usual Talend representatives and partners.

To learn more about Talend 5.5 with 45 percent faster Big Data integration Performance register here for our June 10 webinar.
….

When you think of the centuries it took to go from a movable type press to modern word processing and near professional printing/binding capabilities, the enabling of users to perform data processing/integration, is nothing short of amazing.

Data scientists need not fear DYI data processing/integration any more than your local bar association fears “How to Avoid Probate” books on the news stand.

I don’t doubt people will be able to get some answer out of data crunching software but did they get a useful answer? Or an answer sufficient to set company policy? Or an answer that will increase their bottom line?

Encourage the use of open source software. Non-clients who use it poorly will fail. Make sure they can’t say the same about your clients.

BTW, the webinar appears to be scheduled for thirty (30) minutes. Thirty minutes on Talend 5.5? You will be better off spending that thirty minutes with Talend 5.5.

May 12, 2014

EnviroAtlas

Filed under: Data Integration,Environment,Government,Government Data — Patrick Durusau @ 4:13 pm

EnviroAtlas

From the homepage:

What is EnviroAtlas?

EnviroAtlas is a collection of interactive tools and resources that allows users to explore the many benefits people receive from nature, often referred to as ecosystem services. Key components of EnviroAtlas include the following:


Why is EnviroAtlas useful?

Though critically important to human well-being, ecosystem services are often overlooked. EnviroAtlas seeks to measure and communicate the type, quality, and extent of the goods and services that humans receive from nature so that their true value can be considered in decision-making processes.

Using EnviroAtlas, many types of users can access, view, and analyze diverse information to better understand how various decisions can affect an array of ecological and human health outcomes. EnviroAtlas is available to the public and houses a wealth of data and research.

EnvironAtlas integrates over 300 data layers listed in: Available EnvironAtlas data.

News about the cockroaches infesting the United States House/Senate makes me forget there are agencies laboring to provide benefits to citizens.

Whether this environmental goldmine will be enough to result in a saner environmental policy remains to be seen.

I first saw this in a tweet by Margaret Palmer.

May 7, 2014

Don’t Create A Data Governance Hairball

Filed under: Data Governance,Data Integration — Patrick Durusau @ 6:54 pm

Don’t Create A Data Governance Hairball by John Schmidt.

From the post:

Are you in one of those organizations that wants one version of the truth so badly that you have five of them? If so, you’re not alone. How does this happen? The same way the integration hairball happened; point solutions developed without a master plan in a culture of management by exception (that is, address opportunities as exceptions and deal with them as quickly as possible without consideration for broader enterprise needs). Developing a master plan to avoid a data governance hairball is a better approach – but there is a right way and a wrong way to do it.

As you probably can guess, I think John does a great job describing the “data governance hairball,” but not quite such high marks on avoiding the data governance hairball.

Not that I prefer some solution over John’s suggestions but that data governance hairballs are an essential characteristic of shared human knowledge. Human knowledge, can for some semantic locality avoid the data governance hairball, but that is always an accidental property.

An “essential” property is a property a subject must have to be that subject. The semantic differences even within domains, to say nothing of between domains, make it clear that master data governance is only possible within a limited semantic locality. An “accidental” property is a property a subject may or may not have but it is still the same subject.

The essential vs. accidental property distinction is useful in data integration/governance. If we recognize unbounded human knowledge is always subject to the data governance hairball description, then we can begin to look for John’s right level of “granularity.” That is we can create an accidental property that within a particular corporate context that we govern some data quite closely, but other data we don’t attempt to govern at all.

The difference between data we govern and data we don’t, being what ROI can be derived from the data we govern?

If data has no ROI and doesn’t enable ROI from other data, why bother?

Are you governing data with no established ROI?

April 20, 2014

Data Integration: A Proven Need of Big Data

Filed under: BigData,Data Integration — Patrick Durusau @ 3:21 pm

When It Comes to Data Integration Skills, Big Data and Cloud Projects Need the Most Expertise by David Linthicum.

From the post:

Looking for a data integration expert? Join the club. As cloud computing and big data become more desirable within the Global 2000, an abundance of data integration talent is required to make both cloud and big data work properly.

The fact of the matter is that you can’t deploy a cloud-based system without some sort of data integration as part of the solution. Either from on-premise to cloud, cloud-to-cloud, or even intra-company use of private clouds, these projects need someone who knows what they are doing when it comes to data integration.

While many cloud projects were launched without a clear understanding of the role of data integration, most people understand it now. As companies become more familiar with the could, they learn that data integration is key to the solution. For this reason, it’s important for teams to have at least some data integration talent.

The same goes for big data projects. Massive amounts of data need to be loaded into massive databases. You can’t do these projects using ad-hoc technologies anymore. The team needs someone with integration knowledge, including what technologies to bring to the project.

Generally speaking, big data systems are built around data integration solutions. Similar to cloud, the use of data integration architectural expertise should be a core part of the project. I see big data projects succeed and fail, and the biggest cause of failure is the lack of data integration expertise.

Even if not exposed to the client, a topic map based integration analysis of internal and external data records should give you a competitive advantage in future bids. After all you won’t have to re-interpret the data and all its fields, just the new ones or ones that have changed.

March 6, 2014

Metaphor: Web-based Functorial Data Migration

Filed under: Category Theory,Data Integration,SQL — Patrick Durusau @ 3:14 pm

Metaphor: Web-based Functorial Data Migration

From the webpage:

Metaphor is a web-based implementation of functorial data migration. David Spivak and Scott Morrison are the primary contributors.

I discovered this while running some of the FQL material to ground.

While I don’t doubt the ability of category theory to create mappings between relational schemas, what I am not seeing is the basis for the mapping.

In other words, assume I have two schemas with only one element in each one, firstName in one and givenName in the other. Certainly I can produce a mapping between those schemas.

Question: On what basis did I make such a mapping?

In other words, what properties of those subjects had to be the same or different in order for me to make that mapping?

Unless and until you know that, how can you be sure that your mappings agree with those I have made?

January 31, 2014

Apps for Energy

Filed under: Contest,Data Integration,Data Mining — Patrick Durusau @ 3:16 pm

Apps for Energy

Deadline: March 9, 2014

From the webpage:

The Department of Energy is awarding $100,000 in prizes for the best web and mobile applications that use one or more featured APIs, standards or ideas to help solve a problem in a unique way.

Submit an application by March 9, 2014!

Not much in the way of semantic integration opportunities, at least as the contest is written.

Still, it is an opportunity to work with government data and there is a chance you could win some money!

January 29, 2014

Applying linked data approaches to pharmacology:…

Applying linked data approaches to pharmacology: Architectural decisions and implementation by Alasdair J.G. Gray, et. al.

Abstract:

The discovery of new medicines requires pharmacologists to interact with a number of information sources ranging from tabular data to scientific papers, and other specialized formats. In this application report, we describe a linked data platform for integrating multiple pharmacology datasets that form the basis for several drug discovery applications. The functionality offered by the platform has been drawn from a collection of prioritised drug discovery business questions created as part of the Open PHACTS project, a collaboration of research institutions and major pharmaceutical companies. We describe the architecture of the platform focusing on seven design decisions that drove its development with the aim of informing others developing similar software in this or other domains. The utility of the platform is demonstrated by the variety of drug discovery applications being built to access the integrated data.

An alpha version of the OPS platform is currently available to the Open PHACTS consortium and a first public release will be made in late 2012, see http://www.openphacts.org/ for details.

The paper acknowledges that present database entries lack semantics.

A further challenge is the lack of semantics associated with links in traditional database entries. For example, the entry in UniProt for the protein “kinase C alpha type homo sapien4 contains a link to the Enzyme database record 5, which has complementary data about the same protein and thus the identifiers can be considered as being equivalent. One approach to resolve this, proposed by Identifiers.org, is to provide a URI for the concept which contains links to the database records about the concept [27]. However, the UniProt entry also contains a link to the DrugBank compound “Phosphatidylserine6. Clearly, these concepts are not identical as one is a protein and the other a chemical compound. The link in this case is representative of some interaction between the compound and the protein, but this is left to a human to interpret. Thus, for successful data integration one must devise strategies that address such inconsistencies within the existing data.

I would have said databases lack properties to identify the subjects in question but there is little difference in the outcome of our respective positions, i.e., we need more semantics to make robust use of existing data.

Perhaps even more importantly, the paper treats “equality” as context dependent:

Equality is context dependent

Datasets often provide links to equivalent concepts in other datasets. These result in a profusion of “equivalent” identifiers for a concept. Identifiers.org provide a single identifier that links to all the underlying equivalent dataset records for a concept. However, this constrains the system to a single view of the data, albeit an important one.

A novel approach to instance level links between the datasets is used in the OPS platform. Scientists care about the types of links between entities: different scientists will accept concepts being linked in different ways and for different tasks they are willing to accept different forms of relationships. For example, when trying to find the targets that a particular compound interacts with, some data sources may have created mappings to gene rather than protein identifiers: in such instances it may be acceptable to users to treat gene and protein IDs as being in some sense equivalent. However, in other situations this may not be acceptable and the OPS platform needs to allow for this dynamic equivalence within a scientific context. As a consequence, rather than hard coding the links into the datasets, the OPS platform defers the instance level links to be resolved during query execution by the Identity Mapping Service (IMS). Thus, by changing the set of dataset links used to execute the query, different interpretations over the data can be provided.

Opaque mappings between datasets, i.e., mappings that don’t assign properties to source, target and then say what properties or conditions must be met for the mapping to be vaild, are of little use. Rely on opaque mappings at your own risk.

On the other hand, I fully agree that equality is context dependent and the choice of the criteria for equivalence should be left up to users. I suppose in that sense if users wanted to rely on opaque mappings, that would be their choice.

While an exciting paper, it is discussing architectural decisions and so we are not at the point of debating these issues in detail. It promises to be an exciting discussion!

January 25, 2014

How Many Years a Slave?

Filed under: Data Analysis,Data Integration,Palantir — Patrick Durusau @ 10:51 am

How Many Years a Slave? by Karin Knox.

From the post:

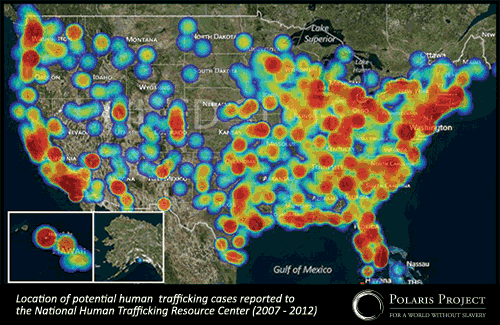
Each year, human traffickers reap an estimated $32 billion in profits from the enslavement of 21 million people worldwide. And yet, for most of us, modern slavery remains invisible. Its victims, many of them living in the shadows of our own communities, pass by unnoticed. Polaris Project, which has been working to end modern slavery for over a decade, recently released a report on trafficking trends in the U.S. that draws on five years of its data. The conclusion? Modern slavery is rampant in our communities.

slavery in US

January is National Slavery and Human Trafficking Prevention Month, and President Obama has called upon “businesses, national and community organizations, faith-based groups, families, and all Americans to recognize the vital role we can play in ending all forms of slavery.” The Polaris Project report, Human Trafficking Trends in the United States, reveals insights into how anti-trafficking organizations can fight back against this global tragedy.

….

Bradley Myles, CEO of the Polaris Project, makes a compelling case for data analysis in the fight against human trafficking. The post has an interview with Bradley and a presentation he made as part of the Palantir Night Live series.

Using Palantir software, the Polaris Project is able to rapidly connect survivors with responders across the United States. Their use of the data analytics aspect of the software is also allowing the project to find common patterns and connections.

The Polaris Project is using modern technology to recreate a modern underground railroad but at the same time, appears to be building a modern data silo as well. Or as Bradley puts it in his Palantir presentation, every report is “…one more data point that we have….”

I’m sure that’s true and helpful, to a degree. But going beyond the survivors of human trafficking, to reach the sources of human trafficking, will require the integration of data sets across many domains and languages.

Police sex crime units have data points, federal (U.S.) prosecutors have data points, social welfare agencies have data points, foreign governments and NGOs have data points, all related to human trafficking. I don’t think anyone believes a uniform solution is possible across all those domains and interests.

One way to solve that data integration problem is to disregard data points from anyone unable or unwilling to use some declared common solution or format. I don’t recommend that one.

Another way to attempt to solve the data integration problem is to have endless meetings to derive a common format, while human trafficking continues unhindered by data integration. I don’t recommend that approach either.

What I would recommend is creating maps between data systems, declaring and identifying the implicit subjects that support those mappings, so that disparate data systems can both export and import shared data across systems. Imports and exports that are robust, verifiable and maintainable.

Topic maps anyone?

January 21, 2014

…Desperately Seeking Data Integration

Filed under: Data Integration,Government,Government Data,Marketing,Topic Maps — Patrick Durusau @ 8:30 pm

Why the US Government is Desperately Seeking Data Integration by David Linthicum.

From the post:

“When it comes to data, the U.S. federal government is a bit of a glutton. Federal agencies manage on average 209 million records, or approximately 8.4 billion records for the entire federal government, according to Steve O’Keeffe, founder of the government IT network site, MeriTalk.”

Check out these stats, in a December 2013 MeriTalk survey of 100 federal records and information management professionals. Among the findings:

  • Only 18 percent said their agency had made significant progress toward managing records and email in electronic format, and are ready to report.
  • One in five federal records management professionals say they are “completely prepared” to handle the growing volume of government records.
  • 92 percent say their agency “has a lot of work to do to meet the direction.”
  • 46 percent say they do not believe or are unsure about whether the deadlines are realistic and obtainable.
  • Three out of four say the Presidential Directive on Managing Government Records will enable “modern, high-quality records and information management.”

I’ve been working with the US government for years, and I can tell that these facts are pretty accurate. Indeed, the paper glut is killing productivity. Even the way they manage digital data needs a great deal of improvement.

I don’t doubt a word of David’s post. Do you?

What I do doubt is the ability of the government to integrate its data. At least unless and until it makes some fundamental choices about the route it will take to data integration.

First, replacement of existing information systems is a non-goal. Unless that is an a prioriassumption, the politics, both on Capital Hill and internal to any agency, program, etc. will doom a data integration effort before it begins.

The first non-goal means that the ROI of data integration must be high enough to be evident even with current systems in place.

Second, integration of the most difficult cases is not the initial target for any data integration project. It would be offensive to cite all the “boil the ocean” projects that have failed in Washington, D.C. Let’s just agree that judicious picking of high value and reasonable effort integration cases are a good proving ground.

Third, the targets and costs for meeting those targets of data integration, along with expected ROI, will be agreed upon by all parties before any work starts. Avoidance of mission creep is essential to success. Not to mention that public goals and metrics will enable everyone to decide if the goals have been meet.

Fourth, employment of traditional vendors, unemployed programmers, geographically dispersed staff, etc. are also non-goals of the project. With the money that can be saved by robust data integration, departments can feather their staffs as much as they like.

If you need proof of the fourth requirement, consider the various Apache projects that are now the the underpinnings for “big data” in its many forms.

It is possible to solve the government’s data integration issues. But not without some hard choices being made up front about the project.

Sorry, forgot one:

Fifth, the project leader should seek a consensus among the relevant parties but ultimately has the authority to make decisions for the project. If every dispute can have one or more parties running to their supervisor or congressional backer, the project is doomed before it starts. The buck stops with the project manager and no where else.

Wellcome Images

Filed under: Data,Data Integration,Library,Museums — Patrick Durusau @ 5:47 pm

Thousands of years of visual culture made free through Wellcome Images

From the post:

We are delighted to announce that over 100,000 high resolution images including manuscripts, paintings, etchings, early photography and advertisements are now freely available through Wellcome Images.

Drawn from our vast historical holdings, the images are being released under the Creative Commons Attribution (CC-BY) licence.

This means that they can be used for commercial or personal purposes, with an acknowledgement of the original source (Wellcome Library, London). All of the images from our historical collections can be used free of charge.

The images can be downloaded in high-resolution directly from the Wellcome Images website for users to freely copy, distribute, edit, manipulate, and build upon as you wish, for personal or commercial use. The images range from ancient medical manuscripts to etchings by artists such as Vincent Van Gogh and Francisco Goya.

The earliest item is an Egyptian prescription on papyrus, and treasures include exquisite medieval illuminated manuscripts and anatomical drawings, from delicate 16th century fugitive sheets, whose hinged paper flaps reveal hidden viscera to Paolo Mascagni’s vibrantly coloured etching of an ‘exploded’ torso.

Other treasures include a beautiful Persian horoscope for the 15th-century prince Iskandar, sharply sketched satires by Rowlandson, Gillray and Cruikshank, as well as photography from Eadweard Muybridge’s studies of motion. John Thomson’s remarkable nineteenth century portraits from his travels in China can be downloaded, as well a newly added series of photographs of hysteric and epileptic patients at the famous Salpêtrière Hospital

Semantics or should I say semantic confusion is never far away. While viewing an image of Gladstone as Scrooge:

Gladstone

When “search by keyword” offered “colonies,” I assumed either the colonies of the UK at the time.

Imagine my surprise when among other images, Wellcome Images offered:

petri dish

The search by keywords had found fourteen petri dish images, three images of Batavia, seven maps of India (salt, leporsy), one half naked woman being held down, and the Gladstone image from earlier.

About what one expects from search these days but we could do better. Much better.

I first saw this in a tweet by Neil Saunders.

January 20, 2014

Data sharing, OpenTree and GoLife

Filed under: Biodiversity,Bioinformatics,Biology,Data Integration — Patrick Durusau @ 3:14 pm

Data sharing, OpenTree and GoLife

From the post:

NSF has released GoLife, the new solicitation that replaces both AToL and AVAToL. From the GoLife text:

The goals of the Genealogy of Life (GoLife) program are to resolve the phylogenetic history of life and to integrate this genealogical architecture with underlying organismal data.

Data completeness, open data and data integration are key components of these proposals – inferring well-sampled trees that are linked with other types of data (molecular, morphological, ecological, spatial, etc) and made easily available to scientific and non-scientific users. The solicitation requires that trees published by GoLife projects are published in a way that allows them to be understood and re-used by Open Tree of Life and other projects:

Integration and standardization of data consistent with three AVAToL projects: Open Tree of Life (www.opentreeoflife.org), ARBOR (www.arborworkflows.com), and Next Generation Phenomics (www.avatol.org/ngp) is required. Other data should be made available through broadly accessible community efforts (i.e., specimen data through iDigBio, occurrence data through BISON, etc). (I corrected the URLs for ARBOR and Next Generation Phenomics)

What does it mean to publish data consistent with Open Tree of Life? We have a short page on data sharing with OpenTree, a publication coming soon (we will update this post when it comes out) and we will be releasing our new curation / validation tool for phylogenetic data in the next few weeks.

A great resource on the NSF GoLife proposal that I just posted about.

Some other references:

AToL – Assembling the Tree of Life

AVATOL – Assembling, Visualizing and Analyzing the Tree of Life

Be sure to contact the Open Tree of Life group if you are interested in the GoLife project.

Genealogy of Life (GoLife)

Filed under: Bioinformatics,Biology,Data Integration — Patrick Durusau @ 2:43 pm

Genealogy of Life (GoLife) NSF.


Full Proposal Deadline Date: March 26, 2014
Fourth Wednesday in March, Annually Thereafter

Synopsis:

All of comparative biology depends on knowledge of the evolutionary relationships (phylogeny) of living and extinct organisms. In addition, understanding biodiversity and how it changes over time is only possible when Earth’s diversity is organized into a phylogenetic framework. The goals of the Genealogy of Life (GoLife) program are to resolve the phylogenetic history of life and to integrate this genealogical architecture with underlying organismal data.

The ultimate vision of this program is an open access, universal Genealogy of Life that will provide the comparative framework necessary for testing questions in systematics, evolutionary biology, ecology, and other fields. A further strategic integration of this genealogy of life with data layers from genomic, phenotypic, spatial, ecological and temporal data will produce a grand synthesis of biodiversity and evolutionary sciences. The resulting knowledge infrastructure will enable synthetic research on biological dynamics throughout the history of life on Earth, within current ecosystems, and for predictive modeling of the future evolution of life.

Projects submitted to this program should emphasize increased efficiency in contributing to a complete Genealogy of Life and integration of various types of organismal data with phylogenies.

This program also seeks to broadly train next generation, integrative phylogenetic biologists, creating the human resource infrastructure and workforce needed to tackle emerging research questions in comparative biology. Projects should train students for diverse careers by exposing them to the multidisciplinary areas of research within the proposal.

You may have noticed the emphasis on data integration:

to integrate this genealogical architecture with underlying organismal data.

comparative framework necessary for testing questions in systematics, evolutionary biology, ecology, and other fields

strategic integration of this genealogy of life with data layers from genomic, phenotypic, spatial, ecological and temporal data

synthetic research on biological dynamics

integration of various types of organismal data with phylogenies

next generation, integrative phylogenetic biologists

That sounds like a tall order! Particularly if your solution does not enable researchers to ask on what basis data was integrated as it was and by who?

If you can’t ask and answer those two questions, the more data and integration you mix together, the more fragile the integration structure will become.

I’m not trying to presume that such a project will use dynamic merging because it may well not. “Merging” in topic map terms may well be an operation ordered by a member of a group of curators. It is the capturing of the basis for that operation that makes it maintainable over a series of curators through time.

I first saw this at: Data sharing, OpenTree and GoLife, which I am about to post on but thought the NSF call merited a separate post as well.

January 14, 2014

Home Invasion by Google

Filed under: Data Integration,Privacy,Transparency — Patrick Durusau @ 2:58 pm

When Google closes the Nest deal, privacy issues for the internet of things will hit the big time by Stacey Higginbotham.

From the post:

Google rocked the smart home market Monday with its intention to purchase connected home thermostat maker Nest for $3.2 billion, which will force a much-needed conversation about data privacy and security for the internet of things.

It’s a conversation that has seemingly stalled as advocates for the connected home expound upon the benefits in convenience, energy efficiency and even the health of people who are collecting and connecting their data and devices together through a variety of gadgets and services. On the other side are hackers and security researchers who warn how easy some of the devices are to exploit — gaining control of data or even video streams about what’s going on in the home.

So far the government, in the form of the Federal Trade Commission — has been reluctant to make rules and is still gathering information. A security research told the FTC at a Nov. 19 event that companies should be fined for data breaches, which would encourage companies to design data protection into their products from the beginning. Needless to say, industry representatives were concerned that such an approach would “stifle innovation.” Even at CES an FTC commissioner expressed a similar sentiment — namely that the industry was too young for rules.

Stacey writes a bit further down:

Google’s race to gather data isn’t evil, but it could be a problem

My assumption is that Google intends to use the data it is racing to gather. Google may not know or foresee all the potential uses for the data it collects (sales to the NSA?) but it has been said: “Data is the new oil.” Big Data Is Not the New Oil by Jer Thorp.

Think of Google as a successful data wildcatter, which in the oil patch resulted in heirs wealthy enough to attempt to corner the world silver market.

Don’t be mislead by Jer’s title, he means to decry the c-suite use of a phrase read on a newsstand cover. Later he writes:

Still, there are some ways in which the metaphor might be useful.

Perhaps the “data as oil” idea can foster some much-needed criticality. Our experience with oil has been fraught; fortunes made have been balanced with dwindling resources, bloody mercenary conflicts, and a terrifying climate crisis. If we are indeed making the first steps into economic terrain that will be as transformative (and possibly as risky) as that of the petroleum industry, foresight will be key. We have already seen “data spills” happen (when large amounts of personal data are inadvertently leaked). Will it be much longer until we see dangerous data drilling practices? Or until we start to see long term effects from “data pollution”?

An accurate account of our experience with oil, as far as it goes.

Unlike Jer, I see data continuing to follow the same path as oil, coal, timber, gold, silver, gemstones, etc.

I say continuing because scribes were the original data brokers. And enjoyed a privileged role in society. Printing reduced the power of scribes but new data brokers took their place. Libraries and universities and those they trained had more “data” than others. Specific examples of scientia potentia est (“knowledge is power”), are found in: The Information Master: Jean-Baptiste Colbert‘s Secret State Intelligence System (Louis XiV) and IBM and the Holocaust. (Not to forget the NSA.)

Information, or “data” if you prefer, has always been used to advance some interests and used against others. The electronic storage of data has reduced the cost of using data that was known to exist but was too expensive or inaccessible for use.

Consider marital history. For the most part, with enough manual effort and travel, a person’s marital history has been available for the last couple of centuries. Records are kept of marriages, divorces, etc. But accessing that information wasn’t a few strokes on a keyboard and perhaps an access fee. Same data, different cost of access.

Jer’s proposals and others I have read, are all premised on people foregoing power, advantage, profit or other benefits from obtaining, analyzing and acting upon data.

I don’t know of any examples in the history where that has happened.

Do you?

January 8, 2014

Astera Centerprise

Filed under: Data Integration,Documentation — Patrick Durusau @ 4:28 pm

Asteria Centerprise

From the post:

The first in our Centerprise Best Practices Webinar Series discusses the features of Centerprise that make it the ideal integration solution for the high volume data warehouse. Topics include data quality (profiling, quality measurements, and validation), translating data to star schema (maintaining foreign key relationships and cardinality with slowly changing dimensions), and performance, including querying data with in-database joins and caching. We’ve posted the Q&A below, which delves into some interesting topics.

You can view the webinar video, as well as all our demo and tutorial videos, at Astera TV.

Very visual approach to data integration.

Be aware that comments on objects in a dataflow are a “planned” feature:

An exteremly useful (and simple) addition to Centerprise would be the ability to pin notes onto a flow to be quickly and easily seen by anyone who opens the flow.

This would work as an object which could be dragged to the flow, and allow the user enter enter a note which would remain on-screen, unlike the existing comments which require you to actually open the object and page to the ‘comments’ pane.

This sort of logging ability will prove very useful to explain to future dataflow maintainers why certain decisions were made in the design, as well as informing them of specific changes/additions and the reasons why they were enacted.

As Centerprise is almost ‘self-documenting’, the note-keeping ability would allow us to avoid maintaining and refering to seperate documentation (which can become lost)

A comment on each data object would be an improvement but a flat comment would be of limited utility.

A structured comment (perhaps extensible comment?) that captures the author, date, data source, target, etc. would make comments usefully searchable.

Including structured comments on the dataflows, transformations, maps and workflows themselves and to query for the presence of structured comments would be very useful.

A query for the existence of structured comments could help enforce local requirements for documenting data objects and operations.

September 12, 2013

…Wheat Data Interoperability Working Group

Filed under: Agriculture,Data Integration,Interoperability — Patrick Durusau @ 3:50 pm

Case statement: Wheat Data Interoperability Working Group

From the post:

The draft case statement for the Wheat Data Interoperability Working Group has been released

The Wheat data interoperability WG is a working group of the RDA Agricultural data interest group. The working group will take advantage of other RDA’s working group’s production. In particular, the working group will be watchful of working groups concerned with metadata, data harmonization and data publishing. 

The working group will also interact with the WheatIS experts and other plant projects such as TransPLANT, agINFRA which are built on standard technologies for data exchange and representation. The Wheat data interoperability group will exploit existing collaboration mechanisms like CIARD to get as much as possible stakeholder involvement in the work.

If you want to contribute with comments, do not hesitate to contact the Wheat Data Interoperability Working Group at Working group “Wheat data interoperability”.

References

Wheat initiative Information System:

GARNet report – Making data accessible to all:

Various relevant refs:

I know, agricultural interoperability doesn’t have the snap of universal suffrage, the crackle of a technological singularity or the pop of first contact.

On the other hand, with a world population estimated at 7.108 billion people, agriculture is an essential activity.

The specifics of wheat data interoperability should narrow down to meaningful requirements. Requirements with measures of success or failure.

Unlike measuring progress towards or away from less precise goals.

August 14, 2013

Social Remains Isolated From ‘Business-Critical’ Data

Filed under: Data Integration,Data Silos,Social Media — Patrick Durusau @ 2:29 pm

Social Remains Isolated From ‘Business-Critical’ Data by Aarti Shah.

From the post:

Social data — including posts, comments and reviews — are still largely isolated from business-critical enterprise data, according to a new report from the Altimeter Group.

The study considered 35 organizations — including Caesar’s Entertainment and Symantec — that use social data in context with enterprise data, defined as information collected from CRM, business intelligence, market research and email marketing, among other sources. It found that the average enterprise-class company owns 178 social accounts and 13 departments — including marketing, human resources, field sales and legal — are actively engaged on social platforms.

“Organizations have invested in social media and tools are consolidating but it’s all happening in a silo,” said Susan Etlinger, the report’s author. “Tools tend to be organized around departments because that’s where budgets live…and the silos continue because organizations are designed for departments to work fairly autonomously.”

Somewhat surprisingly, the report finds social data is often difficult to integrate because it is touched by so many organizational departments, all with varying perspectives on the information. The report also notes the numerous nuances within social data make it problematic to apply general metrics across the board and, in many organizations, social data doesn’t carry the same credibility as its enterprise counterpart. (emphasis added)

Isn’t the definition of a silo the organization of data from a certain perspective?

If so, why would it be surprising that different views on data make it difficult to integrate?

Viewing data from one perspective isn’t the same as viewing it from another perspective.

Not really a question of integration but of how easy/hard it is to view data from a variety of equally legitimate perspectives.

Rather than a quest for “the” view shouldn’t we be asking users: “What view serves you best?”

Older Posts »

Powered by WordPress