Another Word For It Patrick Durusau on Topic Maps and Semantic Diversity

February 16, 2018

@GalaxyKate, Generators, Steganographic Fields Forever (+ Secure Message Tip)

Filed under: Graphics,Steganography,Virtualization — Patrick Durusau @ 11:57 am

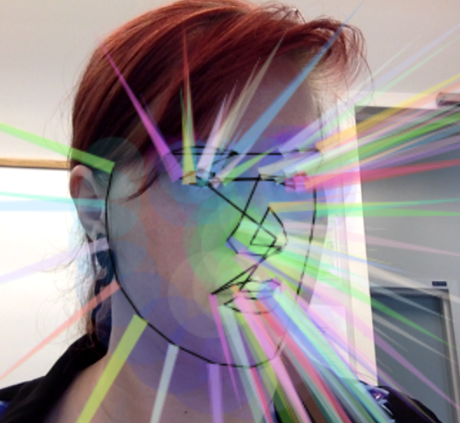
Before you skip this post as just being about “pretty images,” know that generators span grammars to constraint solvers. Artistry for sure, but exploration can lead to hard core CS rather quickly.

I stumbled upon a @GalaxyKate‘s Generative Art & Procedural Content Starter Kit

Practical Procedural Generation for Everyone: Thirty or so minutes on YouTube, 86,133 views when I checked the link.

So you want to build a generator: In depth blog post with lots of content and links.

Encyclopedia of Generativity: As far as I can tell, a one issue zine by @GalaxyKate but it will take months to explore.

One resource I found while chasing these links was: Procedural Generation.

Oh, and you owe it to yourself to visit GalaxyKate’s homepage:

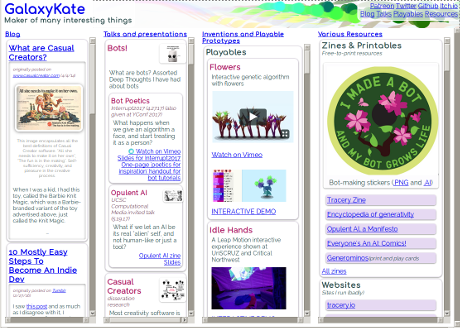
The small scale of my blog presentation makes that screenshot a pale imitation of what you will find. Great resource!

There’s no shortage of visual content on the Web, one estimate says in 2017, 74% of all internet traffic was video.

Still, if you practice steganographic concealment of information, you should make the work of the hounds as difficult as possible. Generators are an obvious way of working towards that goal.

One secure message tip: Other than for propaganda, which you want discovered and read, omit any greetings, closings, or other rote content, such as blessings, religious quotes, etc.

The famous German Enigma was broken by messages having the same opening text, routine information, closing text (Heil Hitler!), sending the same message in different encodings. Exploring the Enigma

Or in other words, Don’t repeat famous cryptographic mistakes!

January 15, 2014

XDATA@Kitware

Filed under: BigData,Data Analysis,Graphs,Vega,Virtualization,XDATA — Patrick Durusau @ 4:21 pm

XDATA@Kitware Big data unlocked, with the power of the Web.

From the webpage:

XDATA@Kitware is the engineering and research effort of a DARPA XDATA visualization team consisting of expertise from Kitware, Inc., Harvard University, University of Utah, Stanford University, Georgia Tech, and KnowledgeVis, LLC. XDATA is a DARPA-funded project to develop big data analysis and visualization solutions through utilizing and expanding open-source frameworks.

We are in the process of developing the Visualization Design Environment (VDE), a powerful yet intuitive user interface that will enable rapid development of visualization solutions with no programming required, using the Vega visualization grammar. The following index of web apps, hosted on the modular and flexible Tangelo web server framework, demonstrates some of the capabilities these tools will provide to solve a wide range of big data problems.

Examples:

Document Entity Relationships: Discover the network of named entities hidden within text documents

SSCI Predictive Database: Explore the progression of table partitioning in a predictive database.

Enron: Enron email visualization.

Flickr Metadata Maps: Explore the locations where millions of Flickr photos were taken

Biofabric Graph Visualization: An implementation of the Biofabric algorithm for visualizing large graphs.

SFC (Safe for c-suite) if you are there to explain them.

Related:

Vega (Trifacta, Inc.) – A visualization grammar, based on JSON, for specifying and representing visualizations.

January 6, 2014

LXC 1.0: Blog post series [0/10]

Filed under: Linux OS,Programming,Virtualization — Patrick Durusau @ 5:47 pm

LXC 1.0: Blog post series [0/10] by Stéphane Graber.

From the post:

So it’s almost the end of the year, I’ve got about 10 days of vacation for the holidays and a bit of time on my hands.

Since I’ve been doing quite a bit of work on LXC lately in prevision for the LXC 1.0 release early next year, I thought that it’d be a good use of some of that extra time to blog about the current state of LXC.

As a result, I’m preparing a series of 10 blog posts covering what I think are some of the most exciting features of LXC. The planned structure is:

Stéphane has promised to update the links on post 0/10 so keep that page bookmarked.

Whether you use LXC in practice or not, this a good enough introduction for you to ask probing questions.

And you may gain some insight into the identity issues that virtualization can give rise to.

February 21, 2013

Pfizer swaps out ETL for data virtualization tools

Filed under: Data Virtualization,Data Warehouse,ETL,Virtualization,Visualization — Patrick Durusau @ 7:35 pm

Pfizer swaps out ETL for data virtualization tools by Nicole Laskowski.

From the post:

Pfizer Inc.’s Worldwide Pharmaceutical Sciences division, which determines what new drugs will go to market, was at a technological fork in the road. Researchers were craving a more iterative approach to their work, but when it came to integrating data from different sources, the tools were so inflexible that work slowdowns were inevitable.

At the time, the pharmaceutical company was using one of the most common integration practices known as extract, transform, load (ETL). When a data integration request was made, ETL tools were used to reach into databases or other data sources, copy the requested data sets and transfer them to a data mart for users and applications to access.

But that’s not all. The Business Information Systems (BIS) unit of Pfizer, which processes data integration requests from the company’s Worldwide Pharmaceutical Sciences division, also had to collect specific requirements from the internal customer and thoroughly investigate the data inventory before proceeding with the ETL process.

“Back then, we were basically kind of in this data warehousing information factory mode,” said Michael Linhares, a research fellow and the BIS team leader.

Requests were repetitious and error-prone because ETL tools copy and then physically move the data from one point to another. Much of the data being accessed was housed in Excel spreadsheets, and by the time that information made its way to the data mart, it often looked different from how it did originally.

Plus, the integration requests were time-consuming since ETL tools process in batches. It wasn’t outside the realm of possibility for a project to take up to a year and cost $1 million, Linhares added. Sometimes, his team would finish an ETL job only to be informed it was no longer necessary.

“That’s just a sign that something takes too long,” he said.

Cost, quality and time issues aside, not every data integration request deserved this kind of investment. At times, researchers wanted quick answers; they wanted to test an idea, cross it off if it failed and move to the next one. But ETL tools meant working under rigid constraints. Once Linhares and his team completed an integration request, for example, they were unable to quickly add another field and introduce a new data source. Instead, they would have to build another ETL for that data source to be added to the data mart.

Bear in mind that we were just reminded, Leveraging Ontologies for Better Data Integration, that you have to understand data to integrate data.

That lesson holds true for integrating data after data virtualization.

Where are you going to write down your understanding of the meaning of the data you virtualize?

So subsequent users can benefit from your understanding of that data?

Or perhaps add their understanding to yours?

Or to have the capacity to merge collections of such understandings?

I would say a topic map.

You?

January 12, 2013

SDDC And The Elephant In the Room

Filed under: Data Silos,SDDC,Virtualization — Patrick Durusau @ 6:59 pm

SDDC And The Elephant In the Room by Chuck Hollis.

From the post:

Like many companies, we at EMC start our new year with a leadership gathering. We gather to celebrate, connect, strategize and share. They are *always* great events.

I found this year’s gathering was particularly rewarding in terms of deep content. The majority of the meeting was spent unpacking the depth behind the core elements of EMC’s strategy: cloud, big data and trust.

We dove in from a product and technology perspective. We came at it from a services view. Another take from a services and skills viewpoint. And, finally, the organizational and business model implications.

For me, it was like a wonderful meal that just went on and on. Rich, detailed and exceptionally well-thought out — although your head started to hurt after a while.

Underlying much of the discussion was the central notion of a software-defined datacenter (SDDC for short), representing the next generation of infrastructure and operational models. All through the discussion, that was clearly the conceptual foundation for so much of what needed to happen in the industry.

And I started to realize we still have a lot of explaining to do: not only around the concepts themselves, but what they mean to IT groups and the organizations they support.

I’ve now had some time to think and digest, and I wanted to add a few different perspectives to the mix.

The potential of software-defined datacenters (SDDC) comes across loud and clear in Chuck’s post. Particularly for ad-hoc integration of data sources for new purposes.

But then I remembered, silos aren’t built by software. Silos are build by users and software is just a means for building a silo.

Silos won’t become less frequent because of software-defined datacenters, unless users stop building silos.

There will be a potential for fewer silos and more pressure on users to build fewer silos, maybe, but that is no guarantee of fewer silos.

Even a subject-defined datacenter (SubDDC) cannot guarantee no silos.

A SubDDC that defines subjects in its data, structures and software offers a chance to move across silo barriers.

How much of a chance depends on its creator and the return from crossing across silo barriers.

October 31, 2011

Graph Words: A Free Visual Thesaurus of the English Language

Filed under: Thesaurus,Virtualization — Patrick Durusau @ 7:32 pm

Graph Words: A Free Visual Thesaurus of the English Language

From the post:

One of the very first examples of visualization that succeeds in merging beauty with function is Visual Thesaurus, a subscription-based online thesaurus and dictionary that shows the relationships between words through a beautiful interactive map.

The idea behind Graph Words [graphwords.com] is quite similar, though the service can be used completely free of charge.

Based on the knowledge captured in WordNet, a large lexical database of the English language, Graph Words is an interactive English dictionary and thesaurus that helps one find the meanings of words by revealing their connections among associated words. Any resulting network graph can also be stored as images.

I particularly liked “…helps one find the meanings of words by revealing their connections among associated words.”

I would argue that words only have meaning in the context of associated words. The unfortunate invention of the modern dictionary falsely portrays words as being independent of their context.

The standard Arabic dictionary, Lisan al-‘Arab (roughly, “The Arab Tongue”), was reported by my Arabic professor to be very difficult to use because the entries consisted of poetry and prose selections that illustrated the use of words in context. You have to be conversant to use the dictionary but that would be one of the reasons for using it, to become conversant. 😉 Both Lisan al-‘Arab (about 20,000 pages) and Lane’s Arabic-English Lexicon (about 8,000+ pages) are online now.

September 23, 2011

5 misconceptions about visualization

Filed under: Interface Research/Design,Virtualization — Patrick Durusau @ 6:28 pm

From the post:

Last month, I had the pleasure of spending a week at the Census Bureau as a “visiting scholar.” They’re looking to boost their visualization efforts across all departments, and I put in my two cents on how to go about doing it. For being a place where there is so much data, the visual side of things is still in the early stages, generally speaking.

During all the meetings, there were recurring themes about what visualization is and what it is used for. Some people really got it, but others were new to the subject, and we ran into a few misconceptions that I think are worth repeating.

Here we go, in no particular order.

Yeah, I moved the link.

Before you see Nathan’s list, take a piece of paper and write down why you have used visualization of data.

Got that? Now for the link:

5 misconceptions about visualization by Nathan Yau

Any to add to Nathan’s list? Perhaps from your own?

August 31, 2011

Turtles all the way down

Filed under: Computation,Computer Science,Processing,Virtualization — Patrick Durusau @ 7:41 pm

Turtles all the way down

From the website:

Decisive breakthrough from IBM researchers in Haifa introduces efficient nested virtualization for x86 hypervisors

What is nested virtualization and who needs it? Classical virtualization takes a physical computer and turns it into multiple logical, or virtual, computers. Each virtual machine can then interact independently, run its own operating environment, and basically behave like a separate physical resource. Hypervisor software is the secret sauce that makes virtualization possible by sitting in between the hardware and the operating system. It manages how the operating system and applications access the hardware.

IBM researchers found an efficient way to take one x86 hypervisor and run other hypervisors on top of it. For virtualization, this means that a virtual machine can be ‘turned into’ many machines, each with the potential to have its own unique environment, configuration, operating system, or security measures—which can in turn each be divided into more logical computers, and so on. With this breakthrough, x86 processors can now run multiple ‘hypervisors’ stacked, in parallel, and of different types.

This nested virtualization using one hypervisor on top of another is reminiscent of a tale popularized by Stephen Hawking. A little old lady argued with a lecturing scientist and insisted that the world is really a flat plate supported on the back of a giant tortoise. When the scientist asked what the tortoise is standing on, the woman answered sharply “But it’s turtles all the way down!” Inspired by this vision, the researchers named their solution the Turtles Project: Design and Implementation of Nested Virtualization

This awesome advance has been incorporated into the latest Linux release.

This is what I like about IBM, fundamental advances in computer science that can be turned into services for users.

One obvious use of this advance would be to segregate merging models in separate virtual machines. I am sure there are others.

Powered by WordPress