gvSIG
I encountered the gvSIG site while tracking down the latest release of i3Geo.
From its mission statement:
The gvSIG project was born in 2004 within a project that consisted in a full migration of the information technology systems of the Regional Ministry of Infrastructure and Transport of Valencia (Spain), henceforth CIT, to free software. Initially, It was born with some objectives according to CIT needs. These objectives were expanded rapidly because of two reasons principally: on the one hand, the nature of free software, which greatly enables the expansion of technology, knowledge, and lays down the bases on which to establish a community, and, on the other hand, a project vision embodied in some guidelines and a plan appropriate to implement it.
Some of the software projects you will find at gvSIG are:
gvSIG Desktop
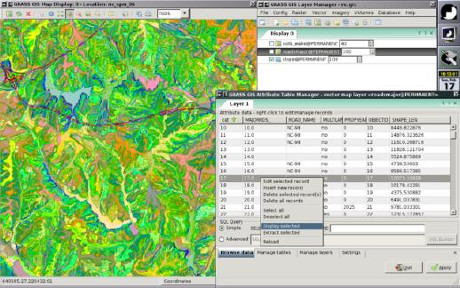
gvSIG is a Geographic Information System (GIS), that is, a desktop application designed for capturing, storing, handling, analyzing and deploying any kind of referenced geographic information in order to solve complex management and planning problems. gvSIG is known for having a user-friendly interface, being able to access the most common formats, both vector and raster ones. It features a wide range of tools for working with geographic-like information (query tools, layout creation, geoprocessing, networks, etc.), which turns gvSIG into the ideal tool for users working in the land realm.
gvSIG Mobile
gvSIG Mobile is a Geographic Information System (GIS) aimed at mobile devices, ideal for projects that capture and update data in the field. It’s known for having a user-friendly interface, being able to access the most common formats and a wide range of GIS and GPS tools which are ideal for working with geographic information.
gvSIG Mobile aims at broadening gvSIG Desktop execution platforms to a range of mobile devices, in order to give an answer to the needings of a growing number of mobile solutions users, who wish to use a GIS on different types of devices.
So far, gvSIG Mobile is a Geographic Information System, as well as a Spatial Data Infrastructures client for mobile devices. Such a client is also the first one licensed under open source.
I3Geo
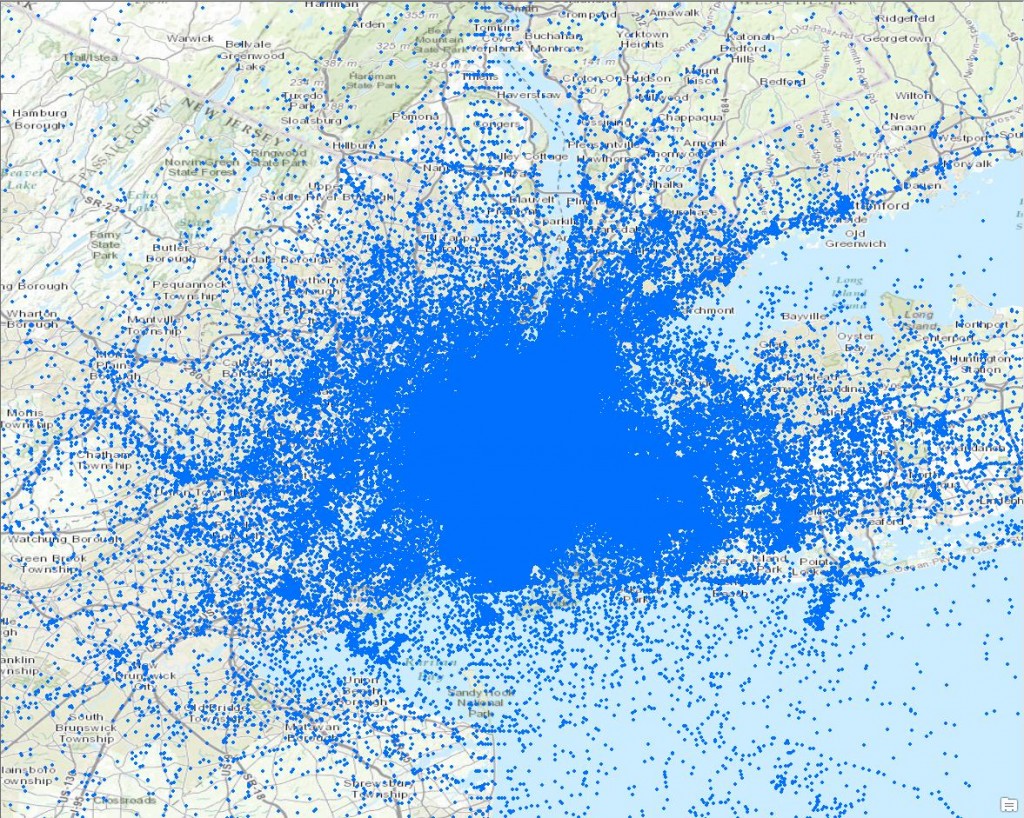
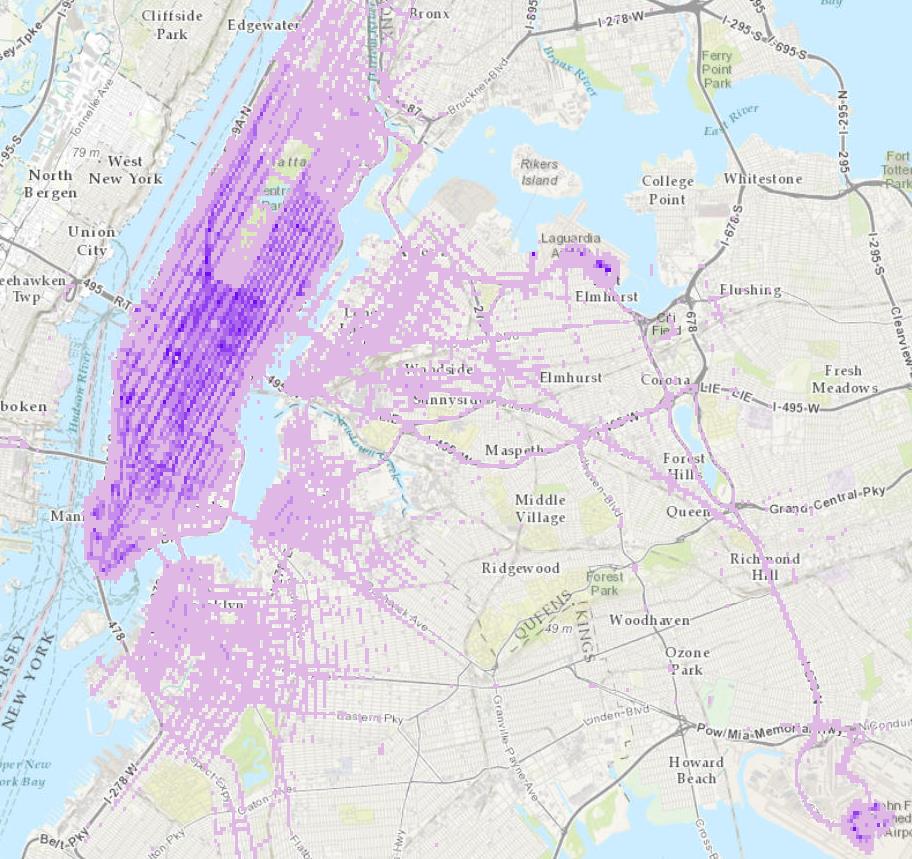
i3Geo is an application for the development of interactive web maps. It integrates several open source applications into a single development platform, mainly Mapserver and OpenLayers. Developed in PHP and Javascript, it has functionalities that allows the user to have better control over the map output, allowing to modify the legend of layers, to apply filters, to perform analysis, etc.
i3Geo is completely customizable and can be tailor to the different users using the interactive map. Furthermore, the spatial data is organized in a catalogue that offers online access services such as WMS, WFS, KML or the download of files.
i3Geo was developed by the Ministry of the Environment of Brazil and it is actually part of the Brazilian Public Software Portal.
gvSIG Educa
What is gvSIG Educa?
“If I can’t picture it, I can’t understand it (A. Einstein)”
gvSIG Educa is a customization of the gvSIG Desktop Open Source GIS, adapted as a tool for the education of issues that have a geographic component.
The aim of gvSIG Educa is to provide educators with a tool that helps students to analyse and understand space, and which can be adapted to different levels or education systems.
gvSIG Educa is not only useful for the teaching of geographic material, but can also be used for learning any subject that contains a spatial component such as history, economics, natural science, sociology…
gvSIG Educa facilitates learning by letting students interact with the information, by adding a spatial component to the study of the material, and by facilitating the assimilation of concepts through visual tools such as thematic maps.
gvSIG Educa provides analysis tools that help to understand spatial relationships.
Definitely a site to visit if you are interested in open source GIS software and/or projects.