Spark, D3, data visualization and Super Cow Powers by Mateusz Fedoryszak.
From the post:
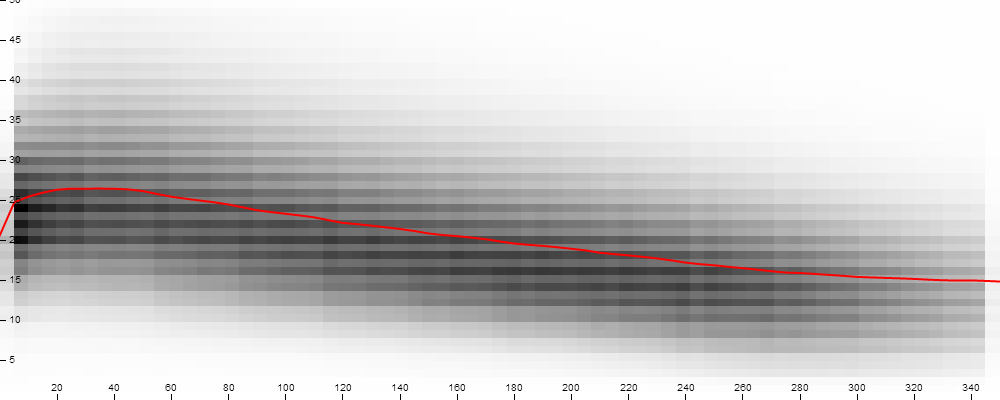
Did you know that the amount of milk given by a cow depends on the number of days since its last calving? A plot of this correlation is called a lactation curve. Read on to find out how do we use Apache Spark and D3 to find out how much milk we can expect on a particular day.
There are things that except for a client’s request, I have never been curious about. 
How are you using Spark?
I first saw this in a tweet by Anna Pawlicka