Another Word For It Patrick Durusau on Topic Maps and Semantic Diversity

October 22, 2014

Dabiq, ISIS and Data Skepticism

Filed under: News,Reporting,Skepticism — Patrick Durusau @ 2:54 pm

If you are following the Middle East, no doubt you have heard that ISIS/ISIL publishes Dabiq, a magazine that promotes its views. It isn’t hard to find articles quoting from Dabiq, but I wanted to find copies of Dabiq itself.

Clarion Project (Secondary Source for Dabiq)

After a bit of searching, I found that the Clarion Project is posting every issue of Dabiq as it appears.

The hosting site, Clarion Project, is a well known anti-Muslim hate group. The founders of the Clarion Project just happened to be full time employees of Aish Hatorah, a pro-Israel organization.

Coverage of Dabiq by Mother Jones (who should know better), ISIS Magazine Promotes Slavery, Rape, and Murder of Civilians in God’s Name relies on The Clarion Project “reprint” of Dabiq.

Internet Archive (Secondary Source for Dabiq)

The Islamic State Al-Hayat Media Centre (HMC) presents Dabiq Issue #1 (July 5, 2014).

All the issues at the Internet Archive claim to be from: “The Islamic State Al-Hayat Media Centre (HMC). I say “claim to be from” because uploading to the Internet Archive only requires an account with a verified email address. Anyone could have uploaded the documents.

Robert Mackey writes for the New York Times: Islamic State Propagandists Boast of Sexual Enslavement of Women and Girls and references Dabiq. I asked Robert for his source for Dabiq and he responded that it was the Internet Archive version.

Wall Street Journal

In Why the Islamic State Represents a Dangerous Turn in the Terror Threat, Gerald F. Seib writes:

It isn’t necessary to guess at what ISIS is up to. It declares its aims, tactics and religious rationales boldly, in multiple languages, for all the world to see. If you want to know, simply call up the first two editions of the organization’s remarkably sophisticated magazine, Dabiq, published this summer and conveniently offered in English online.

Gerald implies, at least to me, that Dabiq has a “official” website where it appears in multiple languages. But if you read Gerald’s article, there is no link to such a website.

I wrote to Gerald today to ask what site he meant when referring to Dabiq. I have not heard back from Gerald as of posting but will insert his response when it arrives.

The Jamestown Foundation

The Jamestown Foundation website featured: Hot Issue: Dabiq: What Islamic State’s New Magazine Tells Us about Their Strategic Direction, Recruitment Patterns and Guerrilla Doctrine by Michael W. S. Ryan, saying:

On the first day of Ramadan (June 28), the Islamic State in Iraq and Syria (ISIS) declared itself the new Islamic State and the new Caliphate (Khilafah). For the occasion, Abu Bakr al-Baghdadi, calling himself Caliph Ibrahim, broke with his customary secrecy to give a surprise khutbah (sermon) in Mosul before being rushed back into hiding. Al-Baghdadi’s khutbah addressed what to expect from the Islamic State. The publication of the first issue of the Islamic State’s official magazine, Dabiq, went into further detail about the Islamic State’s strategic direction, recruitment methods, political-military strategy, tribal alliances and why Saudi Arabia’s concerns that the Kingdom may be the Islamic State’s next target are well-founded.

Which featured a thumbnail of the cover of the first issue of Dabiq, with the following legend:

Dabiq Magazine (Source: Twitter user @umOmar246)

Well, that’s a problem because the Twitter user “@umOmar246” doesn’t exist.

Don’t take my word for it, go to Twitter, search for “umOmar246,” limit search results to people and you will see:

twitter results

I took the screen shot today just in case the results change at some point in time.

Other Media

Other media carry the same stories but without even attempting to cite a source. For example:

Jerusalem Post: ISIS threatens to conquer the Vatican, ‘break the crosses of the infidels’. Source? None.

Global News: The twisted view of ISIS in latest issue of propaganda magazine Dabiq by Nick Logan.

I don’t think that Nick appreciates the irony of the title of his post. Yes, this is a twisted view of ISIS. The question is who is responsible for it?

General Comments

Pick any issue of Dabiq and skim through it. What impressed me was the “over the top” presentation of cruelty. The hate literature I am familiar with (I grew up in the Deep South in the 1960’s) usually portrays the atrocities of others, not the group in question. Hate literature places its emphasis on the “other” group, the one to be targeted, not itself.

Analysis

First and foremost, the lack of any “official” site of origin for Dabiq makes me highly suspicious of the authenticity of the materials that claim to originate with ISIS.

Second, why would ISIS rely upon the Clarion Project as a distributor for its English language version of Dabiq, along with the Internet Archive?

Third, what are we to make of missing @umOmar246 from Twitter? Before you say that the account has closed, http://twittercounter.com/
doesn’t know that user either:

twitter counter results

A different aspect of consistency on distributed data. The aspect of getting “caught” because distributed data is difficult to make consistent.

Fourth, the media coverage examined relies upon sites with questionable authenticity but cites the material found there as though authoritative. Is this a new practice in journalism? Some of the media outlets examined are hardly new and upcoming Internet news sites.

Finally, the content of the magazines themselves don’t ring true for hate literature.

Conclusion

Debates about international and national policy should not be based on faked evidence (such as “yellow cake uranium“) or faked publications.

Based on what I have uncovered so far, attributing Dabiq to ISIS is highly questionable.

It appears to be an attempt to discredit ISIS and to provide a basis for whipping up support for military action by the United States and its allies.

The United States destroyed the legitimate government of Iraq on the basis of lies and fabrications. If only for nationalistic reasons, not spending American funds and lives based on a tissue of lies, let’s not make the same mistake again.

Disclaimer: I am not a supporter of ISIS nor would I choose to live in their state should they establish one. However, it will be their state and I lack the arrogance to demand that others follow social, religious or political norms that I prefer.

PS: If you have suggestions for other factors that either confirm a link between ISIS and Dabiq or cast further doubt on such a link, please post them in comments. Thanks!

October 21, 2014

Tweet NLP

Filed under: Natural Language Processing,Tweets — Patrick Durusau @ 7:57 pm

TWeet NLP (Carnegie Mellon)

From the webpage:

We provide a tokenizer, a part-of-speech tagger, hierarchical word clusters, and a dependency parser for tweets, along with annotated corpora and web-based annotation tools.

See the website for further details.

I can understand vendors mining tweets and try to react to every twitch in some social stream but the U.S. military is interested as well.

“Customer targeting” in their case has a whole different meaning.

Assuming you can identify one or more classes of tweets, would it be possible to mimic those patterns, albeit with some deviation in the content of the tweets? That is what tweet content is weighted heavier that other tweet content?

I first saw this in a tweet by Peter Skomoroch.

The Cartographer Who’s Transforming Map Design

Filed under: Cartography,Mapping,Maps — Patrick Durusau @ 7:30 pm

The Cartographer Who’s Transforming Map Design by Greg Miller.

From the post:

Cindy Brewer seemed to attract a small crowd everywhere she went at a recent cartography conference here. If she sat, students and colleagues milled around, waiting for a chance to talk to her. If she walked, a gaggle of people followed.

Brewer, who chairs the geography program at Penn State, is a popular figure in part because she has devoted much of her career to helping other people make better maps. By bringing research on visual perception to bear on design, Brewer says, cartographers can make maps that are more effective and more intuitive to understand. Many of the same lessons apply equally well to other types of data visualization.

Brewer’s best-known invention is a website called Color Brewer, which helps mapmakers pick a color scheme that’s well-suited for communicating the particular type of data they’re mapping. More recently she’s moved on to other cartographic design dilemmas, from picking fonts to deciding what features should change or disappear as the scale of a map changes (or zooms in and out, as non-cartographers would say). She’s currently helping the U.S. Geological Survey apply the lessons she’s learned from her research to redesign its huge collection of national topographic maps.

A must read if you want to improve the usefulness of your interfaces.

I say a “must read,” but this is just an overview of Cindy’s work.

A better starting place would be Cindy’s homepage at UPenn.

The Harvard Classics: Download All 51 Volumes as Free eBooks

Filed under: Data,History — Patrick Durusau @ 7:06 pm

The Harvard Classics: Download All 51 Volumes as Free eBooks by Josh Jones.

From the post:

Every revolutionary age produces its own kind of nostalgia. Faced with the enormous social and economic upheavals at the nineteenth century’s end, learned Victorians like Walter Pater, John Ruskin, and Matthew Arnold looked to High Church models and played the bishops of Western culture, with a monkish devotion to preserving and transmitting old texts and traditions and turning back to simpler ways of life. It was in 1909, the nadir of this milieu, before the advent of modernism and world war, that The Harvard Classics took shape. Compiled by Harvard’s president Charles W. Eliot and called at first Dr. Eliot’s Five Foot Shelf, the compendium of literature, philosophy, and the sciences, writes Adam Kirsch in Harvard Magazine, served as a “monument from a more humane and confident time” (or so its upper classes believed), and a “time capsule…. In 50 volumes.”

What does the massive collection preserve? For one thing, writes Kirsch, it’s “a record of what President Eliot’s America, and his Harvard, thought best in their own heritage.” Eliot’s intentions for his work differed somewhat from those of his English peers. Rather than simply curating for posterity “the best that has been thought and said” (in the words of Matthew Arnold), Eliot meant his anthology as a “portable university”—a pragmatic set of tools, to be sure, and also, of course, a product. He suggested that the full set of texts might be divided into a set of six courses on such conservative themes as “The History of Civilization” and “Religion and Philosophy,” and yet, writes Kirsch, “in a more profound sense, the lesson taught by the Harvard Classics is ‘Progress.’” “Eliot’s [1910] introduction expresses complete faith in the ‘intermittent and irregular progress from barbarism to civilization.’”

Great reading in addition to being a snapshot of a time in history.

Good data set for testing text analysis tools.

For example, Josh mentions “progress” as a point of view in the Harvard Classics, as if that view does not persist today. I would be hard pressed to explain American foreign policy and its posturing about how states should behave aside from “complete faith” in progress.

What text collection would you compare the Harvard Classics to today to arrive at a judgement on their respective views of progress?

I first saw this in a tweet by Open Culture.

Top 30 Computer Science and Programming Blogs 2014

Filed under: Computer Science,Programming — Patrick Durusau @ 6:37 pm

Top 30 Computer Science and Programming Blogs 2014 by Benjamin Hicks.

From the post:

A major in computer science and programming opens many lucrative doors. Many of these students become software engineers and programmers at one of the many technological companies throughout the country. Others find computational theory attractive. Graduate degrees strengthen students’ skills, increasing their value to employers. Since the field is rapidly advancing, many blogs have sprung up to address all aspects of the field. But which ones are the best to read and why? This list of thirty blogs represents a diverse array of perspectives on computer science, programming, computational theory, and the intersection of computer science with contemporary issues such as education, women in the sciences, business, and many more.

Great material for a “seed list” if you are running your own search engine!

I first saw this in a tweet by Computer Science.

TinkerPop 3.0.0.M4 Released (A Gremlin Rāga in 7/16 Time)

Filed under: Graphs,Gremlin,TinkerPop — Patrick Durusau @ 4:50 pm

TinkerPop 3.0.0.M4 Released (A Gremlin Rāga in 7/16 Time) by Marko Rodriguez.

From the post:

TinkerPop (http://tinkerpop.com) is happy to announce the release of TinkerPop 3.0.0.M4.

gremlin-hindu

Documentation

User Documentation: http://www.tinkerpop.com/docs/3.0.0.M4/
Core JavaDoc: http://www.tinkerpop.com/javadocs/3.0.0.M4/core/ [user javadocs]
Full JavaDoc : http://www.tinkerpop.com/javadocs/3.0.0.M4/full/ [vendor javadocs]

Downloads

Gremlin Console: http://tinkerpop.com/downloads/3.0.0.M4/gremlin-console-3.0.0.M4.zip
Gremlin Server: http://tinkerpop.com/downloads/3.0.0.M4/gremlin-server-3.0.0.M4.zip

There were lots of updates in this release — with a lot of valuable feedback provided by Titan (Matthias), Titan-Hadoop (Dan), FoundationDB (Mike), PostgreSQL-Gremlin (Pieter), and Gremlin-Scala (Mike).

https://github.com/tinkerpop/tinkerpop3/blob/master/CHANGELOG.asciidoc

We are very close to a GA. We think that either there will be a “minor M5” or the next release will be GA. Why the delay? We are currently working closely with the Titan team to see if there are any problems in our interfaces/test-suites/etc. The benefit of working with the Titan team is that they are doing both OLTP and OLAP so are covering the full gamut of the TinkerPop3 API. Of course, we have had lots of experience with these APIs for both Neo4j (OTLP) and Giraph (OLAP), but to see it standup to yet another vendor’s requirements will be a confidence boost for GA. If you are vendor, please feel free to join the conversation as your input is crucial to making sure GA meets everyone’s needs.

A few important notes for users:
1. The GremlinKryo serialization format is not guaranteed to be stable from MX to MY. By GA it will be locked.
2. Neo4j-Gremlin’s disk representation is not guaranteed to be stable from MX to MY. By GA it will be locked.
3. Giraph-Gremlin’s Hadoop Writable specification is not guaranteed to be stable from MX to MY. By GA it will be locked.
4. VertexProgram, Memory, Step, SideEffects, etc. hidden and system labels may change between MX and MY. By GA they will be locked.
5. Package and class names might change from MX to MY. By GA they will be locked.

Thank you everyone. Please play and provide feedback. This is the time to get your ideas into TinkerPop3 as once it goes GA, sweeping changes are going to be more difficult.

How to Make More Published Research True

Filed under: Research Methods,Researchers,Science — Patrick Durusau @ 3:03 pm

How to Make More Published Research True by John P. A. Ioannidis. (DOI: 10.1371/journal.pmed.1001747)

If you think the title is provocative, check out the first paragraph:

The achievements of scientific research are amazing. Science has grown from the occupation of a few dilettanti into a vibrant global industry with more than 15,000,000 people authoring more than 25,000,000 scientific papers in 1996–2011 alone [1]. However, true and readily applicable major discoveries are far fewer. Many new proposed associations and/or effects are false or grossly exaggerated [2],[3], and translation of knowledge into useful applications is often slow and potentially inefficient [4]. Given the abundance of data, research on research (i.e., meta-research) can derive empirical estimates of the prevalence of risk factors for high false-positive rates (underpowered studies; small effect sizes; low pre-study odds; flexibility in designs, definitions, outcomes, analyses; biases and conflicts of interest; bandwagon patterns; and lack of collaboration) [3]. Currently, an estimated 85% of research resources are wasted [5]. (footnote links omitted, emphasis added)

I doubt anyone can disagree with the need for reform in scientific research, but it is one thing to call for reform in general versus the specific.

The following story depends a great deal on cultural context, Southern religious cultural context, but I will tell the story and then attempt to explain if necessary.

One Sunday morning service the minister was delivering a powerful sermon on sins that his flock could avoid. He touched on drinking and smoking at length and as he ended each of those, an older woman in the front pew would “Amen!” very loudly. The same response was given to his condemnation of smoking. Finally, the sermon touched on dipping snuff and chewing tobacco. Dead silence from the older woman on the front row. The sermon ended some time later, hymns were sung and the congregation was dismissed.

As the congregation exited the church, the minister stood at the door, greeting one and all. Finally the older woman from the front pew appeared and the minister greeted her warmly. She had after all, appeared to enjoy most of his sermon. After some small talk, the minister did say: “You liked most of my sermon but you became very quite when I mentioned dipping snuff and chewing tobacco. If you don’t mind, can you tell me what was different about that part?” To which the old woman replied: “I was very happy while you were preaching but then you went to meddling.”

So long as the minister was talking about the “sins” that she did not practice, that was preaching. When the minister starting talking about “sins” she committed like dipping snuff or chewing tobacco, that was “meddling.”

I suspect that Ioannidis’ preaching will find widespread support but when you get down to actual projects and experiments, well, you have gone to “meddling.”

In order to root out waste, it will be necessary to map out who benefits from such projects, who supported them, who participated, and their relationships to others and other projects.

Considering that universities are rumored to get at least fifty (50) to (60) percent of grants as administrative overhead, they are unlikely to be your allies in creating such mappings or reducing waste in any way. Appeals to funders may be effective, save some funders, like the NIH, have an investment in the research structure as it exists.

Whatever the odds of change, naming names, charting relationships over time and interests in projects is at least a step down the road to useful rather than remunerative scientific research.

Topic map excel at modeling relationships, whether known at the outset of your tracking or lately discovered, unexpectedly.

PS: With a topic map you can skip endless committee meetings with each project to agree on how to track that project and their methodologies for waste, should any waste exists. Yes, the first line of a tar baby (in it’s traditional West African sense) defense by universities and others, let’s have a pre-meeting to plan our first meeting, etc.

Big Data: 20 Free Big Data Sources Everyone Should Know

Filed under: BigData — Patrick Durusau @ 10:07 am

Big Data: 20 Free Big Data Sources Everyone Should Know Bernard Marr.

From the post:

I always make the point that data is everywhere – and that a lot of it is free. Companies don’t necessarily have to build their own massive data repositories before starting with big data analytics. The moves by companies and governments to put large amounts of information into the public domain have made large volumes of data accessible to everyone.

Any company, from big blue chip corporations to the tiniest start-up can now leverage more data than ever before. Many of my clients ask me for the top data sources they could use in their big data endeavour and here’s my rundown of some of the best free big data sources available today.

I didn’t see anything startling but it is a good top 20 list for a starting point. Would make a great start on a one to two page big data cheat sheet. Will have to give some thought to that idea.

October 20, 2014

LSD Dimensions

Filed under: Linked Data,RDF,RDF Data Cube Vocabulary,Statistics — Patrick Durusau @ 7:50 pm

LSD Dimensions

From the about page: http://lsd-dimensions.org/dimensions

LSD Dimensions is an observatory of the current usage of dimensions and codes in Linked Statistical Data (LSD).

LSD Dimensions is an aggregator of all qb:DimensionProperty resources (and their associated triples), as defined in the RDF Data Cube vocabulary (W3C recommendation for publishing statistical data on the Web), that can be currently found in the Linked Data Cloud (read: the SPARQL endpoints in Datahub.io). Its purpose is to improve the reusability of statistical dimensions, codes and concept schemes in the Web of Data, providing an interface for users (future work: also for programs) to search for resources commonly used to describe open statistical datasets.

Usage

The main view shows the count of queried SPARQL endpoints and the number of retrieved dimensions, together with a table that displays these dimensions.

  • Sorting. Dimensions can be sorted by their dimension URI, label and number of references (i.e. number of times a dimension is used in the endpoints) by clicking on the column headers.
  • Pagination. The number of rows per page can be customized and browsed by clicking at the bottom selectors.
  • Search. String-based search can be performed by writing the search query in the top search field.

Any of these dimensions can be further explored by clicking at the eye icon on the left. The dimension detail view shows

  • Endpoints.. The endpoints that make use of that dimension.
  • Codes. Popular codes that are defined (future work: also assigned) as valid values for that dimension.

Motivation

RDF Data Cube (QB) has boosted the publication of Linked Statistical Data (LSD) as Linked Open Data (LOD) by providing a means “to publish multi-dimensional data, such as statistics, on the web in such a way that they can be linked to related data sets and concepts”. QB defines cubes as sets of observations affected by dimensions, measures and attributes. For example, the observation “the measured life expectancy of males in Newport in the period 2004-2006 is 76.7 years” has three dimensions (time period, with value 2004-2006; region, with value Newport; and sex, with value male), a measure (population life expectancy) and two attributes (the units of measure, years; and the metadata status, measured, to make explicit that the observation was measured instead of, for instance, estimated or interpolated). In some cases, it is useful to also define codes, a closed set of values taken by a dimension (e.g. sensible codes for the dimension sex could be male and female).

There is a vast diversity of domains to publish LSD about, and quite some dimensions and codes can be very heterogeneous, domain specific and hardly comparable. To this end, QB allows users to mint their own URIs to create arbitrary dimensions and associated codes. Conversely, some other dimensions and codes are quite common in statistics, and could be easily reused. However, publishers of LSD have no means to monitor the dimensions and codes currently used in other datasets published in QB as LOD, and consequently they cannot (a) link to them; nor (b) reuse them.

This is the motivation behind LSD Dimensions: it monitors the usage of existing dimensions and codes in LSD. It allows users to browse, search and gain insight into these dimensions and codes. We depict the diversity of statistical variables in LOD, improving their reusability.

(Emphasis added.)

The highlighted text:

There is a vast diversity of domains to publish LSD about, and quite some dimensions and codes can be very heterogeneous, domain specific and hardly comparable.

is the key isn’t it? If you can’t rely on data titles, users must examine the data and determine which sets can or should be compared.

The question then is how do you capture the information such users developed in making those decisions and pass it on to following users? Or do you just allow following users make their own way afresh?

If you document the additional information for each data set, by using a topic map, each use of this resource becomes richer for the following users. Richer or stays the same. Your call.

I first saw this in a tweet by Bob DuCharme. Who remarked this organization has a great title!

If you have made it this far, you realize that with all the data set, RDF and statistical language this isn’t the post you were looking for. 😉

PS: Yes Bob, it is a great title!

Can We Talk? Finding A Common Security Language

Filed under: Cybersecurity,Marketing,Security — Patrick Durusau @ 3:57 pm

Can We Talk? Finding A Common Security Language by Jason Polancich.

From the post:


Today’s enterprises, and their CEOs and board members, are increasingly impacted by everyday cybercrime. However, despite swelling budgets and ever-expanding resource allocations, many enterprises are actually losing ground in the fight to protect vital business operations from cyberharm.

While there are many reasons for this, none is as puzzling as the inability of executives and other senior management to communicate with their own security professionals. One major reason for this dysfunction hides in plain sight: There is no mutually understood, shared, and high-level language between the two sides via which both can really connect, perform critical analysis, make efficient and faster decisions, develop strategies, and, ultimately, work with less friction.

In short, it’s as if there’s a conversation going on where one side is speaking French, one side Russian, and they’re working through an English translator who’s using pocket travel guides for both languages.

In other business domains, such as sales or financial performance, there are time-tested and well-understood standards for expressing concepts and data — in words. For example, things like “Run Rate” or “Debt-to-Equity Ratio” allow those people pulling the levers and pushing the buttons in an organization’s financial operations to percolate up important reporting for business leaders to use when steering the enterprise ship.

This is all made possible by a shared language of terms and classifications.

For the area of business where cyber security and business overlap, there’s no common, intuitive, business intelligence or key performance indicator (KPI) language that security professionals and business leaders share to communicate effectively. No common or generally accepted business terms and metric specifications in place to routinely track, analyze, and express how cybercrime affects a business. And, for the leaders and security professionals alike, this gap affects both sides equally.

I think John’s summary is one that you could pitch in an elevator to almost any CEO:

In short, it’s as if there’s a conversation going on where one side is speaking French, one side Russian, and they’re working through an English translator who’s using pocket travel guides for both languages. (emphasis added)

John has some concrete suggestions for enterprises to start towards overcoming this language barrier. See his post for the details.

I would like to take his suggestions a step further, since the language of security is constantly changing, and suggest you make your solution maintainable by not simply cataloging terms and where they fit into your business model, but capture how you identified those terms.

I don’t think the term firewall is going to lose its currency any time soon but exactly what do you mean by firewall and more importantly, where are they? Configured by who? And with what rules? That just a trivial example and you can supply many more.

Take John’s advice and work to overcome the language barrier between the security and business camps in your enterprise. The bonus to using a topic map is that it can be maintained over time, just as your security should be.

20th Century Death

Filed under: Graphics,History,Visualization — Patrick Durusau @ 3:42 pm

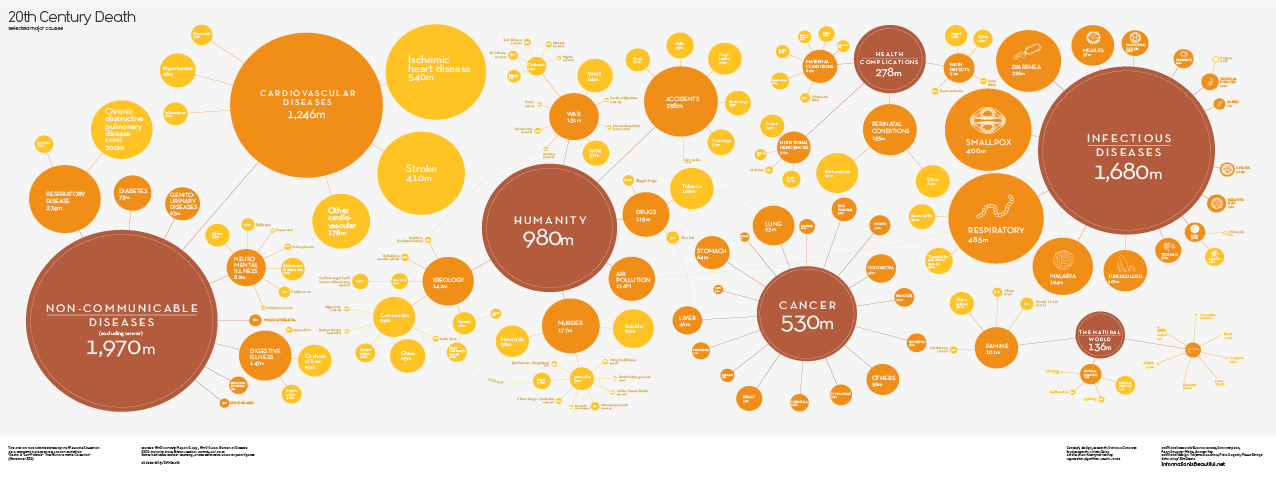
20th century death

I first saw this visualization reported by Randy Krum at 20th Century Death, who then pointed to Information is Beautiful, a blog by David McCandless, where the image originates under: 20th Century Death.

David has posted a high-resolution PDF version, the underlying data and requests your assistance in honing the data.

What is missing from this visualization?

Give up?

Terrorism!

I don’t think extending the chart into the 21st century would make any difference. The smallest death total I saw was in the 1.5 million range. Hard to attribute that kind of death total to terrorism.

The reason I mention the absence of terrorism is that a comparison of these causes of death, at least the preventable ones, to spending on their prevention could be instructive.

You could insert a pin head dot terrorism and point to it with an arrow. Then compare the spending on terrorisms versus infectious diseases.

Between 1993 and 2010, Al-Qaeda was responsible for 4,004 deaths.

As of October 12, 2014, the current confirmed Ebola death toll is 4493.

The CDC is predicting (curently) some 550K Ebola cases by January 2015. With a seventy (70%) mortality rate, well, you do the numbers.

What graphic would you use to persuade decision makers on spending funds in the future?

August 2014 Crawl Data Available

Filed under: Common Crawl,Data — Patrick Durusau @ 3:03 pm

August 2014 Crawl Data Available by Stephen Merity.

From the post:

The August crawl of 2014 is now available! The new dataset is over 200TB in size containing approximately 2.8 billion webpages. The new data is located in the aws-publicdatasets bucket at /common-crawl/crawl-data/CC-MAIN-2014-35/.

To assist with exploring and using the dataset, we’ve provided gzipped files that list:

By simply adding either s3://aws-publicdatasets/ or https://aws-publicdatasets.s3.amazonaws.com/ to each line, you end up with the S3 and HTTP paths respectively.

Thanks again to blekko for their ongoing donation of URLs for our crawl!

Have you considered diffing the same webpages from different crawls?

Just curious. Could be empirical evidence of which websites are stable and those were content could change from under you.

October 19, 2014

DeepView: Computational Tools for Chess Spectatorship [Knowledge Retention?]

Filed under: Games,Knowledge Retention,Narrative — Patrick Durusau @ 3:34 pm

DeepView: Computational Tools for Chess Spectatorship by Greg Borenstein, Prof. Kevin Slavin, Grandmaster Maurice Ashley.

From the post:

DeepView is a suite of computational and statistical tools meant to help novice viewers understand the drama of a high-level chess match through storytelling. Good drama includes characters and situations. We worked with GM Ashley to indentify the elements of individual player’s styles and the components of an ongoing match that computation could analyze to help bring chess to life. We gathered an archive of more than 750,000 games from chessgames.com including extensive collections of games played by each of the grandmasters in the tournament. We then used the Stockfish open source chess engine to analyze the details of each move within these games. We combined these results into a comprehensive statistical analysis that provided us with meaningful and compelling information to pass on to viewers and to provide to chess commentators to aid in their work.

The questions we answered include:

In addition to making chess more accessible to novice viewers, we believe that providing access to these kinds of statistics will change how expert players play chess, allowing them to prepare differently for specific opponents and to detect limitations or quirks in their own play.

Further, we believe that the techniques used here could be applied to other sports and games as well. Specifically we wonder why traditional sports broadcasting doesn’t use measures of significance to filter or interpret the statistics they show to their viewers. For example, is a batter’s RBI count actually informative without knowing whether it is typical or extraordinary compared to other players? And when it comes to eSports with their exploding viewer population, this approach points to rich possibilities improving the spectator experience and translating complex gameplay so it is more legible for novice fans.

A deeply intriguing notion of mining data to extract patterns that are fashioned into a narrative by an expert.

Participants in the games were not called upon to make explicit the tacit knowledge they unconsciously rely upon to make decisions. Instead, decisions (moves) were collated into patterns and an expert recognized those patterns to make the tacit knowledge explicit.

Outside of games would this be a viable tactic for knowledge retention? Not asking employees/experts but recording their decisions and mining those for later annotation?

October 18, 2014

Another Greek update: Forty-six more manuscripts online!

Filed under: British Library,Manuscripts — Patrick Durusau @ 8:25 pm

Another Greek update: Forty-six more manuscripts online! by Sarah J. Biggs.

From the post:

It’s time for a monthly progress report on our Greek Manuscripts Digitisation Project, generously funded by the Stavros Niarchos Foundation and many others, including the A. G. Leventis Foundation, Sam Fogg, the Sylvia Ioannou Foundation, the Thriplow Charitable Trust, and the Friends of the British Library. There are some very exciting items in this batch, most notably the famous Codex Crippsianus(Burney MS 95), the most important manuscript for the text of the Minor Attic Orators; Egerton MS 942, a very fine copy of Demosthenes; a 19th-century poem and prose narrative on the Greek Revolution (Add MS 35072); a number of collections of 16th- and 17th-century complimentary verses in Greek and Latin dedicated to members of the Royal Family; and an exciting array of classical and patristic texts.

Texts that helped to shape the world we experience today. As did others but Greek texts played a special role in European history.

You can find ways to support the Greek Digitization project here.

I prefer, ahem, other material and for that you can consult:

The Latest, Greatest, Up-To-Datest Giant List of Digitised Manuscripts Hyperlinks.

Which list 1111 (eleventy-one-one?) manuscripts. Quite impressive.

Do consider supporting the British Library in this project and others. Some profess interest in sharing our common heritage. The British Library is sharing our common heritage. Your choice.

Tupleware: Redefining Modern Analytics

Filed under: Distributed Computing,Functional Programming — Patrick Durusau @ 8:09 pm

Tupleware: Redefining Modern Analytics by Andrew Crotty and Alexander Galakatos.

From the post:

Up until a decade ago, most companies sufficed with simple statistics and offline reporting, relying on traditional database management systems (DBMSs) to meet their basic business intelligence needs. This model prevailed in a time when data was small and analysis was simple.

But data has gone from being scarce to superabundant, and now companies want to leverage this wealth of information in order to make smarter business decisions. This data explosion has given rise to a host of new analytics platforms aimed at flexible processing in the cloud. Well-known systems like Hadoop and Spark are built upon the MapReduce paradigm and fulfill a role beyond the capabilities of traditional DBMSs. However, these systems are engineered for deployment on hundreds or thousands of cheap commodity machines, but non-tech companies like banks or retailers rarely operate clusters larger than a few dozen nodes. Analytics platforms, then, should no longer be built specifically to accommodate the bottlenecks of large cloud deployments, focusing instead on small clusters with more reliable hardware.

Furthermore, computational complexity is rapidly increasing, as companies seek to incorporate advanced data mining and probabilistic models into their business intelligence repertoire. Users commonly express these types of tasks as a workflow of user-defined functions (UDFs), and they want the ability to compose jobs in their favorite programming language. Yet, existing analytics systems fail to adequately serve this new generation of highly complex, UDF-centric jobs, especially when companies have limited resources or require sub-second response times. So what is the next logical step?

It’s time for a new breed of systems. In particular, a platform geared toward modern analytics needs the ability to (1) concisely express complex workflows, (2) optimize specifically for UDFs, and (3) leverage the characteristics of the underlying hardware. To meet these requirements, the Database Group at Brown University is developing Tupleware, a parallel high-performance UDF processing system that considers the data, computations, and hardware together to produce results as efficiently as possible.

The article is the “lite” introduction to Tuppleware. You may be more interested in:

Tupleware: Redefining Modern Analytics (the paper):

Abstract:

There is a fundamental discrepancy between the targeted and actual users of current analytics frameworks. Most systems are designed for the data and infrastructure of the Googles and Facebooks of the world—petabytes of data distributed across large cloud deployments consisting of thousands of cheap commodity machines. Yet, the vast majority of users operate clusters ranging from a few to a few dozen nodes, analyze relatively small datasets of up to several terabytes, and perform primarily compute-intensive operations. Targeting these users fundamentally changes the way we should build analytics systems.

This paper describes the design of Tupleware, a new system specifically aimed at the challenges faced by the typical user. Tupleware’s architecture brings together ideas from the database, compiler, and programming languages communities to create a powerful end-to-end solution for data analysis. We propose novel techniques that consider the data, computations, and hardware together to achieve maximum performance on a case-by-case basis. Our experimental evaluation quantifies the impact of our novel techniques and shows orders of magnitude performance improvement over alternative systems.

Subject to the “in memory” limitation, speedups of 10 – 6,000x over other systems are nothing to dismiss without further consideration.

Interesting to see that “medium” data now reaches into the terabyte range. 😉

Are “mini-clouds” in the offing that provide specialized processing models?

The Tuppleware website.

I first saw this in a post by Danny Bickson, Tuppleware.

Data Sources for Cool Data Science Projects: Part 1

Filed under: Data — Patrick Durusau @ 6:58 pm

Data Sources for Cool Data Science Projects: Part 1

From the post:

At The Data Incubator, we run a free six week data science fellowship to help our Fellows land industry jobs. Our hiring partners love considering Fellows who don’t mind getting their hands dirty with data. That’s why our Fellows work on cool capstone projects that showcase those skills. One of the biggest obstacles to successful projects has been getting access to interesting data. Here are a few cool public data sources you can use for your next project:

Nothing surprising or unfamiliar but at least you know what the folks at Data Incubator think is “cool” and/or important. Intell is never a waste.

Enjoy!

Introducing Pyleus: An Open-source Framework for Building Storm Topologies in Pure Python

Filed under: Python,Storm — Patrick Durusau @ 10:42 am

Introducing Pyleus: An Open-source Framework for Building Storm Topologies in Pure Python by Patrick L.

From the post:

Yelp loves Python, and we use it at scale to power our websites and process the huge amount of data we produce.

Pyleus is a new open-source framework that aims to do for Storm what mrjob, another open-source Yelp project, does for Hadoop: let developers process large amounts of data in pure Python and iterate quickly, spending more time solving business-related problems and less time concerned with the underlying platform.

First, a brief introduction to Storm. From the project’s website, “Apache Storm is a free and open source distributed realtime computation system. Storm makes it easy to reliably process unbounded streams of data, doing for realtime processing what Hadoop did for batch processing.”

A Pyleus topology consists of, at minimum, a YAML file describing the structure of the topology, declaring each component and how tuples flow between them. The pyleus command-line tool builds a self-contained Storm JAR which can be submitted to any Storm cluster.

Since the U.S. baseball league championships are over, something to occupy you over the weekend. 😉

October 17, 2014

Update with 162 new papers to Deeplearning.University Bibliography

Filed under: Deep Learning — Patrick Durusau @ 6:57 pm

Update with 162 new papers to Deeplearning.University Bibliography by Amund Tveit.

From the post:

Added 162 new Deep Learning papers to the Deeplearning.University Bibliography, if you want to see them separate from the previous papers in the bibliography the new ones are listed below. There are many highly interesting papers, a few examples are:

  1. Deep neural network based load forecast – forecasts of electricity prediction
  2. The relation of eye gaze and face pose: Potential impact on speech recognition – combining speech recognition with facial expression
  3. Feature Learning from Incomplete EEG with Denoising Autoencoder – Deep Learning for Brain Computer Interfaces

Underneath are the 162 new papers, enjoy!

(Complete Bibliography – at Deeplearning.University Bibliography)

Disclaimer: we’re so far only covering (subset of) 2014 deep learning papers, so still far from a complete bibliography, but our goal is to come close eventuallly

Best regards,

Amund Tveit (Memkite Team)

You could find all these papers by search, if you knew what search terms to use.

This bibliography is a reminder of the power of curated data. The categories and grouping the papers into categories are definitely a value-add. Search doesn’t have those, in case you haven’t noticed. 😉

DevCenter 1.2 delivers support for Cassandra 2.1 and query tracing

Filed under: Cassandra,DataStax — Patrick Durusau @ 6:17 pm

DevCenter 1.2 delivers support for Cassandra 2.1 and query tracing by Alex Popescu.

From the post:

We’re very pleased to announce the availability of DataStax DevCenter 1.2, which you can download now. We’re excited to see how DevCenter has already become the defacto query and development tool for those of you working with Cassandra and DataStax Enterprise, and now with version 1.2, we’ve added additional support and options to make your development work even easier.

Version 1.2 of DevCenter delivers full support for the many new features in Apache Cassandra 2.1, including user defined types and tuples. DevCenter’s built-in validations, quick fix suggestions, the updated code assistance engine and the new snippets can greatly simplify your work with all the new features of Cassandra 2.1.

The download page offers the DataStax Sandbox if you are interested in a VM version.

Enjoy!

BBC Genome Project

Filed under: BBC,News — Patrick Durusau @ 4:50 pm

BBC Genome Project

From the post:

This site contains the BBC listings information which the BBC printed in Radio Times between 1923 and 2009. You can search the site for BBC programmes, people, dates and Radio Times editions.

We hope it helps you find that long forgotten BBC programme, research a particular person or browse your own involvement with the BBC.

This is a historical record of both the planned output and the BBC services of any given time. It should be viewed in this context and with the understanding that it reflects the attitudes and standards of its time – not those of today.

Join in

You can join in and become part of the community that is improving this resource. As a result of the scanning process there are lots of spelling mistakes and punctuation errors and you can edit the entries to accurately reflect the magazine entry. You can also tell us when the schedule changed and we will hold on to that information for the next stage of this project.

What a delightful resource to find on a Friday!

True, no links to the original programs but perhaps someday?

Enjoy!

I first saw this in a tweet by Tom Loosemore.


Update: Genome: behind the scenes by Andy Armstrong.

From the post:

In October 2011 Helen Papadopoulos wrote about the Genome project – a mammoth effort to digitise an issue of the Radio Times from every week between 1923 and 2009 and make searchable programme listings available online.

Helen expected there to be between 3 and 3.5 million programme entries. Since then the number has grown to 4,423,653 programmes from 4,469 issues. You can now browse and search all of them at http://genome.ch.bbc.co.uk/

Back in 2011 the process of digitising the scanned magazines was well advanced and our thoughts were turning to how to present the archive online. It’s taken three years and a few prototypes to get us to our first public release.

Andy gives you the backend view of the BBC Genome Project.

I first saw this in a tweet by Jem Stone.

Mobile encryption could lead to FREEDOM

Filed under: Cybersecurity,Security — Patrick Durusau @ 1:17 pm

FBI Director: Mobile encryption could lead us to ‘very dark place’ by Charlie Osborne.

Opps! Looks like I mis-quoted the headline!

Charlie got the FBI Director’s phrase right but I wanted to emphasize the cost of the FBI’s position.

The choices really are that stark: You can have encryption + freedom or back doors + government surveillance.

Director Comey argues that mechanisms are in place to make sure the government obeys the law. I concede there are mechanisms with that purpose, but the reason we are having this national debate is that the government chose to not use those mechanisms.

Having not followed its own rules for years, why should we accept the government’s word that it won’t do so again?

The time has come to “go dark,” not just on mobile devices but all digital communications. It won’t be easy at first but products will be created to satisfy the demand to “go dark.”

Any artists in the crowd? Will need buttons for “Going Dark,” “Go Dark,” and “Gone Dark.”

BTW, read Charlie’s post in full to get a sense of the arguments the FBI will be making against encryption.


PS: Charlie mentions that Google and Apple will be handing encryption keys over to customers. That means that the 5th Amendment protections about self-incrimination come into play. You can refuse to hand over the keys!

There is an essay on the 5th Amendment and encryption at: The Fifth Amendment, Encryption, and the Forgotten State Interest by Dan Terzian. 61 UCLA L. Rev. Disc. 298 (2014).

Abstract:

This Essay considers how the Fifth Amendment’s Self Incrimination Clause applies to encrypted data and computer passwords. In particular, it focuses on one aspect of the Fifth Amendment that has been largely ignored: its aim to achieve a fair balance between the state’s interest and the individual’s. This aim has often guided courts in defining the Self Incrimination Clause’s scope, and it should continue to do so here. With encryption, a fair balance requires permitting the compelled production of passwords or decrypted data in order to give state interests, like prosecution, an even chance. Courts should therefore interpret Fifth Amendment doctrine in a manner permitting this compulsion.

Hoping that Terzian’s position never prevails but you do need to know the arguments that will be made in support of his position.

October 16, 2014

COLD 2014 Consuming Linked Data

Filed under: Linked Data — Patrick Durusau @ 6:38 pm

COLD 2014 Consuming Linked Data

Table of Contents

You can get an early start on your weekend reading now! 😉

Free Public Access to Federal Materials on Guide to Law Online [Browsing, No Search]

Filed under: Government,Law,Law - Sources — Patrick Durusau @ 6:18 pm

Free Public Access to Federal Materials on Guide to Law Online by Donna Sokol.

From the post:

Through an agreement with the Library of Congress, the publisher William S. Hein & Co., Inc. has generously allowed the Law Library of Congress to offer free online access to historical U.S. legal materials from HeinOnline. These titles are available through the Library’s web portal, Guide to Law Online: U.S. Federal, and include:

I should be happy but then I read:

These collections are browseable. For example, to locate the 1982 version of the Bankruptcy code in Title 11 of the U.S. Code you could select the year (1982) and then Title number (11) to retrieve the material. (emphasis added)

Err, actually it should say: These collections are browseable only. No search within or across the collections.

Here is an example:

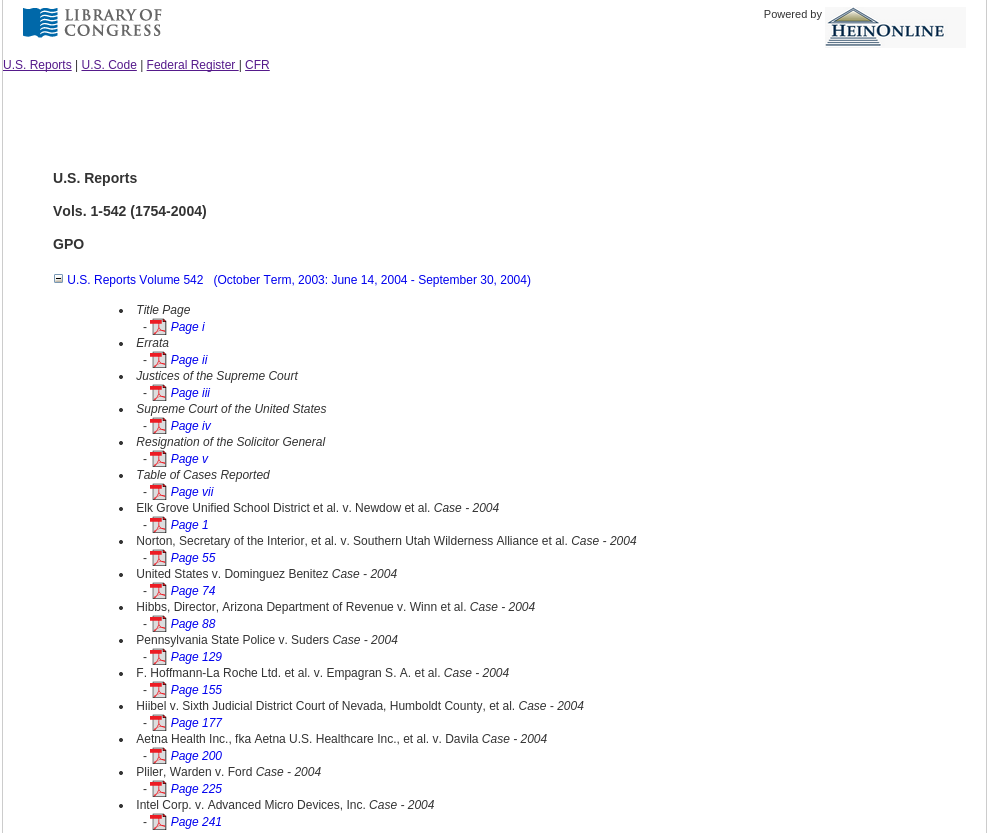
sumpreme court default listing

If you expand volume 542 you will see:

supreme court volume 542

Look! There is Intell vs. ADM, let’s look at that one!

Intel vs. ADM download page

Did I just overlook a search box?

I checked the others and you can to.

I did find one that was small enough (less than 20 pages I suppose) to have a search function:

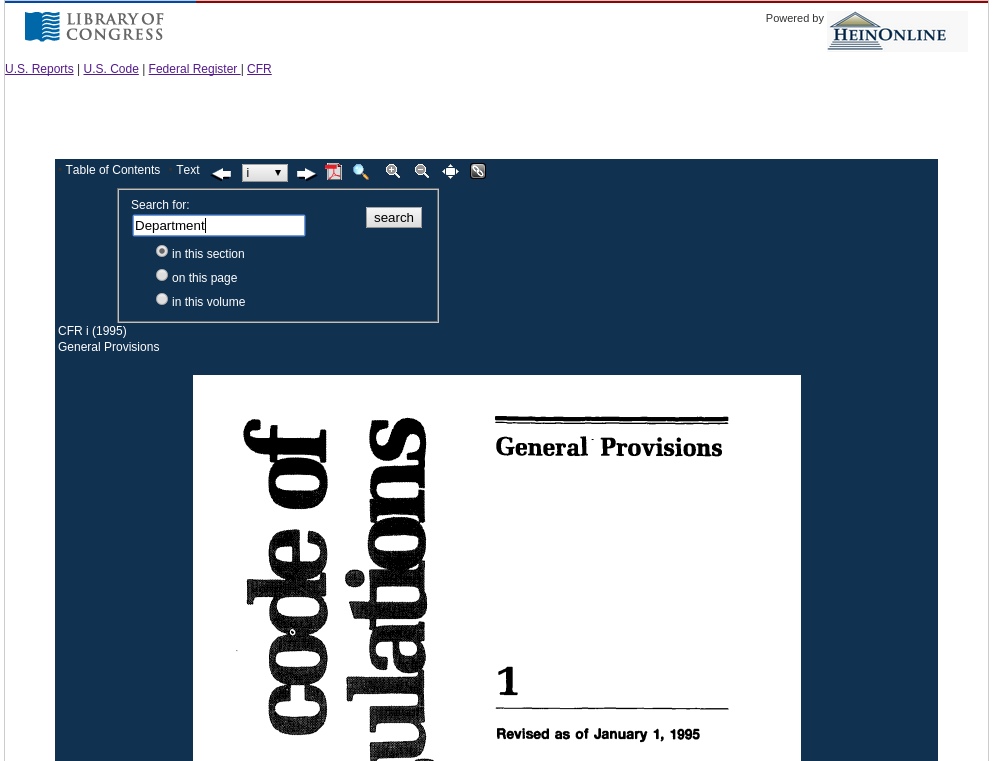
CFR General Provisions image

So, let’s search for something that ought to be in the CFR general provisions, like “department:”

Department in search box

The result?

search error

Actually that is an abbreviation of the error message. Waste of space to show more.

To summarize, the Library of Congress has arranged for all of us to have browseable access but no search to:

  • United States Code 1925-1988 (includes content up to 1993)
    • From Guide to Law Online: United States Law
  • United States Reports v. 1-542 (1754-2004)
    • From Guide to Law Online: United States Judiciary
  • Code of Federal Regulations (1938-1995)
    • From Guide to Law Online: Executive
  • Federal Register v. 1-58 (1936-1993)
    • From Guide to Law Online: Executive

Hundreds of thousands of pages of some of the most complex documents in history and no searching.

If that’s helping us, I don’t think we can afford much more help from the Library of Congress. That’s a hard thing for me to say because in the vast number of cases I really like and support the Library of Congress (aside from the robber baron refugees holed up on the Copyright Office).

Just so I don’t end on a negative note, I have a suggestion to correct this situation:

Give Thompson-Reuters (I knew them as West Publishing Company) or LexisNexis a call. Either one is capable of a better solution than you have with William S. Hein & Co., Inc. Either one has “related” products it could tastefully suggest along with search results.

Storyline Ontology

Filed under: News,Ontology,Reporting — Patrick Durusau @ 4:18 pm

Storyline Ontology

From the post:

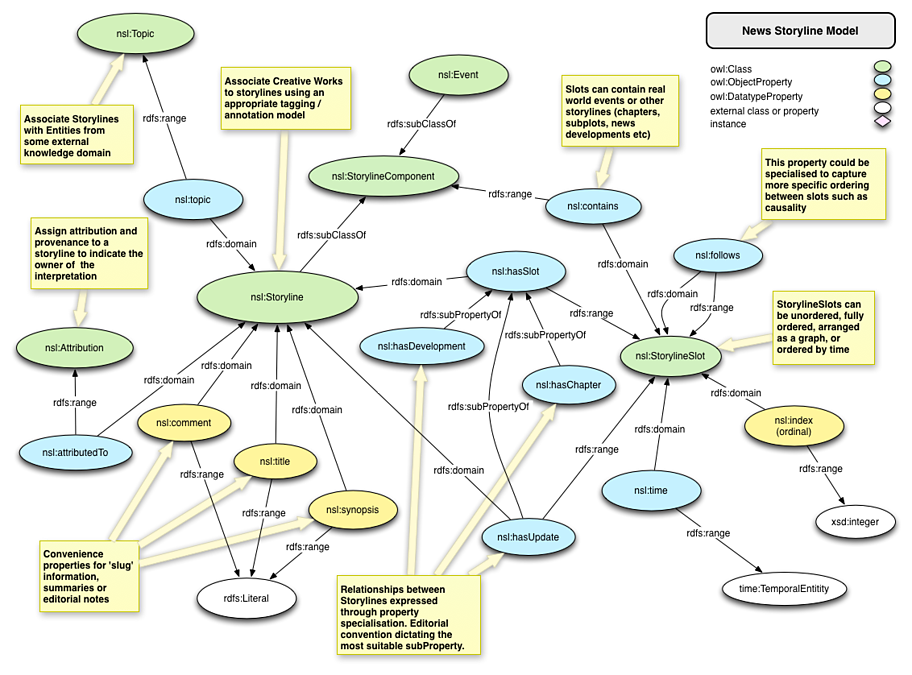
The News Storyline Ontology is a generic model for describing and organising the stories news organisations tell. The ontology is intended to be flexible to support any given news or media publisher’s approach to handling news stories. At the heart of the ontology, is the concept of Storyline. As a nuance of the English language the word ‘story’ has multiple meanings. In news organisations, a story can be an individual piece of content, such as an article or news report. It can also be the editorial view on events occurring in the world.

The journalist pulls together information, facts, opinion, quotes, and data to explain the significance of world events and their context to create a narrative. The event is an award being received; the story is the triumph over adversity and personal tragedy of the victor leading up to receiving the reward (and the inevitable fall from grace due to drugs and sexual peccadillos). Or, the event is a bombing outside a building; the story is an escalating civil war or a gas mains fault due to cost cutting. To avoid this confusion, the term Storyline has been used to remove the ambiguity between the piece of creative work (the written article) and the editorial perspective on events.

Storyline ontology

I know, it’s RDF. Well, but the ontology itself, aside from the RDF cruft, represents a thought out and shared view of story development by major news producers. It is important for that reason if no other.

And you can use it as the basis for developing or integrating other story development ontologies.

Just as the post acknowledges:

As news stories are typically of a subjective nature (one news publisher’s interpretation of any given news story may be different from another’s), Storylines can be attributed to some agent to provide this provenance.

the same is true for ontologies. Ready to claim credit/blame for yours?

IBM Watson: How it Works [This is a real hoot!]

Filed under: Artificial Intelligence — Patrick Durusau @ 4:03 pm

Dibs on why “artificial intelligence” has, is and will fail! (At least if you think “artificial intelligence” means reason like a human being.)

IBM describes the decision making process in humans as four steps:

  1. Observe
  2. Interpret and draw hypotheses
  3. Evaluate which hypotheses is right or wrong
  4. Decide based on the evaluation

Most of us learned those four steps or variations on them as part of research paper writing or introductions to science. And we have heard them repeated in a variety of contexts.

However, we also know that model of human “reasoning” is a fantasy. Most if not all of us claim to follow it but the truth about the vast majority of decision making has little to do with those four steps.

That’s not just a “blog opinion” but one that has been substantiated by years of research. Look at any chapter in Thinking, Fast and Slow by Daniel Kahneman and tell me how Watson’s four step process is a better explanation than the one you will find there.

One of my favorite examples was the impact of meal times on parole decisions in Israel. Shai Danzinger, Jonathan Levav, and Liora Avnaim-Pesso, “Extraneous Factors in Judicial Decisions,” PNAS 108 (2011): 6889-92.

Abstract from Danzinger:

Are judicial rulings based solely on laws and facts? Legal formalism holds that judges apply legal reasons to the facts of a case in a rational, mechanical, and deliberative manner. In contrast, legal realists argue that the rational application of legal reasons does not sufficiently explain the decisions of judges and that psychological, political, and social factors influence judicial rulings. We test the common caricature of realism that justice is “what the judge ate for breakfast” in sequential parole decisions made by experienced judges. We record the judges’ two daily food breaks, which result in segmenting the deliberations of the day into three distinct “decision sessions.” We find that the percentage of favorable rulings drops gradually from ≈65% to nearly zero within each decision session and returns abruptly to ≈65% after a break. Our findings suggest that judicial rulings can be swayed by extraneous variables that should have no bearing on legal decisions.

If yes on parole applications starts at 65% right after breakfast or lunch and dwindles to zero, I know when I want my case heard.

That is just one example from hundreds in Kahneman.

Watson lacks the irrationality necessary to “reason like a human being.”

(Note that Watson is only given simple questions. No questions about policy choices in long simmering conflicts. We save those for human beings.)

GraphLab Create™ v1.0 Now Generally Available

Filed under: GraphLab,Graphs — Patrick Durusau @ 3:04 pm

GraphLab Create™ v1.0 Now Generally Available by Johnnie Konstantas.

From the post:

It is with tremendous pride in this amazing team that I am posting on the general availability of version 1.0, our flagship product. This work represents a bar being set on usability, breadth of features and productivity possible with a machine learning platform.

What’s next you ask? It’s easy to talk about all of our great plans for scale and administration but I want to give this watershed moment it’s due. Have a look at what’s new.

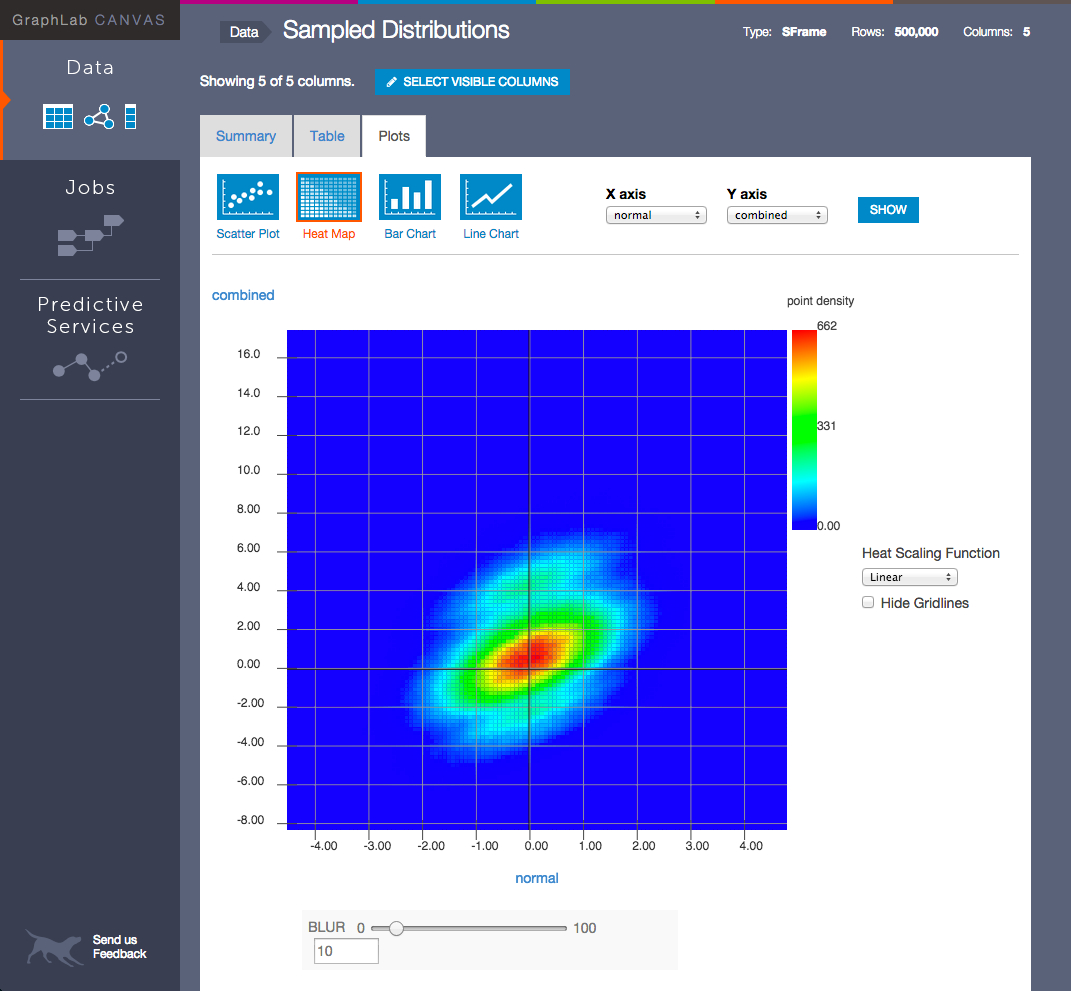
graphlab demo

New features available in the GraphLab Create platform include:

  • Predictive Services – Companies can build predictive applications quickly, easily, and at scale.  Predictive service deployments are scalable, fault-tolerant, and high performing, enabling easy integration with front-end applications. Trained models can be deployed on Amazon Elastic Compute Cloud (EC2) and monitored through Amazon CloudWatch. They can be queried in real-time via a RESTful API and the entire deployment pipeline is seen through a visual dashboard. The time from prototyping to production is dramatically reduced for GraphLab Create users.
  • Deep Learning – These models are ideal for automatic learning of salient features, without human supervision, from data such as images. Combined with GraphLab Create image analysis tools, the Deep Learning package enables accurate and in-depth understanding of images and videos. The GraphLab Create image analysis package makes quick work of importing and preprocessing millions of images as well as numeric data. It is built on the latest architectures including Convolution Layer, Max, Sum, Average Pooling and Dropout. The available API allows for extensibility in building user custom neural networks. Applications include image classification, object detection and image similarity.
  • Boosted Trees – With this feature, GraphLab adds support for this popular class of algorithms for robust and accurate regression and classification tasks.  With an out-of-core implementation, Boosted Trees in GraphLab Create can easily scale up to large datasets that do not fit into memory.

  • Visualization – New dashboards allow users to visualize the status and health of offline jobs deployed in various environments including local, Hadoop Clusters and EC2.  Also part of GraphLab Canvas is the visualization of GraphLab SFrames and SGraphs, enabling users to explore tables, graphs, text and images, in a single interactive environment making feature engineering more efficient.

…(and more)

Rather than downloading the software, go to GraphLab Create™ Quick Start to generate a product key. After you generate a product key (displayed on webpage), GraphLab offers command line code to set you up for installing GraphLab via pip. Quick and easy on Ubuntu 12.04.

Next stop: The Five-Line Recommender, Explained by Alice Zheng. 😉

Enjoy!

October 15, 2014

Bloom Filters

Filed under: Bloom Filters,Filters — Patrick Durusau @ 7:34 pm

Bloom Filters by Jason Davies.

From the post:

Everyone is always raving about bloom filters. But what exactly are they, and what are they useful for?

Very straightforward explanation along with interactive demo. The applications section will immediately suggest how Bloom filters could be used when querying.

There are other complexities, see the Bloom Filter entry at Wikipedia. But as a first blush explanation, you will be hard pressed to find one as good as Jason’s.

I first saw this in a tweet by Allen Day.

How To Build Linked Data APIs…

Filed under: Linked Data,RDF,Schema.org,Semantic Web,Uncategorized — Patrick Durusau @ 7:23 pm

This is the second high signal-to-noise presentation I have seen this week! I am sure that streak won’t last but I will enjoy it as long as it does.

Resources for after you see the presentation: Hydra: Hypermedia-Driven Web APIs, JSON for Linking Data, and, JSON-LD 1.0.

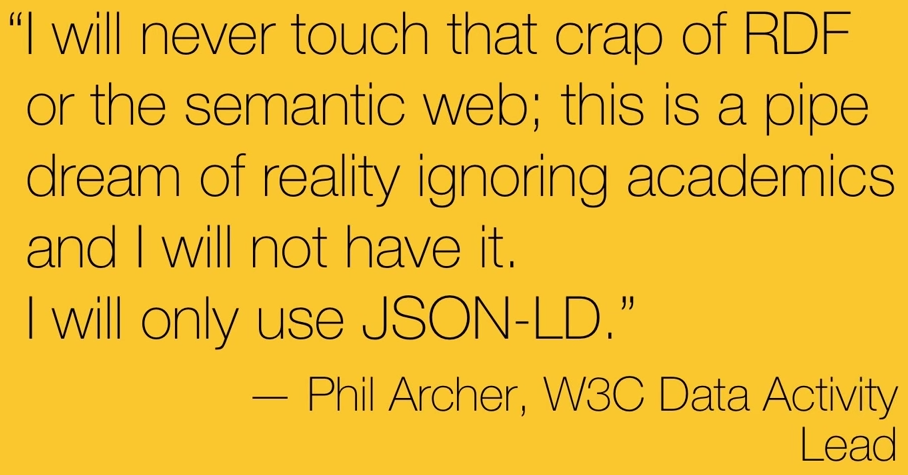
Near the end of the presentation, Marcus quotes Phil Archer, W3C Data Activity Lead:

Archer on Semantic Web

Which is an odd statement considering that JSON-LD 1.0 Section 7 Data Model, reads in part:

JSON-LD is a serialization format for Linked Data based on JSON. It is therefore important to distinguish between the syntax, which is defined by JSON in [RFC4627], and the data model which is an extension of the RDF data model [RDF11-CONCEPTS]. The precise details of how JSON-LD relates to the RDF data model are given in section 9. Relationship to RDF.

And section 9. Relationship to RDF reads in part:

JSON-LD is a concrete RDF syntax as described in [RDF11-CONCEPTS]. Hence, a JSON-LD document is both an RDF document and a JSON document and correspondingly represents an instance of an RDF data model. However, JSON-LD also extends the RDF data model to optionally allow JSON-LD to serialize Generalized RDF Datasets. The JSON-LD extensions to the RDF data model are:…

Is JSON-LD “…a concrete RDF syntax…” where you can ignore RDF?

Not that I was ever a fan of RDF but standards should be fish or fowl and not attempt to be something in between.

5 Machine Learning Areas You Should Be Cultivating

Filed under: Machine Learning — Patrick Durusau @ 11:01 am

5 Machine Learning Areas You Should Be Cultivating by Jason Brownlee.

From the post:

You want to learn machine learning to have more opportunities at work or to get a job. You may already be working as a data scientist or machine learning engineer and looking to improve your skills.

It is about as easy to pigeonhole machine learning skills as it is programming skills (you can’t).

There is a wide array of tasks that require some skill in data mining and machine learning in business from data analysis type work to full systems architecture and integration.

Nevertheless there are common tasks and common skills that you will want to develop, just like you could suggest for an aspiring software developer.

In this post we will look at 5 key areas were you might want to develop skills and the types of activities that you could take on to practice in those areas.

Jason has a number of useful suggestions for the five areas and you will profit from taking his advice.

At the same time, I would be keeping a notebooks of assumptions or exploits that are possible with every technique or process that you learn. Results and data will be presented to you as though the results and data are both clean. It is your responsibility to test that presentation.

Concatenative Clojure

Filed under: Clojure,DSL,Programming — Patrick Durusau @ 10:49 am

Concatenative Clojure by Brandon Bloom.

Summary:

Brandon Bloom introduces Factor and demonstrates Factjor –concatenative DSL – and DomScript –DOM library written in ClojureScript – in the context of concatenative programming.

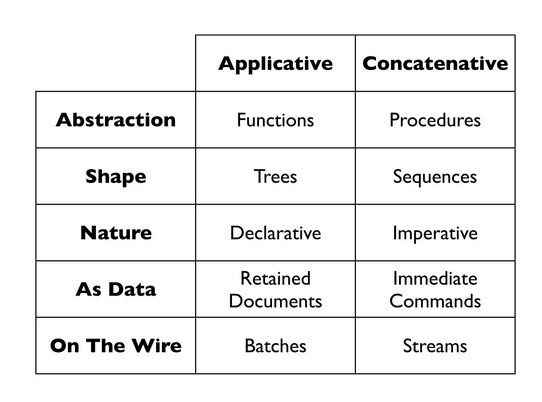
Brandon compares and contrasts applicative and concatenative programming languages, concluding with this table:

presentation slide

Urges viewers to explore Factjor and to understand the differences between between applicative and contatenative programming languages. It is a fast moving presentation that will require viewing more than once!

Watch for new developments at: https://github.com/brandonbloom

I first saw this in a tweet by Wiliam Byrd.

« Newer PostsOlder Posts »

Powered by WordPress