Another Word For It Patrick Durusau on Topic Maps and Semantic Diversity

August 14, 2014

Are You A Kardashian?

Filed under: Genome,Humor,Science — Patrick Durusau @ 1:42 pm

The Kardashian index: a measure of discrepant social media profile for scientists by Neil Hall.

Abstract:

In the era of social media there are now many different ways that a scientist can build their public profile; the publication of high-quality scientific papers being just one. While social media is a valuable tool for outreach and the sharing of ideas, there is a danger that this form of communication is gaining too high a value and that we are losing sight of key metrics of scientific value, such as citation indices. To help quantify this, I propose the ‘Kardashian Index’, a measure of discrepancy between a scientist’s social media profile and publication record based on the direct comparison of numbers of citations and Twitter followers.

A playful note on a new index based on a person’s popularity on twitter and their citation record. Not to be taken too seriously but not to be ignored altogether. The influence of popularity, the media asking Neil deGrasse Tyson, an astrophysicist and TV scientist, his opinion about GMOs, is a good example.

Tyson sees no difference between modern GMOs and selective breeding, which has been practiced for thousands of years. Tyson overlooks selective breeding’s requirement of an existing trait to bred towards. In other words, selective breeding has a natural limit built into the process.

For example, there are no naturally fluorescent Zebrafish:

Zebrafish

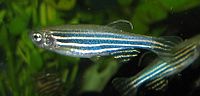
so you can’t selectively breed fluorescent ones.

On the other hand, with genetic modification, you can produce a variety of fluorescent Zebrafish know as GloFish:

Glofish

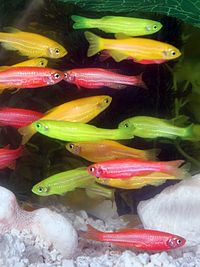
Genetic modification has no natural boundary as is present in selective breeding.

With that fact in mind, I think everyone would agree that selective breeding and genetic modification aren’t the same thing. Similar but different.

A subtle distinction that eludes Kardashian TV scientist Neil deGrasse Tyson (Twitter, 2.26M followers).

I first saw this in a tweet by Steven Strogatz.

August 13, 2014

TF-IDF using flambo

Filed under: Clojure,DSL,Spark,TF-IDF — Patrick Durusau @ 6:48 pm

TF-IDF using flambo by Muslim Baig.

From the post:

flambo is a Clojure DSL for Spark created by the data team at Yieldbot. It allows you to create and manipulate Spark data structures using idiomatic Clojure. The following tutorial demonstrates typical flambo API usage and facilities by implementing the classic tf-idf algorithm.

The complete runnable file of the code presented in this tutorial is located under the flambo.example.tfidf namespace, under the flambo /test/flambo/example directory. We recommend you download flambo and follow along in your REPL.

Working through the Clojure code you will get a better understanding of the TF-IDF algorithm.

I don’t know if it was intentional, but the division of the data into “documents” illustrates one of the fundamental questions for most indexing techniques:

What do you mean by document?

It is a non-trivial question and one that has a major impact on the results of the algorithm.

If I get to choose what is considered a “document,” then I can weight the results while using the same algorithm as everyone else.

Think about it. My “documents” may have the term “example” in each one, as opposed to “example” appearing three times in a single document. See the last section in the Wikipedia article tf-idf for the impact of such splitting.

Other algorithms are subject to similar manipulation. It isn’t ever enough to know the algorithms applied to data, you need to see the data itself.

Creating Custom D3 Directives in AngularJS

Filed under: D3,Graphics,Visualization — Patrick Durusau @ 4:47 pm

Creating Custom D3 Directives in AngularJS by Steven Hall.

From the post:

Among the most popular frameworks for making interactive data visualizations with D3 is AngularJS. Along with some great tools for code organization, Angular’s use of directives can be a powerful way to implement interactive charts and keep your code clean and organized. Here we are going to look at a simple example that creates a service that pulls data from last.fm using their public API. The returned data will be used to update two interactive charts created using Angular directives.

As usual in these tutorials the code is kept to a minimum to keep things clear and to the point. The code written for this example weighs in at about 250 lines of JavaScript and the results are pretty cool. The example uses D3’s enter, update, and exit selections to illustrate how thinking about object constancy when transitioning from one state to another can be really powerful for communicating relationships in the data that may be hard to spot otherwise.

I think the example presented here is a good one because it brings up a lot of the common concerns when developing using AngularJS (and in JavaScript in general really) with just a short amount of code.    

We’ll touch on all the following concerns:

  • Avoiding global variables
  • Creating data services
  • Dependency injection
  • Broadcasting events
  • Scoping directives
  • Making responsive charts

In addition to making a basic service to retrieve data from an API that can be injected into your controllers and directives, this article will cover different ways to scope your directives and using the AngularJS eventing tools.  As we’ll see, one chart in the example shares the entire root scope while the other creates an isolated scope that only has access to certain properties.  Your ability to manage scopes for directives is one of the most powerful concepts to understand in working with Angular.  Finally, we’ll look at broadcasting and listening for events in making the charts responsive.

Data delivery. Despite the complexity of data structures, formalisms used to develop algorithms for data analysis, network architectures, and the other topics that fill technical discussions, data delivery drives user judgments about your application/service.

This tutorial, along with others you will find here, will move you towards effective data delivery.

TSA Checkpoint Systems Found Exposed On The Net

Filed under: Cybersecurity,Security — Patrick Durusau @ 3:51 pm

TSA Checkpoint Systems Found Exposed On The Net by Kelly Jackson Higgins.

From the post:

A Transportation Safety Administration (TSA) system at airport security checkpoints contains default backdoor passwords, and one of the devices running at the San Francisco Airport was sitting on the public Internet.

Renowned security researcher Billy Rios, who is director of threat intelligence at Qualys, Wednesday here at Black Hat USA gave details on security weaknesses he discovered in both the Morpho Detection Itemiser 3 trace-explosives and residue detection system, and the Kronos 4500 time clock system used by TSA agents to clock in and out with their fingerprints, which could allow an attacker to easily gain user access to the devices.

Device vendors embed hardcoded passwords for their own maintenance or other technical support.

Kelly has a great write-up of the research by Rios which covers enough details to make you curious, if not actively interested in the reported flaws. 😉

I don’t travel any more but I would not be overly worried about complex security hacks as threats to airport security. Airline personnel get busted on a regular basis for smuggling drugs. Social engineering is far easier, cheaper and more reliable than digital system hacks for mischief.

The hardcoded passwords makes me think that a monthly bulletin of default/hardcoded passwords would be another commercially viable publication.

July 2014 Crawl Data Available [Honeypot Detection]

Filed under: Common Crawl,Cybersecurity,Security — Patrick Durusau @ 3:26 pm

July 2014 Crawl Data Available by Stephen Merity.

From the post:

The July crawl of 2014 is now available! The new dataset is over 266TB in size containing approximately 4.05 billion webpages. The new data is located in the aws-publicdatasets bucket at /common-crawl/crawl-data/CC-MAIN-2014-23/.

To assist with exploring and using the dataset, we’ve provided gzipped files that list:

By simply adding either s3://aws-publicdatasets/ or https://aws-publicdatasets.s3.amazonaws.com/ to each line, you end up with the S3 and HTTP paths respectively.

We’ve also released a Python library, gzipstream, that should enable easier access and processing of the Common Crawl dataset. We’d love for you to try it out!

Thanks again to blekko for their ongoing donation of URLs for our crawl!

Just in case you have exhausted all the possibilities with the April Crawl Data. 😉

Comparing the two crawls:

April – 183TB in size containing approximately 2.6 billion webpages

July – 266TB in size containing approximately 4.05 billion webpages

Just me but I would say there is new material in the July crawl.

The additional content could be CIA, FBI, NSA honeypots or broken firewalls but I rather doubt it.

Curious, how would you detect a honeypot from a crawl data? Thinking a daily honeypot report could be a viable product for some market segment.

Statistical Software

Filed under: Statistics — Patrick Durusau @ 2:00 pm

Statistical Software

A comparison of R, Matlab, SAS, Stata, and SPSS for their support of fifty-seven (57) statistical functions.

I have not verified the analysis but it is reported that R and Matlab support all fifty-seven (57), SAS supports forty-two (42), Stata supports twenty-nine (29) and SPSS supports a mere twenty (20).

Since R is open-source software, you can verify support of the statistical functions you need before looking at other software.

I first saw this at Table comparing the statistical capabilities of software packages by David Smith.

David mentions the table does not include Julia or Python. It also doesn’t include Mathematica. Having all of these compared in one table could be very useful. Sing out if you see such a table. Thanks!

Hadoop Ecosystem Guide Chart

Filed under: Hadoop,Hadoop YARN — Patrick Durusau @ 1:45 pm

As they say, you can’t tell the players without a program!

hadoop chart

From Greg Hill’s New To Hadoop? Here’s A Handy Guide To Get You Started (Part 1)

Greg’s post has a brief summary of each category.

Additional pieces that you will find handy are promised in a future post.

The Hadoop ecosystem is evolving rapidly so take this chart as a rough guide. More players are likely to appear in a matter of months if not weeks.

I first saw this in Joe Crobak’s Hadoop Weekly – July 28, 2014.

HDP 2.1 Tutorials

Filed under: Falcon,Hadoop,Hive,Hortonworks,Knox Gateway,Storm,Tez — Patrick Durusau @ 11:17 am

HDP 2.1 tutorials from Hortonworks:

  1. Securing your Data Lake Resource & Auditing User Access with HDP Security
  2. Searching Data with Apache Solr
  3. Define and Process Data Pipelines in Hadoop with Apache Falcon
  4. Interactive Query for Hadoop with Apache Hive on Apache Tez
  5. Processing streaming data in Hadoop with Apache Storm
  6. Securing your Hadoop Infrastructure with Apache Knox

The quality you have come to expect from Hortonwork tutorials but the data sets are a bit dull.

What data sets would you suggest to spice up this tutorials?

Cool Unix Tools (Is There Another Kind?)

Filed under: Linux OS — Patrick Durusau @ 11:00 am

A little collection of cool unix terminal/console/curses tools by Kristof Kovacs.

From the webpage:

Just a list of 20 (now 28) tools for the command line. Some are little-known, some are just too useful to miss, some are pure obscure — I hope you find something useful that you weren’t aware of yet! Use your operating system’s package manager to install most of them. (Thanks for the tips, everybody!)

Great list, some familiar, some not.

I first saw the path to this in a tweet by Christophe Lalanne.

August 12, 2014

Visualizing Open-Internet Comments

Filed under: Clustering,Politics — Patrick Durusau @ 6:54 pm

A Fascinating Look Inside Those 1.1 Million Open-Internet Comments by Elise Hu.

From the post:

When the Federal Communications Commission asked for public comments about the issue of keeping the Internet free and open, the response was huge. So huge, in fact, that the FCC’s platform for receiving comments twice got knocked offline because of high traffic, and the deadline was extended because of technical problems.

So what’s in those nearly 1.1 million public comments? A lot of mentions of the F word, according to a TechCrunch analysis. But now, we have a fuller picture. The San Francisco data analysis firm Quid looked beyond keywords to find the sentiment and arguments in those public comments.

Quid, as commissioned by the media and innovation funder Knight Foundation, parsed hundreds of thousands of comments, tweets and news coverage on the issue since January. The firm looked at where the comments came from and what common arguments emerged from them.

Yes, NPR twice in the same day. 😉

When NPR has or hires talent to understand the issues, it is capable of high quality reporting.

In this particular case, clustering enables the discovery of two themes that were not part of any public PR campaign, which I would take to be genuine consumer responses.

While “lite” from a technical standpoint, the post does a good job of illustrating the value of this type of analysis.

PS: While omitted from the NPR story, Quid.

TinkerPop3 3.0.0.M1

Filed under: Gremlin,TinkerPop — Patrick Durusau @ 6:39 pm

TinkerPop3 3.0.0.M1 Released — A Gremlin Raga in 7/16 Time by Marko A. Rodriguez.

From the post:

TinkerPop3 3.0.0.M1 “A Gremlin Rāga in 7/16 Time” is now released and ready for use.

http://tinkerpop.com (downloads and docs)
https://github.com/tinkerpop/tinkerpop3/blob/master/CHANGELOG.asciidoc (changelog)

IMPORTANT: TinkerPop3 requires Java8.
http://www.oracle.com/technetwork/java/javase/overview/java8-2100321.html

We would like both developers and vendors to play with this release and provide feedback as we move forward towards M2, …, then GA.

  1. Is the API how you like it?
  2. Is it easy to implement the interfaces for your graph engine?
  3. Is the documentation clear?
  4. Are there VertexProgram algorithms that you would like to have?
  5. Are there Gremlin steps that you would like to have?
  6. etc…

For the above, as well as for bugs, the issue tracker is open and ready for submissions:
https://github.com/tinkerpop/tinkerpop3/issues

TinkerPop3 is the culmination of a huge effort from numerous individuals. You can see the developers and vendors that have provided their support through the years.
http://www.tinkerpop.com/docs/current/#tinkerpop-contributors
(the documentation may take time to load due to all the graphics in the single HTML)

If you haven’t looked at the TinkerPop3 docs in a while, take a quick look. Tweets on several sections have recently pointed out very nice documentation.

Functional Examples from Category Theory

Filed under: Category Theory,Functional Programming — Patrick Durusau @ 6:24 pm

Functional Examples from Category Theory by Alissa Pajer.

Summary:

Alissa Pajer discusses through examples how to understand and write cleaner and more maintainable functional code using the Category Theory.

You will need to either view at full screen or download the slides to see the code.

Long on category theory but short on Scala. Still, a useful video that will be worth re-watching.

The dynamics of correlated novelties

Filed under: Navigation,Novelty — Patrick Durusau @ 4:04 pm

The dynamics of correlated novelties by F. Tria, V. Loreto, V. D. P. Servedio, and S. H. Strogatz.

Abstract:

Novelties are a familiar part of daily life. They are also fundamental to the evolution of biological systems, human society, and technology. By opening new possibilities, one novelty can pave the way for others in a process that Kauffman has called “expanding the adjacent possible”. The dynamics of correlated novelties, however, have yet to be quantified empirically or modeled mathematically. Here we propose a simple mathematical model that mimics the process of exploring a physical, biological, or conceptual space that enlarges whenever a novelty occurs. The model, a generalization of Polya’s urn, predicts statistical laws for the rate at which novelties happen (Heaps’ law) and for the probability distribution on the space explored (Zipf’s law), as well as signatures of the process by which one novelty sets the stage for another. We test these predictions on four data sets of human activity: the edit events of Wikipedia pages, the emergence of tags in annotation systems, the sequence of words in texts, and listening to new songs in online music catalogues. By quantifying the dynamics of correlated novelties, our results provide a starting point for a deeper understanding of the adjacent possible and its role in biological, cultural, and technological evolution.

From the introduction:

The notion that one new thing sometimes triggers another is, of course, commonsensical. But it has never been documented quantitatively, to the best of our knowledge. In the world before the Internet, our encounters with mundane novelties, and the possible correlations between them, rarely left a trace. Now, however, with the availability of extensive longitudinal records of human activity online1, it has become possible to test whether everyday novelties crop up by chance alone, or whether one truly does pave the way for another.

Steve Newcomb often talks about serendipity and topic maps. What if it is possible to engineer serendipity? That is over a large enough population, discover the subjects that are going to trigger the transition where “formerly adjacent possible becomes actualized[?].

This work is in its very early stages but its impact on information delivery/discovery may be substantial.

NPR + CIA = Credible Disinformation

Filed under: Cybersecurity,News,NSA,Security — Patrick Durusau @ 3:46 pm

NPR Is Laundering CIA Talking Points to Make You Scared of NSA Reporting by By Glenn Greenwald and Andrew Fishman.

From the post:

On August 1, NPR’s Morning Edition broadcast a story by NPR national security reporter Dina Temple-Raston touting explosive claims from what she called “a tech firm based in Cambridge, Massachusetts.” That firm, Recorded Future, worked together with “a cyber expert, Mario Vuksan, the CEO of ReversingLabs,” to produce a new report that purported to vindicate the repeated accusation from U.S. officials that “revelations from former NSA contract worker Edward Snowden harmed national security and allowed terrorists to develop their own countermeasures.”

The “big data firm,” reported NPR, says that it now “has tangible evidence” proving the government’s accusations. Temple-Raston’s four-minute, 12-second story devoted the first 3 minutes and 20 seconds to uncritically repeating the report’s key conclusion that ”just months after the Snowden documents were released, al-Qaeda dramatically changed the way its operatives interacted online” and, post-Snowden, “al-Qaeda didn’t just tinker at the edges of its seven-year-old encryption software; it overhauled it.” The only skepticism in the NPR report was relegated to 44 seconds at the end when she quoted security expert Bruce Schneier, who questioned the causal relationship between the Snowden disclosures and the new terrorist encryption programs, as well as the efficacy of the new encryption.

The day after that NPR report, I posted Hire Al-Qaeda Programmers, which pointed out the technical absurdity of the claims made in the NPR story. That three different organizations re-wrote security software within three to five months following the Snowden leaks. Contrary to all experience with software projects.

Greenwald follows the money to reveal that both Recorded Future and ReversingLabs are both deeply in the pockets of the CIA and exposes other issues and problems with both the Recorded Future “report” and the NPR story on the same.

We can debate why Dina Temple-Raston didn’t do a fuller investigation, express more skepticism, or ask sharper questions.

But the question that interests me is this one: Why report the story at all?

Just because Recorded Future, the CIA, or even the White House releases claims about Edward Snowden and national security isn’t a reason to repeat them. Even if they are repeated with critical analysis or following the money trail as did Greenwald.

Even superficial investigation would have revealed the only “tangible evidence” in the possession of Recorded Future is the paper on which it printed its own speculations. That should have been the end of the story.

If the story was broken by other outlets, then the NPR story is “XYZ taken in by a false story….”

Instead, we have NPR lending its credibility to a government and agencies who have virtually none at all. We are served “credible” disinformation because of its source, NPR.

The average listener isn’t going to remember the companies involved or most of the substance of the story. What they are going to remember is that they heard NPR report that Snowden’s leaks harmed national security.

Makes me wonder what other inadequately investigated stories NPR is broadcasting.

You?

PS: You could say that Temple-Raston just “forgot” or overlooked the connections Greenwald reports. Or another reporter, confronted with a similar lie, may not know of the connections. How would you avoid a similar outcome in the future?

August 11, 2014

InChI identifier

Filed under: Cheminformatics — Patrick Durusau @ 4:17 pm

How the InChI identifier is used to underpin our online chemistry databases at Royal Society of Chemistry by Antony Williams.

Description:

The Royal Society of Chemistry hosts a growing collection of online chemistry content. For much of our work the InChI identifier is an important component underpinning our projects. This enables the integration of chemical compounds with our archive of scientific publications, the delivery of a reaction database containing millions of reactions as well as a chemical validation and standardization platform developed to help improve the quality of structural representations on the internet. The InChI has been a fundamental part of each of our projects and has been pivotal in our support of international projects such as the Open PHACTS semantic web project integrating chemistry and biology data and the PharmaSea project focused on identifying novel chemical components from the ocean with the intention of identifying new antibiotics. This presentation will provide an overview of the importance of InChI in the development of many of our eScience platforms and how we have used it to provide integration across hundreds of websites and chemistry databases across the web. We will discuss how we are now expanding our efforts to develop a platform encompassing efforts in Open Source Drug Discovery and the support of data management for neglected diseases.

Although I have seen more than one of Antony’s slide decks, there is information herein that bears repeating and new news as well.

InChI identifiers are chemical identifiers based on the chemical structure of a substance. They are not designed to replace current identifiers but rather to act as lynchpins that enable the mapping of other names together against a known chemical structure. (The IUPAC International Chemical Identifier (InChI))

Anthony says at slide #31 that all 21st century articles (100K) have been processed. And is not shy about pointing out known problems in existing data.

I regret not seeing the presentation but the slides left me with a distinctly positive feeling about progress in this area.

Getting Good Tip

Filed under: Education,Learning — Patrick Durusau @ 3:49 pm

I first saw:

“if you want to get good at R (or anything really) the trick is to find a reason to use it every day”

in a tweet by Neil Saunders, quoting Tony Ojeda in How to Transition from Excel to R.

That sounds more doable than saying: “I will practice R for an hour every day this week.” Some days you will and some days you won’t. But finding a reason to use R (or anything else) once a day, I suspect it will creep into your regular routine.

Enjoy!

Multiobjective Search

Filed under: Blueprints,Graphs,TinkerPop — Patrick Durusau @ 3:29 pm

Multiobjective Search with Hipster and TinkerPop Blueprints

From the webpage:

This advanced example explains how to perform a general multiobjective search with Hipster over a property graph using the TinkerPop Blueprints API. In a multiobjective problem, instead of optimizing just a single objective function, there are many objective functions that can conflict each other. The goal then is to find all possible solutions that are nondominated, i.e., there is no other feasible solution better than the current one in some objective function without worsening some of the other objective functions.

If you don’t know Hipster:

The aim of Hipster is to provide an easy to use yet powerful and flexible type-safe Java library for heuristic search. Hipster relies on a flexible model with generic operators that allow you to reuse and change the behavior of the algorithms very easily. Algorithms are also implemented in an iterative way, avoiding recursion. This has many benefits: full control over the search, access to the internals at runtime or a better and clear scale-out for large search spaces using the heap memory.

You can use Hipster to solve from simple graph search problems to more advanced state-space search problems where the state space is complex and weights are not just double values but custom defined costs.

I can’t help but hear “multiobjective search” in the the context of a document search where documents may or may not match multiple terms in a search request.

But that hearing is wrong because a graph can be more granular than a document and possess multiple ways to satisfy a particular objective. My intuition is that documents satisfy search requests only in a binary sense, yes or not. Yes?

Good way to get involved with Tinkerpop Blueprints.

How to Transition from Excel to R

Filed under: Excel,R — Patrick Durusau @ 2:30 pm

How to Transition from Excel to R: An Intro to R for Microsoft Excel Users by Tony Ojeda.

From the post:

In today’s increasingly data-driven world, business people are constantly talking about how they want more powerful and flexible analytical tools, but are usually intimidated by the programming knowledge these tools require and the learning curve they must overcome just to be able to reproduce what they already know how to do in the programs they’ve become accustomed to using. For most business people, the go-to tool for doing anything analytical is Microsoft Excel.

If you’re an Excel user and you’re scared of diving into R, you’re in luck. I’m here to slay those fears! With this post, I’ll provide you with the resources and examples you need to get up to speed doing some of the basic things you’re used to doing in Excel in R. I’m going to spare you the countless hours I spent researching how to do this stuff when I first started so that you feel comfortable enough to continue using R and learning about its more sophisticated capabilities.

Excited? Let’s jump in!

Not a complete transition but enough to give you a taste of R that will leave you wanting more.

You will likely find R is better for some tasks and that you prefer Excel for others. Why not have both in your toolkit?

Patent Fraud, As In Patent Office Fraud

Filed under: Intellectual Property (IP),Topic Maps — Patrick Durusau @ 2:09 pm

Patent Office staff engaged in fraud and rushed exams, report says by Jeff John Roberts.

From the post:

…One version of the report also flags a culture of “end-loading” in which examiners “can go from unacceptable performance to award levels in one bi-week by doing 500% to more than 1000% of their production goal.”…

See Jeff’s post for other details and resources.

Assuming the records for patent examiners can be pried loose from the Patent Office, this would make a great topic map project. Associate the 500% periods with specific patents and further litigation on those patents, to create a resource for further attacks on patents approved by a particular examiner.

By the time a gravy train like patent examining makes the news, you know the train has already left the station.

On the up side, perhaps Congress will re-establish the Patent Office and prohibit any prior staff, contractors, etc. from working at the new Patent Office. The new Patent Office can adopt rules designed to enable innovation but also tracking prior innovation effectively. Present Patent Office goals have little to do with either of those goals.

Archive of Formal Proofs

Filed under: Formal Methods,GPU,Proof Theory — Patrick Durusau @ 1:47 pm

Archive of Formal Proofs

From the webpage:

The Archive of Formal Proofs is a collection of proof libraries, examples, and larger scientific developments, mechanically checked in the theorem prover Isabelle. It is organized in the way of a scientific journal, is indexed by dblp and has an ISSN: 2150-914x. Submissions are refereed. The preferred citation style is available [here].

It may not be tomorrow but if I don’t capture this site today, I will need to find it in the near future!

Just skimming I did see an entry of interest to the GPU crowd: Syntax and semantics of a GPU kernel programming language by John Wickerson.

Abstract:

This document accompanies the article “The Design and Implementation of a Verification Technique for GPU Kernels” by Adam Betts, Nathan Chong, Alastair F. Donaldson, Jeroen Ketema, Shaz Qadeer, Paul Thomson and John Wickerson. It formalises all of the definitions provided in Sections 3 and 4 of the article.

I first saw this in a tweet by Computer Science.

August 10, 2014

multiMiR R package and database:…

Filed under: Bioinformatics,Biomedical,MySQL,R — Patrick Durusau @ 7:37 pm

The multiMiR R package and database: integration of microRNA–target interactions along with their disease and drug associations by Yuanbin Ru, et al. ( Nucl. Acids Res. (2014) doi: 10.1093/nar/gku631)

Abstract:

microRNAs (miRNAs) regulate expression by promoting degradation or repressing translation of target transcripts. miRNA target sites have been catalogued in databases based on experimental validation and computational prediction using various algorithms. Several online resources provide collections of multiple databases but need to be imported into other software, such as R, for processing, tabulation, graphing and computation. Currently available miRNA target site packages in R are limited in the number of databases, types of databases and flexibility. We present multiMiR, a new miRNA–target interaction R package and database, which includes several novel features not available in existing R packages: (i) compilation of nearly 50 million records in human and mouse from 14 different databases, more than any other collection; (ii) expansion of databases to those based on disease annotation and drug microRNAresponse, in addition to many experimental and computational databases; and (iii) user-defined cutoffs for predicted binding strength to provide the most confident selection. Case studies are reported on various biomedical applications including mouse models of alcohol consumption, studies of chronic obstructive pulmonary disease in human subjects, and human cell line models of bladder cancer metastasis. We also demonstrate how multiMiR was used to generate testable hypotheses that were pursued experimentally.

Amazing what you can do with R and a MySQL database!

The authors briefly describe their “cleaning” process for the consolidation of these databases on page 2 but then note on page 4:

For many of the databases, the links are available. However, in Supplementary Table S2 we have listed the databases where links may be broken due to outdated identifiers in those databases. We also listed the databases that do not have the option to search by miR NA-gene pairs.

Perhaps due to editing standards (available for free lance work) I have allergy to terms like “many,” especially when it is possible to enumerate the “many.”

In this particular case, you have to download and consult Supplementary Table S2, which reads:

S2

The explanation for this table reads:

For each database, the columns indicate whether external links are available to include as part of multiMiR, whether those databases use identifiers that are updated and whether the links are based on miRNA-gene pairs. For those database that do not have updated identifiers, some links may be broken. For the other databases, where you can only search by miRNA or gene but not pairs, the links are provided by gene, except for ElMMo which is by miRNA because of its database structure.

Counting I see ten (10) databases with a blank under “Undated Identifiers” or Search by miRNA-gene,” or both.

I guess ten (10) out of fourteen (14) qualifies as “many,” but saying seventy-one percent (71%) of the databases in this study lack either “Updated Identifiers,” “Search by miRNA-gene,” or both, would have been more informative.

Potential records with these issues? EIMMo, version 4 has human (50M) and mouse (15M), MicroCosm / miRBase human (879054), and miRanda (assuming human, Good mirSVR score, Conserved miRNA), 1097069. For the rest you can consult Supplemental Table 1, which lists URLs for the databases and dates of access, but where multiple human options are available, not which one(s) were selected.

The number of records for each database that may have these problems also merits mention in the description of the data.

I can’t comment on the usefulness of this R package for exploring the data but the condition of the data it explores needs more prominent mention.

Monkeys, Copyright and Clojure

Filed under: Clojure,Intellectual Property (IP) — Patrick Durusau @ 2:29 pm

Painting in Clojure by Tom Booth is a great post that walks you though using Clojure to become a digital Jackson Pollock. I think you will enjoy the post a lot and perhaps the output, assuming you appreciate that style of art. 😉

But I have a copyright question on which I need your advice. Tom included on the webpage a blank canvas and a button that reads: “Fill canvas.”

Here is a portion of the results of my pushing the button:

digital pollock

My question is: Does Tom Booth own the copyright to this image or do I?

You may have heard of the monkey taking a selfie:

monkey selfie

and the ensuing legal disputes, If a monkey takes a selfie in the forest, who owns the copyright? No one, says Wikimedia.

The Washington Post article quotes Wikimedia Foundation’s Chief Communications Officer Katherine Maher saying:

Monkeys don’t own copyrights.[…]” “What we found is that U.S. copyright law says that works that originate from a non-human source can’t claim copyright.

OK, but I can own a copyright and I did push the button, but Tom wrote the non-human source that created the image. So, who wins?

Yet another example of why intellectual property law reform, freeing it from its 18th century (and earlier) moorings is desperately needed.

The monkey copyright case is a good deal simpler. One alleged copyright infringer (Techdirt) responded to the claim in part saying:

David Slater, almost certainly did not have a claim, seeing as he did not take the photos, and even admits that the images were an accident from monkeys who found the camera (i.e., he has stated publicly that he did not “set up” the shot and let the monkeys take it).

David Slater, until most content owners (not content producers), is too honest for his own good. He has admitted he made no contribution to the photograph. No contribution = no copyright.

This story is going to end sadly. Slater says he is in debt, yet is seeking legal counsel in the United States. Remember the definition of “conflict of interest” in the United States:

lawyer fees

😉

OK, time to get back to work and go through Tom’s Clojure post. It really is very good.

August 9, 2014

VLDB – Volume 7, 2013-2014

Filed under: BigData,Database — Patrick Durusau @ 8:47 pm

Proceedings of the Very Large Data Bases, Volume 7, 2013-2014.

You are likely already aware of the VLDB proceedings but after seeing the basis for Summingbird:… [VLDB 2014], I was reminded that I should have a tickler to check updates on the VLDB proceedings every month. August of 2014 (Volume 7, No. 12) landed a few days ago and it looks quite good.

Two tidbits to tease you into visiting:

Akash Das Sarma, Yeye He, Surajit Chaudhuri: ClusterJoin: A Similarity Joins Framework using Map-Reduce. 1059 – 1070.

Norases Vesdapunt, Kedar Bellare, Nilesh Dalvi: Crowdsourcing Algorithms for Entity Resolution. 1071 – 1082.

I count twenty-six (26) articles in issue 12 and eighty (80) in issue 13.

Just in case you have run out of summer reading material. 😉

Supercomputing frontiers and innovations

Filed under: BigData,HPC,Parallel Programming,Supercomputing — Patrick Durusau @ 7:29 pm

Supercomputing frontiers and innovations (New Journal)

From the homepage:

Parallel scientific computing has entered a new era. Multicore processors on desktop computers make parallel computing a fundamental skill required by all computer scientists. High-end systems have surpassed the Petaflop barrier, and significant efforts are devoted to the development of the next generation of hardware and software technologies towards Exascale systems. This is an exciting time for computing as we begin the journey on the road to exascale computing. ‘Going to the exascale’ will mean radical changes in computing architecture, software, and algorithms – basically, vastly increasing the levels of parallelism to the point of billions of threads working in tandem – which will force radical changes in how hardware is designed and how we go about solving problems. There are many computational and technical challenges ahead that must be overcome. The challenges are great, different than the current set of challenges, and exciting research problems await us.

This journal, Supercomputing Frontiers and Innovations, gives an introduction to the area of innovative supercomputing technologies, prospective architectures, scalable and highly parallel algorithms, languages, data analytics, issues related to computational co-design, and cross-cutting HPC issues as well as papers on supercomputing education and massively parallel computing applications in science and industry.

This journal provides immediate open access to its content on the principle that making research freely available to the public supports a greater global exchange of knowledge. We hope you find this journal timely, interesting, and informative. We welcome your contributions, suggestions, and improvements to this new journal. Please join us in making this exciting new venture a success. We hope you will find Supercomputing Frontiers and Innovations an ideal venue for the publication of your team’s next exciting results.

Becoming “massively parallel” isn’t going to free “computing applications in science and industry” from semantics. If anything, the more complex applications become, the easier it will be to mislay semantics, to the user’s peril.

Semantic efforts that did not scale for applications in the last decade face even dimmer prospects in the face of “big data” and massively parallel applications.

I suggest we move the declaration of semantics closer to or at the authors of content/data. At least as a starting point for discussion/research.

Current issue.

400 GTEPS on 4096 GPUs

Filed under: Distributed Systems,GPU,Graphs — Patrick Durusau @ 7:14 pm

Breadth-First Graph Search Uses 2D Domain Decomposition – 400 GTEPS on 4096 GPUs by Rob Farber.

From the post:

Parallel Breadth-First Search is a standard benchmark and the basis of many other graph algorithms. The challenge li[]es in partitioning the graph across multiple nodes in a cluster while avoiding load-imbalance and communications delays. The authors of the paper, “Parallel Breadth First Search on the Kepler Architecture” utilize an interesting 2D decomposition of the graph adjacency matrix. Tests on R-MAT graphs shows large graph performance ranging from 1.1 GTEP on a single K20 to 396 GTEP using 4096 GPUs. The tests also compared performance against the method of Beamer (10 GTEP single SMP device and 240 GTEP on 115k cores).

See Rob’s post for background on the distributed DFS problem and additional references.

Graph processing continues to improve at an impressive rate but I wonder how applicable some techniques are to intersections of graphs?

The optimization of using a bitmap to mark vertices visited (Scalable Graph Exploration on Multicore Processors, Agarwal, et al., 2010), cited by authors of Parallel Distributed Breadth First Search on the Kepler Architecture saying:

Then, to reduce the work, we used an integer map to keep track of visited vertices. Agarwal et al., first introduced this optimization using a bitmap that has been used in almost all subsequent works.

appears to be stumbling block to tracking a vertex that appears in intersecting graphs.

Or would you track visited vertices in each intersecting graph separately? And communicate results from each intersecting graph?

DSL for Distributed Heterogeneous Systems

Filed under: Distributed Systems,DSL,Heterogeneous Programming — Patrick Durusau @ 3:57 pm

A Domain-Specific Language for Volume Processing and Visualization on Distributed Heterogeneous Systems

From the webpage:

As the size of image data from microscopes and telescopes increases, the need for high-throughput processing and visualization of large volumetric data has become more pressing. At the same time, many-core processors and GPU accelerators are commonplace, making high-performance distributed heterogeneous computing systems affordable. However, effectively utilizing GPU clusters is difficult for novice programmers, and even experienced programmers often fail to fully leverage the computing power of new parallel architectures due their steep learning curve and programming complexity.

In this research, we propose a new domain-specific language for volume processing and visualization on distributed heterogeneous computing systems, called Vivaldi (VIsualization LAnguage for DIstributed sytstems). Vivaldi’s Python-like grammar and parallel processing abstractions provide flexible programming tools for non-experts to easily write high-performance parallel computing code. Vivaldi provides commonly used functions and numerical operators for customized visualization and high-throughput image processing applications. We demonstrate the performance and usability of Vivaldi on several examples ranging from volume rendering to image segmentation.

A paper has been accepted for presentation at VIS2014. (9-14 November 2014, Paris)

I don’t have any other details but will keep looking.

I first saw this in a tweet by Albert Swart.

PHPTMAPI – Documentation Complete

Filed under: PHP,PHPTMAPI,Topic Maps — Patrick Durusau @ 1:55 pm

Johannes Schmidt tweeted today to announce PHPTMAPI “…is now fully documented.”

In case you are unfamiliar with PHPTMAPI:

PHPTMAPI is a PHP5 API for creating and manipulating topic maps, based on the http://tmapi.sourceforge.net/ project. This API enables PHP developers an easy and standardized implementation of ISO/IEC 13250 Topic Maps in their applications.

What is TMAPI?

TMAPI is a programming interface for accessing and manipulating data held in a topic map. The TMAPI specification defines a set of core interfaces which must be implemented by a compliant application as well as (eventually) a set of additional interfaces which may be implemented by a compliant application or which may be built upon the core interfaces.

Thanks Johannes!

August 8, 2014

ContentMine

Filed under: Artificial Intelligence,Data Mining,Machine Learning — Patrick Durusau @ 6:45 pm

ContentMine

From the webpage:

The ContentMine uses machines to liberate 100,000,000 facts from the scientific literature.

We believe that Content Mining has huge potential to make knowledge available to everyone (including machines). This can enable new and exciting research, technology developments such as in Artificial Intelligence, and opportunities for wealth creation.

Manual content-mining has been routine for 150 years, but many publishers feel threatened by machine-content-mining. It’s certainly disruptive technology but we argue that if embraced wholeheartedly it will take science forward massively and create completely new opportunities. Nevertheless many mainstream publishers have actively campaigned against it.

Although content mining can be done without breaking current laws, the borderline between legal and illegal is usually unclear. So we campaign for reform, and we work on the basis that anything that is legal for a human should also be legal for a machine.

* The right to read is the right to mine *

Well, when I went to see what facts had been discovered:

We don’t have any facts yet – there should be some here very soon!

Well, at least now you have the URL and the pitch. Curious when facts are going to start to appear?

I’m not entirely comfortable with the term “facts” because it is usually used to put some particular “fact” off-limits from discussion or debate. “It’s a fact that ….” (you fill in the blank) To disagree with such a statement makes the questioner appear stupid, obstinate or even rude.

Which is, of course, the purpose of any statement “It’s a fact that….” It is intended to end debate on that “fact” and to exclude anyone who continues to disagree.

While we wait for “facts” to appear at ContentMine, research the history of claims of various “facts” in history. You can start with some “facts” about beavers.

Genomics Standards Consortium

Filed under: Bioinformatics,Genomics — Patrick Durusau @ 4:13 pm

Genomics Standards Consortium

From the homepage:

The Genomic Standards Consortium ( GSC) is an open-membership working body formed in September 2005. The goal of this International community is to promote mechanisms that standardize the description of genomes and the exchange and integration of genomic data.

This was cited in Genomic Encyclopedia of Bacteria….

If you are interested in the “exchange and integration of genomic data,” you will find a number of projects of interest to you.

Naming issues are everywhere but they get more attention, at least for the moment, in science and related areas.

I would not push topic maps syntax but I would suggest that capturing what a reasonable person thinks when identifying a subject, their inner checklist of properties as it were, will assist others in comparing their internal checklist of properties.

If that “inner” list isn’t written down, there is nothing on which to make a comparison.

Genomic Encyclopedia of Bacteria…

Filed under: Bioinformatics,Biology,Genomics — Patrick Durusau @ 4:03 pm

Genomic Encyclopedia of Bacteria and Archaea: Sequencing a Myriad of Type Strains by Nikos C. Kyrpides, et al. (Kyrpides NC, Hugenholtz P, Eisen JA, Woyke T, Göker M, et al. (2014) Genomic Encyclopedia of Bacteria and Archaea: Sequencing a Myriad of Type Strains. PLoS Biol 12(8): e1001920. doi:10.1371/journal.pbio.1001920)

Abstract:

Microbes hold the key to life. They hold the secrets to our past (as the descendants of the earliest forms of life) and the prospects for our future (as we mine their genes for solutions to some of the planet’s most pressing problems, from global warming to antibiotic resistance). However, the piecemeal approach that has defined efforts to study microbial genetic diversity for over 20 years and in over 30,000 genome projects risks squandering that promise. These efforts have covered less than 20% of the diversity of the cultured archaeal and bacterial species, which represent just 15% of the overall known prokaryotic diversity. Here we call for the funding of a systematic effort to produce a comprehensive genomic catalog of all cultured Bacteria and Archaea by sequencing, where available, the type strain of each species with a validly published name (currently~11,000). This effort will provide an unprecedented level of coverage of our planet’s genetic diversity, allow for the large-scale discovery of novel genes and functions, and lead to an improved understanding of microbial evolution and function in the environment.

While I am a standards advocate, I have to disagree with some of the claims for standards:

Accurate estimates of diversity will require not only standards for data but also standard operating procedures for all phases of data generation and collection [33],[34]. Indeed, sequencing all archaeal and bacterial type strains as a unified international effort will provide an ideal opportunity to implement international standards in sequencing, assembly, finishing, annotation, and metadata collection, as well as achieve consistent annotation of the environmental sources of these type strains using a standard such as minimum information about any (X) sequence (MixS) [27],[29]. Methods need to be rigorously challenged and validated to ensure that the results generated are accurate and likely reproducible, without having to reproduce each point. With only a few exceptions [27],[29], such standards do not yet exist, but they are in development under the auspices of the Genomics Standards Consortium (e.g., the M5 initiative) (http://gensc.org/gc_wiki/index.php/M5) [35]. Without the vehicle of a grand-challenge project such as this one, adoption of international standards will be much less likely.

Some standardization will no doubt be beneficial but for the data that is collected, a topic map informed approach where critical subjects are identified not be surface tokens but by key/value pairs would be much better.

In part because there is always legacy data and too little time and funding to back fit every change in present terminology to past names. Or should I say it hasn’t happen outside of one specialized chemical index that comes to mind.

« Newer PostsOlder Posts »

Powered by WordPress