Another Word For It Patrick Durusau on Topic Maps and Semantic Diversity

February 19, 2015

Titan 0.5.4 Release!

Filed under: Graphs,Titan — Patrick Durusau @ 7:01 pm

Titan 0.5.4 Release! by Dan LaRocque.

From the post:

We’re pleased to announce the release of Titan 0.5.4.

This is mostly a bugfix release. It also includes property read optimization.

The zip archives:

http://s3.thinkaurelius.com/downloads/titan/titan-0.5.4-hadoop1.zip
http://s3.thinkaurelius.com/downloads/titan/titan-0.5.4-hadoop2.zip

The documentation:

Manual: http://s3.thinkaurelius.com/docs/titan/0.5.4/
Javadoc: http://titan.thinkaurelius.com/javadoc/0.5.4/

The 0.5.4 release is compatible with earlier releases in the 0.5 series. There are no user-facing API changes and no storage changes between 0.5.3 and this release. For upgrades from 0.5.2 and earlier, consider the upgrade notes about minor API changes:

http://s3.thinkaurelius.com/docs/titan/0.5.4/upgrade.html

The changelog contains a bit more information about what’s new in this
release:

http://s3.thinkaurelius.com/docs/titan/0.5.4/changelog.html

We are indebted to the community for valuable bug and pain point reports that shaped 0.5.4.

Bugfix only or not, users in the United States will welcome any distraction from the current cold wave! šŸ˜‰

Graph data management

Filed under: Graph Databases,Graphs — Patrick Durusau @ 4:01 pm

Graph data management by Amol Deshpande.

From the post:

Graph data management has seen a resurgence in recent years, because of an increasing realization that querying and reasoning about the structure of the interconnections between entities can lead to interesting and deep insights into a variety of phenomena. The application domains where graph or network analytics are regularly applied include social media, finance, communication networks, biological networks, and many others. Despite much work on the topic, graph data management is still a nascent topic with many open questions. At the same time, I feel that the research in the database community is fragmented and somewhat disconnected from application domains, and many important questions are not being investigated in our community. This blog post is an attempt to summarize some of my thoughts on this topic, and what exciting and important research problems I think are still open.

At its simplest, graph data management is about managing, querying, and analyzing a set of entities (nodes) and interconnections (edges) between them, both of which may have attributes associated with them. Although much of the research has focused on homogeneous graphs, most real-world graphs are heterogeneous, and the entities and the edges can usually be grouped into a small number of well-defined classes.

Graph processing tasks can be broadly divided into a few categories. (1) First, we may to want execute standard SQL queries, especially aggregations, by treating the node and edge classes as relations. (2) Second, we may have queries focused on the interconnection structure and its properties; examples include subgraph pattern matching (and variants), keyword proximity search, reachability queries, counting or aggregating over patterns (e.g., triangle/motif counting), grouping nodes based on their interconnection structures, path queries, and others. (3) Third, there is usually a need to execute basic or advanced graph algorithms on the graphs or their subgraphs, e.g., bipartite matching, spanning trees, network flow, shortest paths, traversals, finding cliques or dense subgraphs, graph bisection/partitioning, etc. (4) Fourth, there are ā€œnetwork scienceā€ or ā€œgraph miningā€ tasks where the goal is to understand the interconnection network, build predictive models for it, and/or identify interesting events or different types of structures; examples of such tasks include community detection, centrality analysis, influence propagation, ego-centric analysis, modeling evolution over time, link prediction, frequent subgraph mining, and many others [New10]. There is much research still being done on developing new such techniques; however, there is also increasing interest in applying the more mature techniques to very large graphs and doing so in real-time. (5) Finally, many general-purpose machine learning and optimization algorithms (e.g., logistic regression, stochastic gradient descent, ADMM) can be cast as graph processing tasks in appropriately constructed graphs, allowing us to solve problems like topic modeling, recommendations, matrix factorization, etc., on very large inputs [Low12].

Prior work on graph data management could itself be roughly divided into work on specialized graph databases and on large-scale graph analytics, which have largely evolved separately from each other; the former has considered end-to-end data management issues including storage representations, transactions, and query languages, whereas the latter work has typically focused on processing specific tasks or types of tasks over large volumes of data. I will discuss those separately, focusing on whether we need ā€œnewā€ systems for graph data management and on open problems.

Very much worth a deep, slow read. Despite marketing claims about graph databases, fundamental issues remain to be solved.
Enjoy!

I first saw this in a tweet by Kirk Borne

February 17, 2015

Clustering by Descending to the Nearest Neighbor in the Delaunay Graph Space

Filed under: Clustering,Graphs — Patrick Durusau @ 5:37 pm

Clustering by Descending to the Nearest Neighbor in the Delaunay Graph Space by Teng Qiu and Yongjie Li.

Abstract:

In our previous works, we proposed a physically-inspired rule to organize the data points into an in-tree (IT) structure, in which some undesired edges are allowed to occur. By removing those undesired or redundant edges, this IT structure is divided into several separate parts, each representing one cluster. In this work, we seek to prevent the undesired edges from arising at the source. Before using the physically-inspired rule, data points are at first organized into a proximity graph which restricts each point to select the optimal directed neighbor just among its neighbors. Consequently, separated in-trees or clusters automatically arise, without redundant edges requiring to be removed.

The latest in a series of papers exploring clustering issues. The author’s concede the method demonstrated here isn’t important but represents another step in their exploration.

It isn’t often that I see anything other than final and “defend to the death” results. Preliminary and non-successful results being published will increase the bulk of scientific material to be searched but it will also leave a more accurate record of the scientific process.

Enjoy!

February 9, 2015

NodeXL Eye Candy

Filed under: Graphs,Visualization — Patrick Durusau @ 3:30 pm

node-xl-1

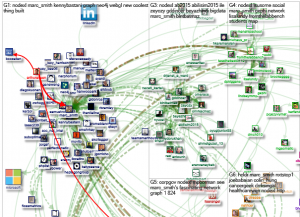
This only part of a graph visualization that you will find at: http://nodexlgraphgallery.org/Pages/Graph.aspx?graphID=39261. The visualization was produced by Marc Smith.

I first saw this mentioned in a tweet by Kenny Bastani.

With only two hundred and fifty-six nodes and five hundred and fifty-two unique edges, you can start to see some of the problems with graph visualization.

Can you visually determine the top ten (10) nodes in this display?

The more complex the graph, the harder it will be in some cases to visually evaluate the graph. Citation graphs for example, will exhibit recognizable clusters even if the graph is very “busy.” On the other hand, if you are seeking links between individuals, some connections are likely to be lost in the noise.

Without losing each node’s integrity as individual nodes, do you know of techniques to treat nodes as components of a larger node so that the larger nodes behavior in the visualization is determined by the “sub-“nodes it contains? Thinking of it as a way to “summarize” the data of the individual nodes and keep them in play for a visualization.

When interesting behavior is exhibited, the virtual node could be expanded and the relationships refined based on the nodes within.

February 6, 2015

Announcing the Interest Graph API [Prismatic]

Filed under: Graphs — Patrick Durusau @ 3:07 pm

Announcing the Interest Graph API by Dave Golland.

From the post:

Today weā€™re taking the first step in opening up our interest graph by releasing an API that automatically identifies the thematic content of a piece of text. Sign up for an API token to start tagging your text.

Our Expertise in Your Hands

At Prismatic weā€™ve spent a long time thinking about how to provide our users with the most relevant recommendations. To do this, weā€™ve engineered the interest graph — a model that helps us understand our users, their interests, publishers, content, and the connections between them. By aligning with usersā€™ interests, the interest graph enables recommendations of products and content to deliver an experience that people care about. Today, weā€™re releasing the first building block of our interest graph, the connection between content and interests.

When we built the interest graph for Prismatic, we wanted to find interests that people identify with. Most existing taxonomies were either too specific (e.g., Wikipedia) or too task-focused (e.g., ads targeting), so we decided to build our own. We surveyed the popular newspaper categories that have been used to classify articles for centuries, supplemented this list with the top liked pages on Facebook, and added the most popular search queries from the Prismatic app. The result is the most comprehensive list of interests that people care about on the web today.

These interests are single-phrase summaries of the thematic content of a piece of text; examples include Functional Programming, Celebrity Gossip, or Flowers. Interests provide a short, meaningful summary of the content of an article, so you can quickly get a sense for what itā€™s about without spending the time reading it. By providing a short, intelligible summary, interests lend useful structure to otherwise raw, unstructured text.

We have received many requests to open our interest graph to external developers. Today, weā€™re happy to announce an ALPHA version of the same interest graph powering Prismatic. We are excited to see the creative and new projects that will come from getting our interest graph into the hands of developers.

As an “ALPHA” version, Prismatic needs your help to check the functioning of the API and the accuracy of tagging. Get in on the “ground” floor!

February 4, 2015

Graph-Tool – Update!

Filed under: Graphs,Networks — Patrick Durusau @ 8:35 pm

Graph-Tool – Update!

From the webpage:

Graph-tool is an efficient Python module for manipulation and statistical analysis of graphs (a.k.a. networks). Contrary to most other python modules with similar functionality, the core data structures and algorithms are implemented in C++, making extensive use of template metaprogramming, based heavily on the Boost Graph Library. This confers it a level of performance that is comparable (both in memory usage and computation time) to that of a pure C/C++ library.

A new version of graph-tool is available for downloading!

A graph based analysis of the 2016 U.S. Budget is going to require all the speed you can muster!

Enjoy!

February 2, 2015

Neo4j 2.2 Milestone 3 Release

Filed under: Graphs,Neo4j — Patrick Durusau @ 7:47 pm

Highlights of Neo4j 2.2 release:

From the post:

Three of the key areas being tackled in this release are:

      1. Highly Concurrent Performance

      With Neo4j 2.2, we introduce a brand new page cache designed to deliver extreme performance and scalability under highly concurrent workloads. This new page cache helps overcome the limitations imposed by the current IO systems to support larger applications with hundreds of read and/or write IO requirements. The new cache is auto-configured and matches the available memory without the need to tune memory mapped IO settings anymore.

      2. Transactional & Batch Write Performance

      We have made several enhancements in Neo4j 2.2 to improve both transactional and batch write performance by orders of magnitude under highly concurrent load. Several things are changing to make this happen.

      • First, the 2.2 release improves coordination of commits between Lucene, the graph, and the transaction log, resulting in a much more efficient write channel.
      • Next, the database kernel is enhanced to optimize the flushing of transactions to disk for high number of concurrent write threads. This allows throughput to improve significantly with more write threads since IO costs are spread across transactions. Applications with many small transactions being piped through large numbers (10-100+) of concurrent write threads will experience the greatest improvement.
      • Finally, we have improved and fully integrated the “Superfast Batch Loader”. Introduced in Neo4j 2.1, this utility now supports large scale non-transactional initial loads (of 10M to 10B+ elements) with sustained throughputs around 1M records (node or relationship or property) per second. This seriously fast utility is (unsurprisingly) called neo4j-import, and is accessible from the command line.

      3. Cypher Performance

      Weā€™re very excited to be releasing the first version of a new Cost-Based Optimizer for Cypher, under development for nearly a year. While Cypher is hands-down the most convenient way to formulate queries, it hasnā€™t always been as fast as weā€™d like. Starting with Neo4j 2.2, Cypher will determine the optimal query plan by using statistics about your particular data set. Both the cost-based query planner, and the ability of the database to gather statistics, are new, and weā€™re very interested in your feedback. Sample queries & data sets are welcome!

The most recent milestone is here.

Now is the time to take Neo4j 2.2 for a spin!

January 20, 2015

Flask and Neo4j

Filed under: Blogs,Graphs,Neo4j,Python — Patrick Durusau @ 5:03 pm

Flask and Neo4j – An example blogging application powered by Flask and Neo4j. by Nicole White.

From the post:

I recommend that you read through Flask’s quickstart guide before reading this tutorial. The following is drawn from Flask’s tutorial on building a microblog application. This tutorial expands the microblog example to include social features, such as tagging posts and recommending similar users, by using Neo4j instead of SQLite as the backend database.
(14 parts follow here)

The fourteen parts take you all the way through deployment on Heroku.

I don’t think you will abandon your current blogging platform but you will gain insight into Neo4j and Flask. A non-trivial outcome.

The PokitDok HealthGraph

Filed under: Graphs,Health care — Patrick Durusau @ 4:32 pm

The PokitDok HealthGraph by Denise Gosnell, PhD and Alec Macrae.

From the post:

doctor_graph

While the front-end team has been busy putting together version 3 of our healthcare marketplace, the data science team has been hard at work on several things that will soon turn into new products. Today, I’d like to give you a sneak peek at one of these projects, one that we think will profoundly change the way you think about health data. We call it the PokitDok HealthGraph. Let’s ring in the New Year with some data science!

Everyoneā€™s been talking about Graph Theory, but what is it, exactly?

And we arenā€™t talking about bar graphs and pie charts.

Social networks have brought the world of graph theory to the forefront of conversation. Even though graph theory has been around since Euler solved the infamous Konigsberg bridge problem in the 1700ā€™s, we can thank the current age of social networking for giving graph theory a modern revival.

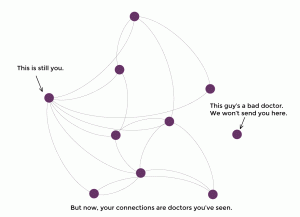
At the very least, graph theory is the art of connecting the dots, kind of like those sweet pictures you drew as a kid. A bit more formally, graph theory studies relationships between people, places and/or things. Take any olā€™ social network – Facebook, for example, uses a graph database to help people find friends and interests. In graph theory, we represent this type of information with nodes (dots) and edges (lines) where the nodes are people, places and/or things and the lines represent their relationship.

To make a long story short: healthcare is about you and connecting you with quality care. When data scientists think of connecting things together, graphs are most often the direction we go.

At PokitDok, we like to look at your healthcare needs as a social network, aka: your personal HealthGraph. The HealthGraph is a network of doctors, other patients, insurance providers, common ailments and all of the potential connections between them.

Hard to say in advance but it looks like Denise and Alec are close to the sweet spot on graph explanations for lay people. Having subject matter that is important to users helps. And using familiar names for the nodes of the graph works as well.

Worth following this series of posts to see if they continue along this path.

Modelling Data in Neo4j: Labels vs. Indexed Properties

Filed under: Graphs,Neo4j — Patrick Durusau @ 2:15 pm

Modelling Data in Neo4j: Labels vs. Indexed Properties by Christophe Willemsen.

From the post:

A common question when planning and designing your Neo4j Graph Database is how to handle "flagged" entities. This could
include users that are active, blog posts that are published, news articles that have been read, etc.

Introduction

In the SQL world, you would typically create a a boolean|tinyint column; in Neo4j, the same can be achieved in the
following two ways:

  • A flagged indexed property
  • A dedicated label

Having faced this design dilemma a number of times, we would like to share our experience with the two
presented possibilities and some Cypher query optimizations that will help you take a full advantage of a the graph database.

Throughout the blog post, we'll use the following example scenario:

  • We have User nodes
  • User FOLLOWS other users
  • Each user writes multiple blog posts stored as BlogPost nodes
  • Some of the blog posts are drafted, others are published (active)

This post will help you make the best use of labels in Neo4j.

Labels are semantically opaque so if your Neo4j database has “German” to label books written in German, you are SOL if you need German for nationality.

That is a weakness semantically opaque tokens. Having type properties on labels would push the semantic opaqueness to the next level.

January 18, 2015

TinkerPop is moving to Apache (Incubator)

Filed under: Graphs,TinkerPop — Patrick Durusau @ 9:10 pm

TinkerPop is moving to Apache (Incubator) by Marko A. Rodriguez.

From the post:

Over the last (almost) year, we have been working to get TinkerPop into a recognized software foundation — with our eyes primarily on The Apache Software Foundation. This morning, the voting was complete and TinkerPop will become an Apache Incubator project on Tuesday January 16th.

The primary intention of this move to Apache was to:

  1. Further guarantee vendor neutrality and vendor uptake.
  2. Better secure our developers and users legally.
  3. Grow our developer and user base.

I hope people see this as a positive and will bear with us as we go through the process of migrating our infrastructure over the month of February. Note that we will be doing our 3.0.0.M7 release on Monday (Jan 15th) with it being the last TinkerPop release. The next one (M8 or GA) will be an Apache release. Finally, note that we will be keeping this mailing list with a mirror being on Apache’s servers (that was a hard won battle :).

Take care and thank you for using of our software, The TinkerPop.

http://markorodriguez.com

tinkerpop-apache

So long as Marko keeps doing cool graphics, it’s fine by me. šŸ˜‰

More seriously increasing visibility can’t help but drive TinkerPop to new heights. Or for graph software, would that be to new connections?

January 13, 2015

Who’s like Tatum?

Filed under: D3,Graphs,Music — Patrick Durusau @ 4:15 pm

Who’s like Tatum? by Peter Cook.

art-tatum

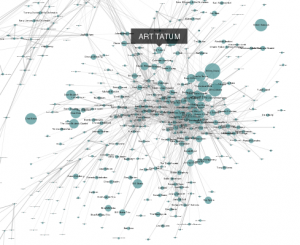
Only a small part of the jazz musical universe that awaits you at “Who’s Like Tatum?

The description at the site reads:

Who’s like Tatum?

Art Tatum was one of the greatest jazz pianists ever. His extraordinary command of the piano was legendary and was rarely surpassed.

This is a network generated from Last.fm‘s similar artist data. Using Art Tatum as a starting point, I’ve recursively gathered similar artists.

The visualisation reveals some interesting clusters. To the bottom-right of Art Tatum is a cluster of be-bop musicians including Miles Davis, Charlie Parker and Thelonious Monk.

Meanwhile to the top-left of Tatum is a cluster of swing bands/musicians featuring the likes of Count Basie, Benny Goodman and a couple of Tatum’s contemporary pianists Fats Waller and Teddy Wilson. Not surprisingly we see Duke Ellington spanning the gap between these swing and be-bop musicians.

If we work counter-clockwise we can observe clusters of vocalists (e.g. Mel TormĆ© and Anita O’Day), country artists (e.g. Hank Williams and Loretta Lynn) and blues artists (e.g. Son House and T-Bone Walker).

It’s interesting to spot artists who span different genres such as Big Joe Turner who has links to both swing and blues artists. Might this help explain his early involvement in rock and roll?

Do explore the network yourself and see what insights you can unearth. (Can’t read the labels? Use your browser’s zoom controls!)

Designed and developed by Peter Cook. Data from the Last.fm API enquired with pylast. Network layout using D3.

At the site, mousing over the name of an artist in the description pops up their label in the graph.

As interesting as such graphs can be, what I always wonder about is the measure used for “similarity?” Or were multiple dimensions used to measure similarity?

I can enjoy and explore such a presentation but I can’t engage in a discussion with the author or anyone else about how similar or dissimilar any artist was or along what dimensions. It isn’t that those subjects are missing, but they are unrepresented so there is no place to record my input.

One of the advantages of topic maps being that you can choose which subjects you will represent and which ones you want. Which of course means anyone following you in the same topic map can add the subjects they want to discuss as well.

For a graph such as this one, represented as a topic map, I could add subjects to represent the base(s) for similarity and comments by others on the similarity or lack thereof of particular artists. Other subjects?

Or to put it more generally, how do you merge different graphs?

January 10, 2015

The Hobbit Graph, or To Nodes and Back Again

Filed under: Graphs,Neo4j — Patrick Durusau @ 4:43 pm

The Hobbit Graph, or To Nodes and Back Again by Kevin Van Gundy.

From the webpage:

With the final installment of Peter Jacksonā€™s Hobbit Trilogy only a few months away, I decided it would be fun to graph out Tolkienā€™s novel in Neo4j and try a few different queries to show how a graph database can tell your dataā€™s story.

This is quite clever and would sustain the interest of anyone old enough to appreciate the Hobbit.

Perhaps motivation to read a favorite novel slowly?

Enjoy!

I first saw this in a tweet by Nikolay Stoitsev.

January 9, 2015

Using graph databases to perform pathing analysis… [In XML too?]

Filed under: Graphs,Neo4j,Path Enumeration — Patrick Durusau @ 5:51 pm

Using graph databases to perform pathing analysis – initial experiments with Neo4J by Nick Dingwall.

From the post:

In the first post in this series, we raised the possibility that graph databases might allow us to analyze event data in new ways, especially where we were interested in understanding the sequences that events occured in. In the second post, we walked through loading Snowplow page view event data into Neo4J in a graph designed to enable pathing analytics. In this post, weā€™re going to see whether the hypothesis we raised in the first post is right: can we perform the type of pathing analysis on Snowplow data that is so difficult and expensive when itā€™s in a SQL database, once itā€™s loaded in a graph?

In this blog post, weā€™re going to answer a set of questions related to the journeys that users have taken through our own (this) website. Weā€™ll start by answering some some easy questions to get used to working with Cypher. Note that some of these simpler queries could be easily written in SQL; weā€™re just interested in checking out how Cypher works at this stage. Later on, weā€™ll move on to answering questions that are not feasible using SQL.

If you dream in markup, ;-), you are probably thinking what I’m thinking. Yes, what about modeling paths in markup documents? What is more, visualizing those paths. Would certainly beat the hell out of some of the examples you find in the XML specifications.

Not to mentioned that they would be paths in your own documents.

Question: I am assuming you would not collapse all the <p> nodes yes? That is for some purposes we display the tree as though every node is unique, identified by its location in the markup tree. For other purposes it might be useful to visualize some paths as collapsed node where size or color is an indicator of the number of nodes collapsed into that path.

That sounds like a Balisage presentation for 2015.

Natural Language Analytics made simple and visual with Neo4j

Filed under: Graphs,Natural Language Processing,Neo4j — Patrick Durusau @ 5:10 pm

Natural Language Analytics made simple and visual with Neo4j by Michael Hunger.

From the post:

I was really impressed by this blog post on Summarizing Opinions with a Graph from Max and always waited for Part 2 to show up šŸ™‚

The blog post explains an really interesting approach by Kavita Ganesan which uses a graph representation of sentences of review content to extract the most significant statements about a product.

From later in the post:

The essence of creating the graph can be formulated as: “Each word of the sentence is represented by a shared node in the graph with order of words being reflected by relationships pointing to the next word”.

Michael goes on to create features with Cypher and admits near the end that “LOAD CSV” doesn’t really care if you have CSV files or not. You can split on a space and load text such as the “Lord of the Rings poem of the One Ring” into Neo4j.

Interesting work and a good way to play with text and Neo4j.

The single node per unique word presented here will be problematic if you need to capture the changing roles of words in a sentence.

December 24, 2014

Holiday Gift: Open-Source C++ SDK & GraphLab Create 1.2

Filed under: C/C++,GraphLab,Graphs — Patrick Durusau @ 5:58 pm

Holiday Gift: Open-Source C++ SDK & GraphLab Create 1.2 by Rajat Arya.

From the post:

Just when you were wondering how to keep from getting bored this holiday season, weā€™re delivering something to fuel your creativity and sharpen your C++ coding skills. With the release of GraphLab Create 1.x SDK (beta) you can now harness and extend the C++ engine that powers GraphLab Create.

Extensions built with the SDK can directly access the SFrame and SGraph data structures from within the C++ engine. Direct access enables you to build custom algorithms, toolkits, and lambdas in efficient native code. The SDK provides a lightweight path to create and compile custom functions and expose them through Python.

One of the great things about the Internet is that as soon as you wonder something like “…how am I going to keep from being bored…” a post like this one appears in your Twitter stream. Well, at least if you are a follower of @graphlabteam. (A good reason to be following @graphlabteam.)

Watching the explosive growth of progress on graphs and graph processing over the past couple of years makes me suspect that the security side of the house is doing something wrong. Not sure what but it isn’t making this sort of progress.

Enjoy the SDK!

December 21, 2014

How Whitepages turned the phone book into a graph

Filed under: Graphs,Marketing — Patrick Durusau @ 4:37 pm

How Whitepages turned the phone book into a graph by Jean Villedieu.

From the post:

If you were born in the 1990ā€™s or earlier, you are familiar with phone books. These books listed the phone numbers of the people living in a given area. When you wanted to contact someone you knew the name of, the phone book could help you find his number. Before people switched phones regularly and stopped caring about having a landline, this was important.

The “born in” line really hurt. šŸ˜‰

This is a feel good story about graphs and an obvious use case. However, remember the average age of leadership training is forty-two (42) which puts them in the 1970’s. If you want to sell them on graphs, the phone book might not be a bad place to start.

Just saying.

I first saw this in a tweet by Gary Stewart.

Weaver (Graph Store)

Filed under: GraphLab,Graphs,Titan — Patrick Durusau @ 3:40 pm

Weaver (Graph Store)

From the homepage:

A scalable, fast, consistent graph store

Weaver is a distributed graph store that provides horizontal scalability, high-performance, and strong consistency.

Weaver enables users to execute transactional graph updates and queries through a simple python API.

Alpha release but I did find some interesting statements in the FAQ:

Weaver is designed to store dynamic graphs. You can perform transactions on rapidly evolving graph-structured data with high throughput.

Examples of dynamic graphs?

Think online social networks, WWW, knowledge graphs, Bitcoin transaction graphs, biological interaction networks, etc. If your application manipulates graph-structured data similar to these examples, you should try Weaver out!

High throughput?

Our preliminary experiments show that Weaver achieves over 12x higher throughput than Titan on an online social network workload similar to that of Tao. In addition, Weaver also achieves 4x lower latency than GraphLab on an offline, graph traversal workload.

Alpha release has binaries for Ubuntu 14.04, the is a discussion list and the source code is on GitHub. Weaver has a native C++ binding and a Python client.

Impressive enough statements to start following the discussion group and to compile for Ubuntu 12.04 (yeah, I need to upgrade in the new year).

PS: There are only two messages in the discussion group since this is its first release. Get in on the ground floor!

December 12, 2014

Introducing Atlas: Netflix’s Primary Telemetry Platform

Filed under: BigData,Graphs,Visualization — Patrick Durusau @ 5:15 pm

Introducing Atlas: Netflix’s Primary Telemetry Platform

From the post:

Various previous Tech Blog posts have referred to our centralized monitoring system, and we’ve presented at least one talk about it previously. Today, we want to both discuss the platform and ecosystem we built for time-series telemetry and its capabilities and announce the open-sourcing of its underlying foundation.

atlas image

How We Got Here

While working in the datacenter, telemetry was split between an IT-provisioned commercial product and a tool a Netflix engineer wrote that allowed engineers to send in arbitrary time-series data and then query that data. This tool’s flexibility was very attractive to engineers, so it became the primary system of record for time series data. Sadly, even in the datacenter we found that we had significant problems scaling it to about two million distinct time series. Our global expansion, increase in platforms and customers and desire to improve our production systems’ visibility required us to scale much higher, by an order of magnitude (to 20M metrics) or more. In 2012, we started building Atlas, our next-generation monitoring platform. In late 2012, it started being phased into production, with production deployment completed in early 2013.

The use of arbitrary key/value pairs to determine a metrics identity merits a slow read. As does the query language for metrics, said “…to allow arbitrarily complex graph expressions to be encoded in a URL friendly way.”

Posted to Github with a longer introduction here.

The Wikipedia entry on time series offers this synopsis on time series data:

A time series is a sequence of data points, typically consisting of successive measurements made over a time interval. Examples of time series are ocean tides, counts of sunspots, and the daily closing value of the Dow Jones Industrial Average. Time series are very frequently plotted via line charts. Time series are used in statistics, signal processing, pattern recognition, econometrics, mathematical finance, weather forecasting, earthquake prediction, electroencephalography, control engineering, astronomy, communications engineering, and largely in any domain of applied science and engineering which involves temporal measurements.

It looks to me like a number of users communities should be interested in this release from Netflix!

Speaking of series, it occurs to me that is you count the character lengths of blanks in the Senate CIA torture report, you should be able to make some fairly good guesses on some of the names.

I am hopeful it doesn’t come to that because anyone with access to the full 6,000 page uncensored report has a moral obligation to post it to public servers. Surely there is one person with access to that report with a moral conscience.

I first saw this in a tweet by Roy Rapoport

December 9, 2014

A Quick Spin Around the Big Dipper

Filed under: Astroinformatics,Graphs — Patrick Durusau @ 8:10 pm

A Quick Spin Around the Big Dipper by Summer Ash.

From the post:

From our perspective here on Earth, constellations appear to be fixed groups of stars, immobile on the sky. But what if we could change that perspective?

In reality, itā€™d be close to impossible. We would have to travel tens to hundreds of light-years away from Earth for any change in the constellations to even begin to be noticeable. As of this moment, the farthest we (or any object weā€™ve made) have traveled is less than one five-hundreth of a light-year.

Just for fun, letā€™s say we could. What would our familiar patterns look like then? The stars that comprise them are all at different distances from us, traveling around the galaxy at different speeds, and living vastly different lives. Very few of them are even gravitationally bound to each other. Viewed from the side, they break apart into unrecognizable landscapes, their stories of gods and goddesses, ploughs and ladles, exposed as pure human fantasy. We are reminded that we live in a very big place.

Great visualizations.

Summer’s post reminded me of Caleb Jones’ Stellar Navigation Using Network Analysis and how he created 3-D visualizations out to various distances.

By rotating Caleb’s 3-D graphs there would be more stars in the way of your vision but it might also be more realistic.

Just as a thought experiment for the moment, what if you postulated a planet around a distant star and the transparency of the atmosphere for observing distant stars? What new constellations would you see from such a distant world?

Other than speed of travel, what would be the complexities of travel and governance across a sphere of influence of say 1,000 light years? Any natural groupings that might have similar interests?

Enjoy!

Finding clusters of CRAN packages using igraph

Filed under: Graphs,R — Patrick Durusau @ 6:56 pm

Finding clusters of CRAN packages using igraph by Andrie de Vries.

From the post:

In a previous post I demonstrated how to use the igraph package to create a network diagram of CRAN packages and compute the page rank.

Now I extend this analysis and try to find clusters of packages that are close to one another.

Andrie assigns labels to the resulting groups and then worries:

With clusters this large, it’s quite brazen (and possibly just wrong) to try and interpret the clusters for meaning.

Not at all!

Without grouping and labeling, there is no opportunity to discover how others might group and label the same items. We may all stare at the same items but if no one groups or labels them, we can walk away with private and very different understandings of how items should be grouped.

I remember a scifi novel where one character observes “sheep are different from each other,” to which another character added, “but only to other sheep.” Our use of different groupings isn’t all that is important. The reasons we see/give for creating different groupings are important as well.

The Path Forward (Titan 1.0 and TinkerPop 3.0)

Filed under: Graphs,TinkerPop,Titan — Patrick Durusau @ 5:40 pm

The Path Forward by Marko Rodriguez.

A good overview of Titan 1.0 and TinkerPop 3.0. Marko always makes great slides.

I appreciate mythology as an example but it would be nice to see an example of Titan/TinkerPop used in anger.

With the limitation that the data be legally accessible (sorry) what would you suggest as a great example of using Titan/TinkerPop?

Since everyone likes mobile phone apps, I would suggest one that displays a street map and as you pass street addresses, it lights up the address as blue or red depending on their political contributions. Brighter colors for larger donations.

I think that would prove to be very popular.

Would that be a good example for Titan/TinkerPop?

What’s yours?

December 7, 2014

Stellar Navigation Using Network Analysis

Filed under: Astroinformatics,Graphs,Networks — Patrick Durusau @ 3:14 pm

Stellar Navigation Using Network Analysis by Caleb Jones.

To give you an idea of where this post ends up:

From the post:

This has been the funnest and most challenging network analysis and visualization I have done to date. As I've mentioned before, I am a huge space fan. One of my early childhood fantasies was the idea of flying instantly throughout the universe exploring all the different planets, stars, nebulae, black holes, galaxies, etc. The idea of a (possibly) infinite universe with inexhaustible discoveries to be made has kept my interest and fascination my whole life. I identify with the sentiment expressed by Carl Sagan in his book Pale Blue Dot:

In the last ten thousand years, an instant in our long history, weā€™ve abandoned the nomadic life. For all its material advantages, the sedentary life has left us edgy, unfulfilled. The open road still softly calls like a nearly forgotten song of childhood. Your own life, or your band’s, or even your species’ might be owed to a restless fewā€”drawn, by a craving they can hardly articulate or understand, to undiscovered lands and new worlds.

Herman Melville, in Moby Dick, spoke for wanderers in all epochs and meridians: “I am tormented with an everlasting itch for things remote. I love to sail forbidden seas…”

Maybe it’s a little early. Maybe the time is not quite yet. But those other worldsā€” promising untold opportunitiesā€”beckon.

Silently, they orbit the Sun, waiting.

Fair warning: If you aren’t already a space enthusiast, this project may well turn you into one!

Distance and relative location are only two (2) facts that are known for stars within eight (8) light-years. What other facts or resources would you connect to the stars in these networks?

December 6, 2014

Better, Faster, and More Scalable Neo4j than ever before

Filed under: Graphs,Neo4j — Patrick Durusau @ 11:18 am

Better, Faster, and More Scalable Neo4j than ever before by Philip Rathle.

From the post:

Neo4j 2.2 aims to be our fastest and most scalable release ever. With Neo4j 2.2 our engineering team introduces massive enhancements to the internal architecture resulting in higher performance and scalability.

This first milestone (or beta release) pulls all of these new elements together, so that you can ā€œdial it up to 11ā€³ with your applications. You can download it here for your testing.

Philip highlights:

  1. Highly Concurrent Performance
  2. Transactional & Batch Write Performance
  3. Cypher Performance (includes a Cost-Based Optimizer)

BTW, there is news of a new and improved batch loader: neo4j-import.

I included the direct link because the search interface for the milestone release acts oddly.

If you enter (with quotes) “neo4j-import” (not an unreasonable query), results are returned for: import, neo4j. I haven’t tried other queries that include a hyphen. You?

December 2, 2014

TinkerPop 3.0.0.M6 Released — A Gremlin Rāga in 7/16 Time

Filed under: Graphs,Gremlin,TinkerPop — Patrick Durusau @ 7:34 pm

TinkerPop 3.0.0.M6 Released — A Gremlin Rāga in 7/16 Time by Marko A. Rodriguez.

From post:

Dear ladies and gentlemen of the TinkerPop,

TinkerPop productions, in association with Gremlin Studios, presents a Gremlin-Users codebase, featuring TinkerPop-Contributorsā€¦TinkerPop 3.0.0.M6. Staring, Gremlin as himself.

https://github.com/tinkerpop/tinkerpop3/blob/master/CHANGELOG.asciidoc

Documentation

AsciiDoc: http://tinkerpop.com/docs/3.0.0.M6/
JavaDoc[core]: http://tinkerpop.com/javadocs/3.0.0.M6/core/
JavaDoc[full]: http://tinkerpop.com/javadocs/3.0.0.M6/full/

Downloads

Gremlin Console: http://tinkerpop.com/downloads/3.0.0.M6/gremlin-console-3.0.0.M6.zip
Gremlin Server: http://tinkerpop.com/downloads/3.0.0.M6/gremlin-server-3.0.0.M6.zip

If you want a better sense of graphs than “Everything is a graph!” type promotionals, see: How Whitepages turned the phone book into a graph using Titan and Cassandra. BTW, the Whitepages offer an API for email verification.

Don’t be the last one to submit a bug for this milestone release!

At the same time, checkout the Whitepages API.

November 27, 2014

A Docker Image for Graph Analytics on Neo4j with Apache Spark GraphX

Filed under: Graphs,GraphX,Neo4j,Spark — Patrick Durusau @ 8:20 pm

A Docker Image for Graph Analytics on Neo4j with Apache Spark GraphX by Kenny Bastani.

From the post:

I’ve just released a useful new Docker image for graph analytics on a Neo4j graph database with Apache Spark GraphX. This image deploys a container with Apache Spark and uses GraphX to perform ETL graph analysis on subgraphs exported from Neo4j. This docker image is a great addition to Neo4j if you’re looking to do easy PageRank or community detection on your graph data. Additionally, the results of the graph analysis are applied back to Neo4j.

This gives you the ability to optimize your recommendation-based Cypher queries by filtering and sorting on the results of the analysis.

This rocks!

If you were looking for an excuse to investigate Docker or Spark or GraphX or Neo4j, it has arrived!

Enjoy!

November 26, 2014

Neo4j 2.1.6 (release)

Filed under: Graphs,Neo4j — Patrick Durusau @ 8:15 pm

Neo4j 2.1.6 (release)

From the post:

Neo4j 2.1.6 is a maintenance release, with critical improvements.

Notably, this release:

  • Resolves a critical shutdown issue, whereby IO errors were not always handled correctly and could result in inconsistencies in the database due to failure to flush outstanding changes.
  • Significantly reduce the file handle requirements for the lucene based indexes.
  • Resolves an issue in consistency checking, which could falsely report store inconsistencies.
  • Extends the Java API to allow the degree of a node to be easily obtained (the count of relationships, by type and direction).
  • Resolves a significant performance degradation that affected the loading of relationships for a node during traversals.
  • Resolves a backup issue, which could result in a backup store that would not load correctly into a clustered environment (Neo4j Enterprise).
  • Corrects a clustering issue that could result in the master failing to resume its role after an outage of a majority of slaves (Neo4j Enterprise).

All Neo4j 2.x users are recommended to upgrade to this release. Upgrading to Neo4j 2.1, from Neo4j 1.9.x or Neo4j 2.0.x, requires a migration to the on-disk store and can not be reversed. Please ensure you have a valid backup before proceeding, then use on a test or staging server to understand any changed behaviors before going into production.

Neo4j 1.9 users may upgrade directly to this release, and are recommended to do so carefully. We strongly encourage verifying the syntax and validating all responses from your Cypher scripts, REST calls, and Java code before upgrading any production system. For information about upgrading from Neo4j 1.9, please see our Upgrading to Neo4j 2 FAQ.

For a full summary of changes in this release, please review the CHANGES.TXT file contained within the distribution.

Downloads

As with all software upgrades, do not delay until the day before you are leaving on holiday!

November 25, 2014

Bye-bye Giraph-Gremlin, Hello Hadoop-Gremlin with GiraphGraphComputer Support

Filed under: Graphs,Gremlin,TinkerGraph — Patrick Durusau @ 7:56 pm

Bye-bye Giraph-Gremlin, Hello Hadoop-Gremlin with GiraphGraphComputer Support by Marko A. Rodriguez.

There are days when I wonder if Marko ever sleeps or if the problem of human cloning has already been solved.

This is one of those day:

The other day Dan LaRocque and I were working on a Hadoop-based GraphComputer for Titan so we could do bulk loading into Titan. First we wrote the BulkLoading VertexProgram:
https://github.com/thinkaurelius/titan/blob/titan09/titan-core/src/main/java/com/thinkaurelius/titan/graphdb/tinkerpop/computer/ bulkloader/BulkLoaderVertexProgram.java
…and then realized, “huh, we can just execute this with GiraphGraph. Huh! We can just execute this with TinkerGraph!” In fact, as a side note, the BulkLoaderVertexProgram is general enough to work for any TinkerPop Graph.
https://github.com/tinkerpop/tinkerpop3/issues/319

So great, we can just use GiraphGraph (or any other TinkerPop implementation that has a GraphComputer (e.g. TinkerGraph)). However, Titan is all about scale and when the size of your graph is larger than the total RAM in your cluster, we will still need a MapReduce-based GraphComputer. Thinking over this, it was realized: Giraph-Gremlin is very little Giraph and mostly just Hadoop — InputFormats, HDFS interactions, MapReduce wrappers, Configuration manipulations, etc. Why not make GiraphGraphComputer just a particular GraphComputer supported by Gremlin-Hadoop (a new package).

With that, Giraph-Gremlin no longer exists. Hadoop-Gremlin now exists. Hadoop-Gremlin behaves the exact same way as Giraph-Gremlin, save that we will be adding a MapReduceGraphComputer to Hadoop-Gremlin. In this way, Hadoop-Gremlin will support two GraphComputer: GiraphGraphComputer and MapReduceGraphComputer.

http://www.tinkerpop.com/docs/3.0.0-SNAPSHOT/#hadoop-gremlin

The master/ branch is updated and the docs for Giraph have been re-written, though I suspect there will be some dangling references in the docs here and there for a while.

Up next, Matthias and I will create MapReduceGraphComputer that is smart about “partitioned vertices” — so you don’t get the Faunus scene where if a vertex doesn’t fit in memory, an exception. This will allow vertices with as many edges as you want (though your data model is probably shotty if you have 100s of millions of edges on one vertex šŸ˜‰ ā€¦ā€¦ā€¦ā€¦ā€¦ā€¦.. Matthias will be driving that effort and I’m excited to learn about the theory of vertex partitioning (i.e. splitting a single vertex across machines).

Enjoy!

November 22, 2014

Using Load CSV in the Real World

Filed under: CSV,Graphs,Neo4j — Patrick Durusau @ 11:23 am

Using Load CSV in the Real World by Nicole White.

From the description:

In this live-coding session, Nicole will demonstrate the process of downloading a raw .csv file from the Internet and importing it into Neo4j. This will include cleaning the .csv file, visualizing a data model, and writing the Cypher query that will import the data. This presentation is meant to make Neo4j users aware of common obstacles when dealing with real-world data in .csv format, along with best practices when using LOAD CSV.

A webinar with substantive content and not marketing pitches! Unusual but it does happen.

A very good walk through importing a CSV file into Neo4j, with some modeling comments along the way and hints of best practices.

The “next” thing for users after a brief introduction to graphs and Neo4j.

The experience will build their confidence and they will learn from experience what works best for modeling their data sets.

November 21, 2014

Big bang of npm

Filed under: Graphs,Visualization — Patrick Durusau @ 2:17 pm

Big bang of npm

From the webpage:

npm is the largest package manager for javascript. This visualization gives you a small spaceship to explore the universe from inside. 106,317 stars (packages), 235,887 connections (dependencies).

Use WASD keys to move around. If you are browsing this with a modern smartphone – rotate your device around to control the camera (WebGL is required).

Navigation and other functions weren’t intuitive, at least not to me:

W – zooms in.

A – pans left.

S – zooms out.

D – pans right.

L – toggles links.

Choosing dependencies or dependents (lower left) filters the current view to show only dependencies or dependents of the chosen package.

Choosing a package name on lower left take you to the page for that package.

Search box at the top has a nice drop down of possible matches and displays dependencies or dependents by name, when selected below.

I would prefer more clues on the main display but given the density of the graph, that would quickly render it unusable.

Perhaps a way to toggle package names when displaying only a portion of the graph?

Users would have to practice with it but this technique could be very useful for displaying dense graphs. Say a map of the known contributions by lobbyists to members of Congress for example. šŸ˜‰

I first saw this in a tweet by Lincoln Mullen.

« Newer PostsOlder Posts »

Powered by WordPress