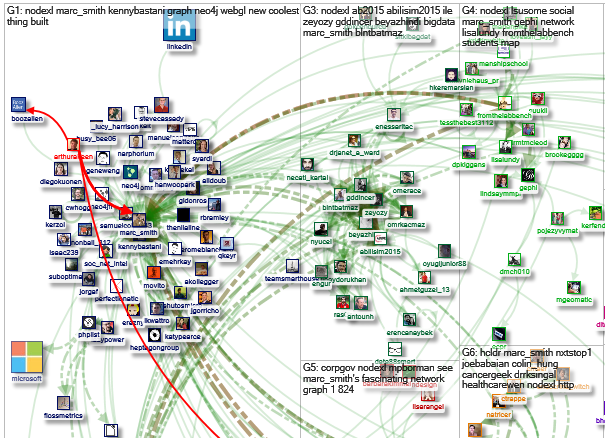
This only part of a graph visualization that you will find at: http://nodexlgraphgallery.org/Pages/Graph.aspx?graphID=39261. The visualization was produced by Marc Smith.
I first saw this mentioned in a tweet by Kenny Bastani.
With only two hundred and fifty-six nodes and five hundred and fifty-two unique edges, you can start to see some of the problems with graph visualization.
Can you visually determine the top ten (10) nodes in this display?
The more complex the graph, the harder it will be in some cases to visually evaluate the graph. Citation graphs for example, will exhibit recognizable clusters even if the graph is very “busy.” On the other hand, if you are seeking links between individuals, some connections are likely to be lost in the noise.
Without losing each node’s integrity as individual nodes, do you know of techniques to treat nodes as components of a larger node so that the larger nodes behavior in the visualization is determined by the “sub-“nodes it contains? Thinking of it as a way to “summarize” the data of the individual nodes and keep them in play for a visualization.
When interesting behavior is exhibited, the virtual node could be expanded and the relationships refined based on the nodes within.