Another Word For It Patrick Durusau on Topic Maps and Semantic Diversity

May 27, 2014

3D Printed Hypercube of Monkeys

Filed under: Graphics,Hyperspace,Visualization — Patrick Durusau @ 4:25 pm

Nothing is more fun than a 3D printed hypercube of monkeys

From the post:

The quaternion group {1,i,j,k,-1,-i,-j,-k} is a beautiful group of order eight. It didn’t have a physical representation because the object should be 4-dimensional. But has the quaternion group ever appeared as the symmetry group of an object? The answer is yes. In order to visualize the symmetries of the quaternion group, mathematician Henry Segerman, sculptor Will Segerman and mathemusician Vi Hart have designed a four-dimensional object, a hypercube, and put a monkey at the center of each of the eight cubes.

If that doesn’t sound interesting enough, the post also has an animated image of the monkeys emerging from the 4th dimension, a video on “…how to make sculptures of 4D things,” and a pointer to: The Quaternion Group as a Symmetry Group.

Displaying countries in different perspectives impacts your perception of a map. Imagine the impact of emerging from the 4th dimension.

I first saw this in a tweet by Stefano Bertolo.

May 20, 2014

Elm 0.12.3

Filed under: Elm,Graphics,Visualization — Patrick Durusau @ 3:06 pm

Elm 0.12.3: Hardware accelerated 3D rendering with WebGL

From the post:

Elm now supports 3D rendering with WebGL! Huge thank you to John P. Mayer for designing and implementing such a simple API for this. It has been really fun to work with so far and we are excited to see what people can do with it!

This is the first public exploration of using alternate renders with Elm. Our goal is to be great for all kinds of UI tasks, so 3D is just the first step on the road to more traditional renderers such as the D3 backend for Elm. Future exploration will focus on more traditional kinds of UI, all super easy to embed as a component in an existing JS app.

This release also comes with some changes to the Color library, making it easier to create colors programmatically. The initial motivation was to make Color play nice with WebGL, but the library came out a lot friendlier to use in general.

If you want to become a functional programming shop, use Elm to experiment with 3D UI components. Or UIs in general for that matter.

I first saw this in a tweet by Paul Smith.

April 19, 2014

Visual Programming Languages – Snapshots

Filed under: Graphics,Programming,Visualization — Patrick Durusau @ 2:03 pm

Visual Programming Languages – Snapshots by Eric Hosick.

If you are interested in symbolic topic map authoring or symbolic authoring for other purposes, this a a must-see site for you!

Eric has collected (as of today) one-hundred and forty (140) examples of visual programming languages.

I am sure there are some visualization techniques that were not used in these examples but offhand, I can’t say which ones. 😉

Definitely a starting point for any new visual interfaces.

April 15, 2014

Enter, Update, Exit… [D3.js]

Filed under: D3,Graphics,Visualization — Patrick Durusau @ 7:49 pm

Enter, Update, Exit – An Introduction to D3.js, The Web’s Most Popular Visualization Toolkit by Christian Behrens.

From the webpage:

Over the past couple of years, D3, the groundbreaking JavaScript library for data-driven document manipulation developed by Mike Bostock, has become the Swiss Army knife of web-based data visualization. However, talking to other designers or developers who use D3 in their projects, I noticed that one of the core concepts of it remains somewhat obscure and is often referred to as »D3’s magic«: Data joins and selections.

Given a solid command of basic JavaScript, this article should help you to wrap your head around these two fundamental concepts and get you started using D3 for your dataviz projects.

If you encounter anyone not already using D3.js, pass this page along to them.

I first saw this in a tweet by Halftone.

April 9, 2014

Scaling Graphs

Filed under: Graphics,Humor — Patrick Durusau @ 4:28 pm

Fox News

If you ever wonder why your data stream is “dirty,” I have an explanation.

I first saw this in a tweet by Scott Chamberlain.

April 5, 2014

Formatting Affects Perception?

Filed under: Graphics,Visualization — Patrick Durusau @ 7:08 pm

Before you jump to this link by Ed H. Chi, how would you answer the question:

Does table formatting affect your perception of a table?

The equivalent of “data is data” I suppose.

This is not a one-off example. The same answer is true for any other data set.

How’s your presentation of data?

April 1, 2014

…Browser History as a Favicon Tapestry (NSFW?)

Filed under: Graphics,Visualization — Patrick Durusau @ 2:47 pm

Browser Plugin Maps Your Browser History as a Favicon Tapestry by Andrew Vande Moere.

From the post:

iconic history

Iconic History [shan-huang.com] by Carnegie Mellon University interaction design student Shan Huang is as simple as it is beautifully revealing.

See Andrew’s post for more details.

Depending on the websites you visit and their favicons, this may or may not be safe for work.

As a visualization it makes me curious, what if you could track the “focus” of applications in use so a similar display could be generated for the apps you use in a day, a week, etc.?

Would bring new meaning to the question: What have you been working on today? 😉

March 25, 2014

Shadow DOM

Filed under: CSS3,Graphics,HTML,Visualization,XML — Patrick Durusau @ 3:15 pm

Shadow DOM by Steven Wittens.

From the post:

For a while now I’ve been working on MathBox 2. I want to have an environment where you take a bunch of mathematical legos, bind them to data models, draw them, and modify them interactively at scale. Preferably in a web browser.

Unfortunately HTML is crufty, CSS is annoying and the DOM’s unwieldy. Hence we now have libraries like React. It creates its own virtual DOM just to be able to manipulate the real one—the Agile Bureaucracy design pattern.

The more we can avoid the DOM, the better. But why? And can we fix it?
….

One of the better posts on markup that I have read in a very long time.

Also of interest, Steven’s heavy interest in graphics and visualization.

His MathBox project for example.

March 21, 2014

D3.js, Three.js and CSS 3D Transforms

Filed under: CSS3,D3,Graphics,Three.js,Visualization — Patrick Durusau @ 9:28 am

D3.js, Three.js and CSS 3D Transforms by Steve Hall.

From the post:

This week I have been having some fun thinking about how you could use D3.js and Three.js together to do some data visualization work. We’ll have to put this one in the experimental column since there is a lot more work to be done, but I was pretty pleased with the results and thought I would blog about what I have done up to this point. While there are plenty of dramatic examples of three.js used to generate 3D globes with lines shooting everywhere, I was interested in a more subtle approach to complement work in D3. I would be curious to hear about other experiments going on along the same lines. A Google search didn’t turn up much.

The following example is using D3 to generate HTML elements and SVG charts and also to store coordinate information for transitions inside data properties. The objects created using D3 are then passed into a three.js scene and animated using CSS 3D transforms (no WebGL here, this is pure DOM).

You really need to run the full demo on a large, high-res monitor.

Wicked cool!

Definitely raises the bar for data visualization!

The only downside being you will be expected to find clever 3D ways to visualize data. Way more complicated than the visualization itself.

March 10, 2014

The Elements According to Relative Abundance

Filed under: Graphics,Visualization — Patrick Durusau @ 1:44 pm

The Elements According to Relative Abundance (A Periodic Chart by Prof. Wm. F. Sheehan, University of Santa Clara. CA 95053. Ref. Chemistry. Vol. 49.No.3. p. 17-18, 1976)

From the caption:

Roughly, the size of an element’s own niche is proportioned to its abundance on Earth’s surface, and in addition, certain chemical similarities.

Very nice.

A couple of suggestions for the graphically inclined:

  • How does a proportionate periodic table of your state (in the United States, substitute other appropriate geographic subdivisions if outside the United States) compare to other states?
  • Adjust your periodic table to show the known elements at important dates in history.

I first saw this in a tweet by Maxime Duprez.

March 9, 2014

IMDB Top 100K Movies Analysis in Depth (Parts 1- 4)

Filed under: Graphics,IMDb,Visualization — Patrick Durusau @ 2:27 pm

IMDB Top 100K Movies Analysis in Depth Part 1 by Bugra Akyildiz.

IMDB Top 100K Movies Analysis in Depth Part 2

IMDB Top 100K Movies Analysis in Depth Part 3

IMDB Top 100K Movies Analysis in Depth Part 4

From part 1:

Data is from IMDB and it includes all of the popularly voted 100042 movies from 1950 to 2013.(I know why 100000 is there but have no idea how 42 movies get squeezed. Instead of blaming my web scraping skills, I blame the universe, though).

The reason why I chose the number of votes as a metric to order the movies is because, generally the information (title, certificate, outline, director and so on) about movie are more likely to be complete for the movies that have high number of votes. Moreover, IMDB uses number of votes as a metric to determine the ranking as well so number of votes also correlate with the rating as well. Further, everybody at least has an idea on IMDB Top 250 or IMDB Top 1000 which are ordered by the ratings computed by IMDB.

Although the data is quite rich in terms of basic information, only year, rating and votes are complete for all of the movies. Only ~80% of the movies have runtime information(minutes). The categories are mostly 90% complete which could be considered good but the certificate information of the movies is the most sparse (only ~25% of them have it).

This post aims to explore data for diffferent aspects of data(categories, rating and categories) and also useful information(best movie in terms of rating or votes for each year).

An interesting analysis of the Internet Movie Database (IMDB) that incorporates other sources, such as for revenue and actors’ and actresses’ age and height information.

Suggestions on other data to include or representation techniques?

I first saw this in a tweet by Gregory Piatetsky.

March 4, 2014

Lyra Gets its First Visualization Tutorial

Filed under: Graphics,Lyra,Visualization — Patrick Durusau @ 3:48 pm

Lyra Gets its First Visualization Tutorial by Bryan Connor.

From the post:

Before the demo session even began, Tapestry was humming with talk of “Lyra.” A group gathered around Arvind Satyanarayan as he took us for a spin around the tool he helped developed at UW Interactive Data Lab.

It’s just a few day later and the tool’s open source code is up on Github. You can run the app yourself in the browser and now the first tutorial about Lyra has been written.

Jim Vallandingham’s Lyra tutorial is naturally a tentative investigation of an app that is in early alpha. It does a fantastic job of teasing apart the current features of Lyra and making predictions about how it can be used in the future. Some sections are highlighted below.

You will also want to visit:

The Lyra Visualization Design Environment (VDE) alpha by Arvind Satyanarayan, Kanit “Ham” Wongsuphasawat, Jeffrey Heer.

playfair
William Playfair’s classic chart comparing the price of wheat and wages in England recreated in the Lyra VDE.

Lyra is an interactive environment that enables custom visualization design without writing any code. Graphical “marks” can be bound to data fields using property drop zones; dynamically positioned using connectors; and directly moved, rotated, and resized using handles. Lyra also provides a data pipeline interface for iterative visual specification of data transformations and layout algorithms. Lyra is more expressive than interactive systems like Tableau, allowing designers to create custom visualizations comparable to hand-coded visualizations built with D3 or Processing. These visualizations can then be easily published and reused on the Web.

This looks very promising!

February 28, 2014

Cool Infographics: Best Practices Group on LinkedIn

Filed under: Graphics,Visualization — Patrick Durusau @ 7:27 pm

Cool Infographics: Best Practices Group on LinkedIn by Randy Krum.

From the post:

I am excited to announce the launch of a new LinkedIn Group, Cool Infographics: Best Practices. I have personally been a part of many great discussion groups over the years and believe that this group fills an unmet need. Please accept this invitation to join the group to share your own experiences and wisdom.

There are many groups that share infographics, but I felt that a discussion group dedicated to the craft of infographics and data visualization was missing. This group will feature questions and case studies about how companies are leveraging infographics and data visualization as a communication tool. Any posts that are just links to infographics will be moderated to keep the focus on engaging discussions. Topics and questions from the Cool Infographics book will also be discussed.

Join us in a professional dialogue surrounding case studies and strategies for designing infographics and using them as a part of an overall marketing strategy. We welcome both beginning and established professionals to share valuable tactics and experiences as well as fans of infographics to learn more about this growing field.

Anyone with a drawing program can create an infographic.

This group is where you may learn to make “cool” infographics.

Think of it as the difference between failing to communicate and communicating.

If you are trying to market an idea, a service or a product, the latter should be your target.

February 27, 2014

Fractals in D3: Dragon Curves

Filed under: Fractals,Graphics — Patrick Durusau @ 5:23 pm

Fractals in D3: Dragon Curves by Stephen Hall.

From the post:

Dragon fractal

This week I am continuing to experiment with rendering fractals in D3. In this post we’re looking at examples of generating some really cool fractals called dragon curves (also referred to as Heighway dragons). This post is a continuation of the previous one on fractal ferns. Take a look at that post if you want some basic info on fractals and some links I found useful. Fractals are a world unto themselves, so there are plenty of interesting things to be investigated in this area. We are just scratching the surface with these two posts.

Great images, complete with source code and explanation.

See the Fractal entry at Wikipeida for more links on fractals.

February 23, 2014

…Into Dreamscapes

Filed under: Communication,Graphics,Visualization — Patrick Durusau @ 10:43 am

A Stunning App That Turns Radiohead Songs Into Dreamscapes by Liz Stinson.

From the post:

There’s something about a good Radiohead song that lets your mind roam. And if you could visualize what a world in which Radiohead were the only soundtrack, it would look a lot like the world Universal Everything created for the band’s newly released app PolyFauna (available on iOS and Android). Which is to say, a world that’s full of cinematic landscapes and bizarre creatures that only reside in our subconscious minds.

“I got an email out of nowhere from Thom [Yorke], who’d seen a few projects we’d done,” says Universal Everything founder Matt Pyke. Radiohead was looking to design a digital experience for its 2011 King of Limbs session that departed from the typical music apps available, which tend to put emphasis on discography or tour dates. Instead, the band wanted an audio/visual piece that was more digital art than serviceable app.

Pyke met with Yorke and Stanley Donwood, the artist who’s been responsible for crafting Radiohead’s breed of peculiar, moody aesthetics. “We had a really good chat about how we could push this into a really immersive atmospheric audio/visual environment,” says Pyke. What they came up with was PolyFauna, a gorgeously weird interactive experience based on the skittish beats and melodies of “Bloom,” the first track off of King of Limbs.

Does this suggest a way to visualize financial or business data? Everyone loves staring at rows and rows of spreadsheet numbers, but just for a break, what if you visualized the information corridors for departments in an annual (internal) report? Where each corridors is as wide or narrow as access by other departments to their data?

Or approval processes where gate-keepers are trolls by bridges?

I wouldn’t do an entire report that way but one or two slide or two images could leave a lasting impression.

Remembering the more powerfully you communicate information, the more powerful the information becomes.

February 19, 2014

Diagrams 1.0

Filed under: Graphics,Haskell — Patrick Durusau @ 9:16 pm

Diagrams 1.0 by Brent Yorgey.

From the post:

The diagrams team is very pleased to announce the 1.0 release of diagrams, a framework and embedded domain-specific language for declarative drawing in Haskell. Check out the gallery for some examples of what it can do. Diagrams can be used for a wide range of purposes, from data visualization to illustration to art, and diagrams code can be seamlessly embedded in blog posts, LaTeX documents, and Haddock documentation, making it easy to incorporate diagrams into your documents with minimal extra work.

….

Since we were talking about graphics, this seems to fit in well.

OK, one image and then you have to see Brent’s post for the rest:

knight's tour

Brent lists videos, slides, tutorials and guides.

Visualization Course Diary

Filed under: Graphics,Visualization — Patrick Durusau @ 9:06 pm

Enrico Bertini is keeping a course diary for his Information Visualization course at NYU. As he describes it:

Starting from this week and during the rest of the semester I will be writing a new series called “Course Diary” where I report about my experience while teaching Information Visualization to my students at NYU. Teaching to them is a lot of fun. They often challenge me with questions and comments which force me to think more deeply about visualization. Here I’ll report about some of my experiences and reflections on the course.

Start at the beginning: Course Diary #1: Basic Charts

If you teach or aspire to teach (well) this will be a lot of fun for you!

February 16, 2014

Data as Magic?

Filed under: Data,Graphics — Patrick Durusau @ 7:52 pm

An example of why data will not end debate by Kaiser Fung.

From the post:

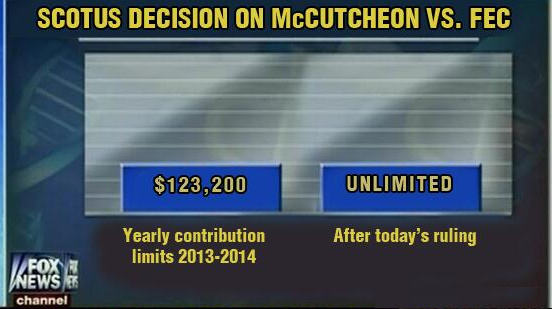
One oft-repeated “self-evident” tenet of Big Data is that data end all debate. Except if you have ever worked for a real company (excluding those ruled by autocrats), and put data on the table, you know that the data do not end anything.

Reader Ben M. sent me to this blog post by Benedict Evans, showing a confusing chart showing how Apple has “passed” Microsoft. Evans used to be a stock analyst before moving to Andreessen Horowitz, a VC (venture capital) business. He has over 25,000 followers on Twitter.
….

Evans responded to many of these comments by complaining that readers are not getting his message. That’s an accurate statement, and it has everything to do with the looseness of his data. This reminds me of Gelman’s statistical parable. The blogger here is not so much interested in how strong his evidence is but more interested in evangelizing the morale behind the story.

A highly entertaining post as always.

Gelman’s “statistical parable” is used for stories that cite numbers that if you think about them, are quite unreasonable. Gelman’s example case was statistics on death rates that put 1/4 of the death rate at a hospital as due to record keeping errors. Probably not true.

The point being that people bolster a narrative with numbers in the interest of advancing the story, with little concern for the “accuracy” of the numbers.

Other examples include: RIAA numbers on musical piracy, software piracy, OMB budget numbers, TSA terrorist threat numbers, etc.

I put “accuracy” in quotes because recognizing a “statistical parable” depends on where you sit. If you are on the side with shaky numbers, the question of accuracy is an annoying detail. If you oppose the side with shaky numbers, it is evidence they can’t make a case without manufactured evidence.

I take Kaiser’s point to be data is not magic. Even strong (in some traditional sense) data is not magic.
.
Data is at best one tool of persuasion that you can enlist for your cause, whatever that may be. Ignore other tools of persuasion at your own peril.

February 15, 2014

MPLD3…

Filed under: D3,Graphics,Python-Graph,Visualization — Patrick Durusau @ 11:33 am

MPLD3: Bringing Matplotlib to the Browser

From the webpage:

The mpld3 project brings together Matplotlib, the popular Python-based graphing library, and D3js, the popular Javascript library for creating data-driven web pages. The result is a simple API for exporting your matplotlib graphics to HTML code which can be used within the browser, within standard web pages, blogs, or tools such as the IPython notebook.

See the Example Gallery or Notebook Examples for some interactive demonstrations of mpld3 in action.

For a quick overview of the package, see the Quick Start Guide.

Being a “text” person, I have to confess a fondness for the HTML tooltip plugin.

Data is the best antidote for graphs with labeled axes but no metrics and arbitrary placement of competing software packages.

Some people call that marketing. I prefer the older term, “lying.”

February 14, 2014

Inline Visualization with D3.js

Filed under: D3,Graphics,Visualization — Patrick Durusau @ 4:42 pm

Inline Visualization with D3.js by Muyueh Lee.

From the post:

Sparkline is an inline visualization that fits nicely within the text. Tufte described it as “data-intense, design-simple, word-sized graphics.” It’s especially useful, so when you have to visualize a list of items, you can list them in a column, where it’s very easy to compare different data (small-multiple technique).

sparkline

I was wondering, however, if there is some other form of inline visualization?

The post walks through how to represent complex numeric import/export data using inline visualization. Quite good. http://muyueh.com/30/imexport/summary/

If you are seriously interested in D3, check out 30D of D3. You won’t be disappointed.

I first saw this in a tweet by DashingD3js.com.

February 13, 2014

Conditional probability

Filed under: Graphics,Probability,Visualization — Patrick Durusau @ 8:38 pm

Conditional probability by Victor Powell.

From the post:

A conditional probability is the probability of an event, given some other event has already occurred. In the below example, there are two possible events that can occur. A ball falling could either hit the red shelf (we’ll call this event A) or hit the blue shelf (we’ll call this event B) or both.

Just in terms of visualization prowess, you need to see Victor’s post.

February 11, 2014

Scalable Vector Graphics (SVG) 2

Filed under: Graphics,SVG — Patrick Durusau @ 1:46 pm

Scalable Vector Graphics (SVG) 2

Abstract:

This specification defines the features and syntax for Scalable Vector Graphics (SVG) Version 2, a language for describing two-dimensional vector and mixed vector/raster graphics. Although an XML serialization is given, processing is defined in terms of a DOM.

Changes from SVG 1.1 Second Edition.

No time like the present to start learning about the next version of SVG!

Not to mention that your comments may contribute to the style and/or substance of a standard we will all be using sooner than later.

February 8, 2014

Visualizing History

Filed under: Charts,Graphics,Visualization — Patrick Durusau @ 3:25 pm

Visualizing History by Ben Jones.

From the post:

When studying history, we ask questions of the past, seeking to understand what happened in the lives of the people who have gone before us, and why. A data visualization of history suggests and answers a thousand questions. Sometimes, the value in a chart or graph of history is that it proposes new questions to ask of the past, questions that we wouldn’t have thought to ask unless the information were presented to us in a visual way.

Ben makes imaginative use of Gantt charts to illustrate:

  • American Presidencies
  • History of Civilizations
  • History of the Patriarchs
  • Political History (scandal)
  • and others.

I have always thought of Gantt charts as useful for projects, etc., but they work well in other contexts as well.

Not as flashy as some charts, but also less difficult to interpret.

January 30, 2014

The Data Visualization Catalogue

Filed under: Graphics,Visualization — Patrick Durusau @ 8:57 pm

The Data Visualization Catalogue by Drew Skau.

From the post:

If you’ve ever struggled with what visualization to create to best show the data you have, The Data Visualization Catalogue might provide just the help you need.

Severino Ribecca has begun the process of categorizing data visualizations based on what relationships and properties of data that they show. With 54 visualizations currently slated to be categorized, the catalog aims to be a comprehensive list of visualizations, searchable by what you want to show.

Just having a quick reference to the different visualization types is helpful by itself. The details make it even more helpful.

Resources for learning D3.js

Filed under: D3,Graphics,Visualization — Patrick Durusau @ 11:45 am

Resources for learning D3.js

Nineteen “pinned” resources.

Capabilities of D3.js?

The TweetMap I mentioned yesterday uses D3.js.

Other questions about the capabilities of D3.js?

January 28, 2014

Visualization of Narrative Structure

Filed under: Graphics,Narrative,Visualization — Patrick Durusau @ 3:49 pm

Visualization of Narrative Structure. Created by Natalia Bilenko and Asako Miyakawa.

From the webpage:

Can books be summarized through their emotional trajectory and character relationships? Can a graphic representation of a book provide an at-a-glance impression and an invitation to explore the details?

We visualized character interactions and relative emotional content for three very different books: a haunting memory play, a metaphysical mood piece, and a children’s fantasy classic. A dynamic graph of character relationships displays the evolution of connections between characters throughout the book. Emotional strength and valence of each sentence are shown in a color-coded sentiment plot. Hovering over the sentence bars reveals the text of the original sentences. The emotional path of each character through the book can be traced by clicking on the character names in the graph. This highlights the corresponding sentences in the sentiment plot where that character appears. Click on the links below to see each visualization.

Best viewed in Google Chrome at 1280×800 resolution.

Visualizations of:

The Hobbit by J.R.R. Tolkien.

Kafka on the shore by Haruki Murakami.

The Glass Menagerie by Tennessee Williams.

Reading of any complex narrative would be enhanced by the techniques used here.

I first saw this in a tweet by Christophe Viau.

January 20, 2014

Timeline of the Far Future

Filed under: Graphics,History,Timelines,Visualization — Patrick Durusau @ 6:37 pm

Timeline of the Far Future Randy Krum.

Randy has uncovered a timeline from the BBC that predicts the future in 1,000, 10,000, one million years and beyond.

It’s big and will take time to read.

I suspect the accuracy of the predictions are on par with a similar time line pointing backwards. 😉

But it’s fun to speculate about history, past, future, alternative, or fantasy histories.

January 19, 2014

10 Awesome Google Chrome Experiments

Filed under: Graphics,Visualization — Patrick Durusau @ 9:16 pm

10 Awesome Google Chrome Experiments

From the post:

With the coming of 2014, it is quite evident in the market that there is a huge need for innovation in the field of technology. The field of technology as in this case includes a lot of things like the process of doing the things and the way the output is extracted. Most of the economic giants are of the idea that now is the time when we should actually be looking to invest and develop new things such that there is no problem in the coming years. When asked about the problems that one might face, the most common answer was that if the technology is not advanced there will be no increase in the revenue. Well, this might just bring in a bit of thoughts in the minds of bloggers.

Although there is no requirement to be worried about because of the fact that in case of blogging the utmost creativity lies in the field of the articles that you write and the design that you maintain. Thus it becomes important a topic enough to think about making some improvement in the designs that you put in and the quality that you maintain. Now if the main area of your concern is in the field of designing then there are many online tutorials and tools that can help you to sort out your problems. To add to this the extravagant coding language like HTML5 and CSS3 will surely help you out in your area of concern. Considering the possible extent of the two languages, it is highly advisable to start developing the knowledge related to them with some real care!

But not all the people are too much interested in giving the hell lot of efforts in the region. Well, frankly speaking there is actually no shortcut to success and thus considering the statement you will have to do it the correct way. If you are looking for help that the Google Chrome Experiments is one of the best places to give a visit in the times of need! Google Chrome Experiments are the places that harbors the best designers of the world and believe me when I say that is one of the perfect places to be a part of if you are really in some moods to learn new things about designing. The place remains constantly updated with excellent things to know about and work with. You can also share your thoughts and look for the answers of your queries.

Some eye candy to start the work week!

January 15, 2014

D3 – Cheatsheet (correction)

Filed under: D3,Graphics,Visualization — Patrick Durusau @ 7:31 pm

D3 – Cheatsheet

Scott Murray (@alignedleft) has corrected a typo in the Array.push() example.

You might want to grab a new copy.

What’s Hiding In Your Classification System?

Filed under: Classification,Graphics,Patents,Visualization — Patrick Durusau @ 5:10 pm

Patent Overlay Mapping: Visualizing Technological Distance by Luciano Kay, Nils Newman, Jan Youtie, Alan L. Porter, Ismael Rafols.

Abstract:

This paper presents a new global patent map that represents all technological categories, and a method to locate patent data of individual organizations and technological fields on the global map. This overlay map technique may support competitive intelligence and policy decision-making. The global patent map is based on similarities in citing-to-cited relationships between categories of theInternational Patent Classification (IPC) of European Patent Office (EPO) patents from 2000 to 2006. This patent dataset, extracted from the PATSTAT database, includes 760,000 patent records in 466 IPC-based categories. We compare the global patent maps derived from this categorization to related efforts of other global patent maps. The paper overlays nanotechnology-related patenting activities of two companies and two different nanotechnology subfields on the global patent map. The exercise shows the potential of patent overlay maps to visualize technological areas and potentially support decision-making. Furthermore, this study shows that IPC categories that are similar to one another based on citing-to-cited patterns (and thus are close in the global patent map) are not necessarily in the same hierarchical IPC branch, thus revealing new relationships between technologies that are classified as pertaining to different (and sometimes distant) subject areas in the IPC scheme.

The most interesting discovery in the paper was summarized as follows:

One of the most interesting findings is that IPC categories that are close to one another in the patent map are not necessarily in the same hierarchical IPC branch. This finding reveals new patterns of relationships among technologies that pertain to different (and sometimes distant) subject areas in the IPC classification. The finding suggests that technological distance is not always well proxied by relying on the IPC administrative structure, for example, by assuming that a set of patents represents substantial technological distance because the set references different IPC sections. This paper shows that patents in certain technology areas tend to cite multiple and diverse IPC sections.

That being the case, what is being hidden in other classification systems?

For example, how does the ACM Computing Classification System compare when the citations used by authors are taken into account?

Perhaps this is a method to compare classifications as seen by experts versus a community of users.

BTW, the authors have posted supplemental materials online:

Supplementary File 1 is an MS Excel file containing the labels of IPC categories, citation and similarity matrices, factor analysis of IPC categories. It can be found at: http://www.sussex.ac.uk/Users/ir28/patmap/KaySupplementary1.xls

Supplementary File 2 is an MS PowerPoint file with examples of overlay maps of firms and research topics. It can be found at: http://www.sussex.ac.uk/Users/ir28/patmap/KaySupplementary2.ppt

Supplementary File 3 is an interactive version of map in Figure 1visualized with the freeware VOSviewer. It can be found at: http://www.vosviewer.com/vosviewer.php?map=http://www.sussex.ac.uk/Users/ir28/patmap/KaySupplementary3.txt

« Newer PostsOlder Posts »

Powered by WordPress