Inline Visualization with D3.js by Muyueh Lee.
From the post:
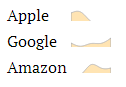
Sparkline is an inline visualization that fits nicely within the text. Tufte described it as “data-intense, design-simple, word-sized graphics.” It’s especially useful, so when you have to visualize a list of items, you can list them in a column, where it’s very easy to compare different data (small-multiple technique).
I was wondering, however, if there is some other form of inline visualization?
The post walks through how to represent complex numeric import/export data using inline visualization. Quite good. http://muyueh.com/30/imexport/summary/
If you are seriously interested in D3, check out 30D of D3. You won’t be disappointed.
I first saw this in a tweet by DashingD3js.com.