Another Word For It Patrick Durusau on Topic Maps and Semantic Diversity

January 25, 2015

Introducing Espresso – LinkedIn’s hot new distributed document store

Filed under: Expresso,Oracle,Voldemort — Patrick Durusau @ 8:13 pm

Introducing Espresso – LinkedIn’s hot new distributed document store by Aditya Auradkar.

From the post:

Espresso is LinkedIn’s online, distributed, fault-tolerant NoSQL database that currently powers approximately 30 LinkedIn applications including Member Profile, InMail (LinkedIn’s member-to-member messaging system), portions of the Homepage and mobile applications, etc. Espresso has a large production footprint at LinkedIn with over a dozen clusters in use. It hosts some of the most heavily accessed and valuable datasets at LinkedIn serving millions of records per second at peak. It is the source of truth for hundreds of terabytes (not counting replicas) of data.

Motivation

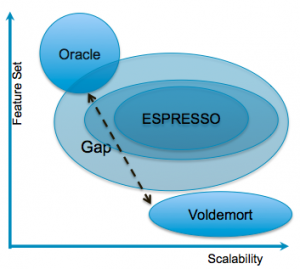
To meet the needs of online applications, LinkedIn traditionally used Relational Database Management Systems (RDBMSs) such as Oracle and key-value stores such as Voldemort – both serving different use cases. Much of LinkedIn requires a primary, strongly consistent, read/write data store that generates a timeline-consistent change capture stream to fulfill nearline and offline processing requirements. It has become apparent that many, if not most, of the primary data requirements of LinkedIn do not require the full functionality of monolithic RDBMSs, nor can they justify the associated costs.

Expresso-Features

A must read if you are concerned with BigData and/or distributed systems.

A refreshing focus on requirements, as opposed to engineering by slogan, “all the world’s a graph.”

Looking forward to more details on Expresso as they emerge.

I first saw this in a tweet by Martin Kleppmann.

A practical introduction to functional programming

Filed under: Functional Programming,Python — Patrick Durusau @ 5:12 pm

A practical introduction to functional programming by Mary Rose Cook.

From the post:

Many functional programming articles teach abstract functional techniques. That is, composition, pipelining, higher order functions. This one is different. It shows examples of imperative, unfunctional code that people write every day and translates these examples to a functional style.

The first section of the article takes short, data transforming loops and translates them into functional maps and reduces. The second section takes longer loops, breaks them up into units and makes each unit functional. The third section takes a loop that is a long series of successive data transformations and decomposes it into a functional pipeline.

The examples are in Python, because many people find Python easy to read. A number of the examples eschew pythonicity in order to demonstrate functional techniques common to many languages: map, reduce, pipeline.

After spending most of the day with poor documentation, this sort of post is a real delight. It took more effort than the stuff I was reading today but it saves every reader time, rather than making them lose time.

Perhaps I should create an icon to mark documentation that will cost you more time than searching a discussion list for the answer.

Yes?

I first saw this in a tweet by Gianluca Fiore.

Comparative Oriental Manuscript Studies: An Introduction

Filed under: Humanities,Manuscripts — Patrick Durusau @ 4:52 pm

Comparative Oriental Manuscript Studies: An Introduction edited by: Alessandro Bausi (General editor), et al.

The “homepage” of this work enables you to download the entire volume or individual chapters, depending upon your interests. It provides a lengthy introduction to codicology, palaeography, textual criticism and text editing, and of special interest to library students, cataloguing as well as conservation and preservation.

Alessandro Bausi writes in the preface:

Thinking more broadly, our project was also a serious attempt to defend and preserve the COMSt-related fields within the academic world. We know that disciplines and fields are often determined and justified by the mere existence of an easily accessible handbook or, in the better cases, sets of handbooks, textbooks, series and journals. The lack of comprehensive introductory works which are reliable, up-to-date, of broad interest and accessible to a wide audience and might be used in teaching, has a direct impact on the survival of the ‘small subjects’ most of the COMSt-related disciplines pertain to. The decision to make the COMSt handbook freely accessible online and printable on demand in a paper version at an affordable price was strategic in this respect, and not just meant to meet the prescriptions of the European Science Foundation. We deliberately declined to produce an extremely expensive work that might be bought only by a few libraries and research institutions; on the other hand, a plain electronic edition only to be accessed and downloaded as a PDF file was not regarded as a desirable solution either. Dealing with two millennia of manuscripts and codices, we did not want to dismiss the possibility of circulating a real book in our turn.

It remains, hopefully, only to say,

Lector intende: laetaberis

John Svarlien says: A rough translation is: “Reader, pay attention. You will be happy you did.”

We are all people of books. It isn’t possible to separate present day culture and what came before it from books. Even people who shun reading of books, are shaped by forces that can be traced back to books.

But books did not suddenly appear as mass-printed paperbacks in airport lobbies and checkout lines in grocery stores. There is a long history of books prior to printing to the edges of the formation of codices.

This work is an introduction to the fascinating world of studying manuscripts and codices prior to the invention of printing. When nearly every copy of a work is different from every other copy, you can imagine the debates over which copy is the “best” copy.

Imagine some versions of “Gone with the Wind” ending with:

  • Frankly, my dear, I don’t give a damn. (traditional)
  • Ashley and I don’t give a damn. (variant)
  • Cheat Ashley out of his business I suppose. (variant)
  • (Lacks a last line due to mss. damage.) (variant)

The “text” of yesteryear lacked the uniform sameness of the printed “text” of today.

When you think about your “favorite” version in the Bible, it is likely a “majority” reading but hardly the only one.

With the advent of the printing press, texts took on the opportunity to be uniformly produced in mass quantities.

With the advent of electronic texts, either due to editing or digital corruption, we are moving back towards non-uniform texts.

Will we see the birth of digital codicology and its allied fields for digital texts?

PS: Please forward the notice of this book to your local librarian.

I first saw this in a tweet by Kirk Lowery.
January 24, 2015

Crawling the WWW – A $64 Question

Filed under: Common Crawl,Wikipedia,WWW — Patrick Durusau @ 3:14 pm

Have you ever wanted to crawl the WWW? To make a really comprehensive search? Waiting for a private power facility and server farm? You need wait no longer!

Ross Fairbanks details in WikiReverse data pipeline details the creation of Wikireverse:

WikiReverse is a reverse web-link graph for Wikipedia articles. It consists of approximately 36 million links to 4 million Wikipedia articles from 900,000 websites.

You can browse the data at WikiReverse or downloaded from S3 as a torrent.

The first thought that struck me was the data set would be useful for deciding which Wikipedia links are the default subject identifiers for particular subjects.

My second thought was what a wonderful starting place to find links with similar content strings, for the creation of topics with multiple subject identifiers.

My third thought was, $64 to search a CommonCrawl data set!

You can do a lot of searches at $64 per before you get to the cost of a server farm, much less a server farm plus a private power facility.

True, it won’t be interactive but then few searches at the NSA are probably interactive. 😉

The true upside being you are freed from the tyranny of page-rank and hidden algorithms by which vendors attempt to guess what is best for them and secondarily, what is best for you.

Take the time to work through Ross’ post and develop your skills with the CommonCrawl data.

Tooling Up For JSON

Filed under: JSON,Software — Patrick Durusau @ 2:22 pm

I needed to explore a large (5.7MB) JSON file and my usual command line tools weren’t a good fit.

Casting about I discovered Jshon: Twice as fast, 1/6th the memory. From the home page for Jshon:

Jshon parses, reads and creates JSON. It is designed to be as usable as possible from within the shell and replaces fragile adhoc parsers made from grep/sed/awk as well as heavyweight one-line parsers made from perl/python. Requires Jansson

Jshon loads json text from stdin, performs actions, then displays the last action on stdout. Some of the options output json, others output plain text meta information. Because Bash has very poor nested datastructures, Jshon does not try to return a native bash datastructure as a tpical library would. Instead, Jshon provides a history stack containing all the manipulations.

The big change in the latest release is switching the everything from pass-by-value to pass-by-reference. In a typical use case (processing AUR search results for ‘python’) by-ref is twice as fast and uses one sixth the memory. If you are editing json, by-ref also makes your life a lot easier as modifications do not need to be manually inserted through the entire stack.

Jansson is described as: “…a C library for encoding, decoding and manipulating JSON data.” Usual ./configure, make, make install. Jshon has no configure or install script so just make and toss it somewhere that is in your path.

Under Bugs you will read: “Documentation is brief.”

That’s for sure!

Still, it has enough examples that with some practice you will find this a handy way to explore JSON files.

Enjoy!

History Depends On Who You Ask, And When

Filed under: History,Persuasion,Politics — Patrick Durusau @ 11:52 am

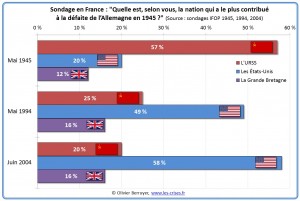
You have probably seen the following graphic but it bears repeating:

sondage-nation-contribue-defaite-nazis

The image is from: Who contributed most to the defeat of Nazi Germany in 1945?

From the post:

A survey conducted in May 1945 on the whole French territory now released (confirming a survey in September 1944 with Parisians) showed that interviewees appear well aware of the power relations and the role of allies in the war, despite the censorship and the difficulty to access reliable information under enemy’s occupation.

A clear majority (57%) believed that the USSR is the nation that has contributed most to the defeat of Germany while the United States and England will gather respectively 20% and 12%.

But what is truly astonishing is that this vision of public opinion was reversed very dramatically with time, as shown by two surveys conducted in 1994 and 2004. In 2004, 58% of the population were convinced that USA played the biggest role in the Second World War and only 20% were aware of the leading role of USSR in defeating the Nazi.

This is a very clear example of how the propaganda adjusted the whole nation’s perception of history, the evaluation of the fundamental contribution to the allied victory in the World War II.

Whether this change in attitude was the result of “propaganda” or some less directed social process I cannot say.

What I do find instructive is that over sixty (60) years, less than one lifetime, public perception of the “truth” can change that much.

How much greater the odds that the “truth” of events one hundred years ago are different from the ones we hold now.

To say nothing of the “truth” of events several thousand years ago, which we have reported only a handful of times, reports that have been edited to suite particular agendas.

Or we have some physical relics that occur at one location, sans any contemporaneous documentation, which we would not understand in its ancient context but in ours.

That should not dissuade us from writing histories, but it should make us cautious about taking action based on historical “truths.”

I most recently saw this in a tweet by Anna Pawlicka.

A first look at Spark

Filed under: R,Spark — Patrick Durusau @ 10:57 am

A first look at Spark by Joseph Rickert.

From the post:

Apache Spark, the open-source, cluster computing framework originally developed in the AMPLab at UC Berkeley and now championed by Databricks is rapidly moving from the bleeding edge of data science to the mainstream. Interest in Spark, demand for training and overall hype is on a trajectory to match the frenzy surrounding Hadoop in recent years. Next month's Strata + Hadoop World conference, for example, will offer three serious Spark training sessions: Apache Spark Advanced Training, SparkCamp and Spark developer certification with additional spark related talks on the schedule. It is only a matter of time before Spark becomes a big deal in the R world as well.

If you don't know much about Spark but want to learn more, a good place to start is the video of Reza Zadeh's keynote talk at the ACM Data Science Camp held last October at eBay in San Jose that has been recently posted.

After reviewing the high points of Reza Zadeh's presentation, Joseph points out another 4 hours+ of videos on using Spark and R together.

A nice collection for getting started with Spark and seeing how to use a standard tool (R) with an emerging one (Spark).

I first saw this in a tweet by Christophe Lalanne.

January 23, 2015

Draft Lucene 5.0 Release Highlights

Filed under: Lucene,Solr — Patrick Durusau @ 5:40 pm

Draft Lucene 5.0 Release Highlights

Just a draft of Lucene 5.0 release notes but it is a signal that the release is getting closer!

Or as the guy said in Star Wars, “…almost there!” Hopefully with happier results.

Update: My bad, I forgot to include the Solr 5.0 draft release notes as well!

http://wiki.apache.org/solr/ReleaseNote50

DiRT Digital Research Tools

Filed under: Humanities,Software — Patrick Durusau @ 2:21 pm

DiRT Digital Research Tools

From the post:

The DiRT Directory is a registry of digital research tools for scholarly use. DiRT makes it easy for digital humanists and others conducting digital research to find and compare resources ranging from content management systems to music OCR, statistical analysis packages to mindmapping software.

Interesting concept but the annotations are too brief to convey much information. Not to mention that within a category, say Conduct linguistic research or Transcribe handwritten or spoken texts, the entries have no apparent order, or should I say they are not arranged in alphabetical order by name. There may be some other order that is escaping me.

Some entries appear in the wrong categories, such as Xalan being found under Transcribe handwritten or spoken texts:

Xalan
Xalan is an XSLT processor for transforming XML documents into HTML, text, or other XML document types. It implements XSL Transformations (XSLT) Version 1.0 and XML Path Language (XPath) Version 1.0.

Not what I think of when I think about transcribing handwritten or spoken texts. You?

I didn’t see a process for submitting corrections/comments on resources. I will check and post on this again. It could be a useful tool.

I first saw this in a tweet by Christophe Lalanne.

January 22, 2015

Digital Cartography [84]

Filed under: Cartography,Mapping,Maps — Patrick Durusau @ 6:35 pm

Digital Cartography [84] by Visual Loop.

From the post:

Welcome to the year’s first edition of Digital Cartography, our weekly column where we feature the most recent interactive maps that came to our way. And being this the first issue of 2015, of course that it’s fully packed with more than 40 new interactive maps and cartographic-based narratives.

That means that you’ll need quite a bit of time to spend exploring these examples, but if that isn’t enough, there’s always the list with our 100 favorite interactive maps of 2014 (part one and two), guaranteed to keep you occupied for the next day or so.

…[M]ore than 40 new interactive maps and cartographic-based narratives.

How very cool!

With a couple of notable exceptions (see the article) mostly geography based mappings. There’s nothing wrong with geography based mappings but it makes me curious why there isn’t more diversity in mapping?

Just as a preliminary thought, could it be that geography gives us a common starting point for making ourselves understood? Rather than undertaking a burden of persuasion before we can induce someone to use the map?

From what little I have heard (intentionally) about #Gamergate, I would say a mapping of the people, attitudes, expressions of same and the various forums would vary significantly from person to person. If you did a non-geographic mapping of that event(?) (sorry, I don’t have more precise language to use), what would it look like? What major attitudes, factors, positions would you use to lay out the territory?

Personally I don’t find the lack of a common starting point all that troubling. If a map is extensive enough, it will surely intersect some areas of interest and a reader can start to work outwards from that intersection. They may or may not agree with what they find but it would have the advantage of not being snippet sized texts divorced from some over arching context.

A difficult mapping problem to be sure, one that poses far more difficulties than one that uses physical geography as a starting point. Would even an imperfect map be of use to those trying to sort though issues in such a case?

Streaming Big Data with Spark, Spark Streaming, Kafka, Cassandra and Akka

Filed under: Akka,Cassandra,Kafka,Spark,Streams — Patrick Durusau @ 3:47 pm

Webinar: Streaming Big Data with Spark, Spark Streaming, Kafka, Cassandra and Akka by Helena Edelson.

From the post:

On Tuesday, January 13 I gave a webinar on Apache Spark, Spark Streaming and Cassandra. Over 1700 registrants from around the world signed up. This is a follow-up post to that webinar, answering everyone’s questions. In the talk I introduced Spark, Spark Streaming and Cassandra with Kafka and Akka and discussed wh​​​​y these particular technologies are a great fit for lambda architecture due to some key features and strategies they all have in common, and their elegant integration together. We walked through an introduction to implementing each, then showed how to integrate them into one clean streaming data platform for real-time delivery of meaning at high velocity. All this in a highly distributed, asynchronous, parallel, fault-tolerant system.

Video | Slides | Code | Diagram

About The Presenter: Helena Edelson is a committer on several open source projects including the Spark Cassandra Connector, Akka and previously Spring Integration and Spring AMQP. She is a Senior Software Engineer on the Analytics team at DataStax, a Scala and Big Data conference speaker, and has presented at various Scala, Spark and Machine Learning Meetups.

I have long contended that it is possible to have a webinar that has little if any marketing fluff and maximum technical content. Helena’s presentation is an example of that type of webinar.

Very much worth the time to watch.

BTW, being so content full, questions were answered as part of this blog post. Technical webinars just don’t get any better organized than this one.

Perhaps technical webinars should be marked with TW and others with CW (for c-suite webinars). To prevent disorientation in the first case and disappointment in the second one.

Supremes “bitch slaps” Patent Court

Filed under: Law,Patents — Patrick Durusau @ 3:20 pm

Supreme Court strips more power from controversial patent court by Jeff John Roberts.

From the post:

The Supreme Court issued a ruling Tuesday that will have a significant impact on the patent system by limiting the ability of the Federal Circuit, a specialized court that hears patent appeals, to review key findings by lower court judges.

The 7-2 patent decision, which came the same day as a high profile ruling by the Supreme Court on prisoner beards, concerns an esoteric dispute between two pharmaceutical companies, Teva and Sandoz, over the right way to describe the molecule weight of a multiple sclerosis drug.

The Justices of the Supreme Court, however, appears to have taken the case in part because it presented another opportunity to check the power of the Federal Circuit, which has been subject to a recent series of 9-0 reversals and which some regard as a “rogue court” responsible for distorting the U.S. patent system.

As for the legal decision on Tuesday, it turned on the question of whether the Federal Circuit judges can review patent claim findings as they please (“de novo”) or only in cases where they has been serious error. Writing for the majority, Justice Stephen Breyer concluded that the Federal Circuit could not second guess how lower courts interpret those claims (a process called “claim construction”) except on rare occasions.

There is no doubt the Federal Circuit has done its share of damage to the patent system but it hasn’t acted alone. Congress and the patent system itself bear a proportionate share of the blame.

Better search and retrieval technology can’t clean out the mire in the USPTO stables. That is going to require reform from Congress and a sustained effort at maintaining the system once it has been reformed.

In the meantime, knowing that another blow has been dealt the Federal Circuit on patent issues will have to sustain reform efforts.

The Leek group guide to genomics papers

Filed under: Computational Biology,Genomics — Patrick Durusau @ 2:54 pm

The Leek group guide to genomics papers by Jeff Leek.

From the webpage:

When I was a student, my advisor John Storey made a list of papers for me to read on nights and weekends. That list was incredibly helpful for a couple of reasons.

  • It got me caught up on the field of computational genomics
  • It was expertly curated, so it filtered a lot of papers I didn’t need to read
  • It gave me my first set of ideas to try to pursue as I was reading the papers

I have often thought I should make a similar list for folks who may want to work wtih me (or who want to learn about statistical genomics). So this is my attempt at that list. I’ve tried to separate the papers into categories and I’ve probably missed important papers. I’m happy to take suggestions for the list, but this is primarily designed for people in my group so I might be a little bit parsimonious.

(reading list follows)

A very clever idea!

The value of such a list, when compared to the World Wide Web is that it is “curated.” Someone who knows the field has chosen and hopefully chosen well, from all the possible resources you could consult. By attending to those resources and not the page rank randomness of search results, you should get a more rounded view of a particular area.

I find such lists from time to time but they are often not maintained. Which seriously diminishes their value.

Perhaps the value-add proposition is shifting from making more data (read data, publications, discussion forums) available to filtering the sea of data into useful sized chunks. The user can always seek out more, but is enabled to start with a manageable and useful portion at first.

Hmmm, think of it as a navigational map, which lists longitude/latitude and major features. A that as you draw closer to any feature or upon request, can change its “resolution” to disclose more information about your present and impeding location.

For what area would you want to build such a navigational map?

I first saw this in a tweet by Christophe Lalanne

Lecture Slides for Coursera’s Data Analysis Class

Filed under: Data Analysis,R — Patrick Durusau @ 2:26 pm

Lecture Slides for Coursera’s Data Analysis Class by Jeff Leek.

From the webpage:

This repository contains the lecture slides for the Coursera course Data Analysis. The slides were created with the Slidify package in Rstudio.

From the course description:

You have probably heard that this is the era of “Big Data”. Stories about companies or scientists using data to recommend movies, discover who is pregnant based on credit card receipts, or confirm the existence of the Higgs Boson regularly appear in Forbes, the Economist, the Wall Street Journal, and The New York Times. But how does one turn data into this type of insight? The answer is data analysis and applied statistics. Data analysis is the process of finding the right data to answer your question, understanding the processes underlying the data, discovering the important patterns in the data, and then communicating your results to have the biggest possible impact. There is a critical shortage of people with these skills in the workforce, which is why Hal Varian (Chief Economist at Google) says that being a statistician will be the sexy job for the next 10 years.

This course is an applied statistics course focusing on data analysis. The course will begin with an overview of how to organize, perform, and write-up data analyses. Then we will cover some of the most popular and widely used statistical methods like linear regression, principal components analysis, cross-validation, and p-values. Instead of focusing on mathematical details, the lectures will be designed to help you apply these techniques to real data using the R statistical programming language, interpret the results, and diagnose potential problems in your analysis. You will also have the opportunity to critique and assist your fellow classmates with their data analyses.

Once you master the basics of data analysis with R (or some other language), the best way to hone your data analysis skills is to look for data sets that are new to you. Don’t go so far afield that you can’t judge a useful result from a non-useful one but going to the edges of your comfort zone is good practice as well.

Enjoy!

I first saw this in a tweet by Christophe Lalanne.

USI’s (Unidentified Security Incidents) – Security Through Obscurity

Filed under: Cybersecurity,Security — Patrick Durusau @ 2:15 pm

I was reading Cybersecurity Expert Warns Not Enough Being Done to Prevent Highly Destructive Cyberattacks on Critical Infrastructure wherein Steve Mustard, an industrial cybersecurity subject-matter expert of the International Society of Automation (ISA), etc., is reported to be sounding the horn for more industrial security.

From the post:

Mustard points to the steady flow of cyberattacks on industrial automation control systems (IACS) and supervisory control and data acquisition (SCADA) networks being tracked by the Repository of Industrial Security Incidents (RISI).

“There have been many incidents in the past 10 to 15 years that can be traced back to insufficient cybersecurity measures,” he says. “There are many every year, most of which escape public notice. In fact, it’s widely believed that there are many more that are never reported,” he discloses. “The RISI analysis shows time and again that these incidents are generally the result of the same basic cybersecurity control failures. It is often only the presence of external failsafe and protection mechanisms that these incidents do not lead to more catastrophic consequences. Many use these protection mechanisms to argue that the concern over the consequences of cyberattack is exaggerated, and yet incidents such as Deepwater Horizon should teach us that these protection mechanisms can and do fail.”

In case you didn’t follow the Deepwater Horizon link, let me give you the snippet from Wikipedia that covers what you need to know:

On 20 April 2010, while drilling at the Macondo Prospect, an explosion on the rig caused by a blowout killed 11 crewmen and ignited a fireball visible from 40 miles (64 km) away.[12] The resulting fire could not be extinguished and, on 22 April 2010, Deepwater Horizon sank, leaving the well gushing at the seabed and causing the largest offshore oil spill in U.S. history.[13] (emphasis added)

Do you see anything in the description of the events on the Deep Horizon that says “cybersecurity?” I’m not an “oil man” as they say in Louisiana but even I know the difference between a blowout (too much pressure from the well) and a cyberattack. Apparently Steve Mustard does not.

But the point of this post is that you can’t form an opinion about the rest of Steve Mustard’s claims. Or at least not at a reasonable cost.

Why?

Follow the link to the Repository of Industrial Security Incidents (RISI) and you will find that access to the Repository of Industrial Security Incidents is $995 for three months or $2995 per year.

So long as the “security” industry continues to play status and access games with security data, hackers are going to remain ahead of defenders. What part of that isn’t clear?

Sony scale hacks will become the norm if the computer security industry continues its “security by obscurity” stance.

Project Blue Book Collection (UFO’s)

Filed under: Government,Government Data — Patrick Durusau @ 11:18 am

Project Blue Book Collection

From the webpage:

This site was created by The Black Vault to house 129,491 pages, comprising of more than 10,000 cases of the Project Blue Book, Project Sign and Project Grudge files declassifed. Project Blue Book (along with Sign and Grudge) was the name that was given to the official investigation by the United States military to determine what the Unidentified Flying Object (UFO) phenomena was. It lasted from 1947 – 1969. Below you will find the case files compiled for research, and available free to download.

The CNN report Air Force UFO files land on Internet by Emanuella Grinberg reports Roswell is omitted from these files.

You won’t find anything new here, the files have been available on microfilm for years but being searchable and on the Internet is a step forward in terms of accessibility.

When I say “searchable,” the site notes:

1) A search is a good start — but is not 100% — There are more than 10,000 .pdf files here and although all of them are indexed in the search engine, the quality of the original documents, given the fact that many of them are more than 6 decades old, is very poor. This means that when they are converted to text for searching, many of the words are not readable to a computer. As a tip: make your search as basic as possible. Searching for a location? Just search a city, then the state, to see what comes up. Searching for a type of UFO? Use “saucer” vs. “flying saucer” or longer expression. It will increase the chances of finding what you are looking for.

2) The text may look garbled on the search results page (but not the .pdf!) — This is normal. For the same reason above… converting a sentence that may read ok to the human eye, may be gibberish to a computer due to the quality of the decades old state of many of the records. Don’t let that discourage you. Load the .PDF and see what you find. If you searched for “Hollywood” and a .pdf hit came up for Rome, New York, there is a reason why. The word “Hollywood” does appear in the file…so check it out!

3) Not everything was converted to .pdfs — There are a few case files in the Blue Book system that were simply too large to convert. They are:

undated/xxxx-xx-9667997-[BLANK][ 8,198 Pages ]
undated/xxxx-xx-9669100-[ILLEGIBLE]-[ILLEGIBLE]-/ [ 1,450 Pages ]
undated/xxxx-xx-9669191-[ILLEGIBLE]/ [ 3,710 Pages ]

These files will be sorted at a later date. If you are interested in helping, please email contact@theblackvault.com

I tried to access the files not yet processed but was redirected. I will see what is required to see the not yet processed files.

If you are interested in trying your skills at PDF conversion/improvement, the main data set should be more than sufficient.

If you are interested in automatic discovery of what or who was blacked out of government reports, this is also an interesting data set. Personally I think blacking out passages should be forbidden. People should have to accept the consequences of their actions, good or bad. We require that of citizens, why not government staff?

I assume crowd sourcing corrections has already been considered. 130K of pages is a fairly small number when it comes to crowd sourcing. Surely there are more than 10,000 people interested in the data set, which would be 13 pages each. Assuming each one did 100 pages each, you would have more than enough overlap to do statistics to choose the best corrections.

For those of you who see patterns in UFO reports, a good way to reach across the myriad sightings and reports would be to topic map the entire collection.

Personally I suspect at least some of the reports do concern alien surveillance and the absence in the intervening years indicates they have lost interest. Given our performance since the 1940’s, that’s not hard to understand.

January 21, 2015

Balisage: The Markup Conference 2015

Filed under: Conferences,XML,XML Schema,XPath,XProc,XQuery,XSLT — Patrick Durusau @ 8:48 pm

Balisage: The Markup Conference 2015 – There is Nothing As Practical As A Good Theory

Key dates:
– 27 March 2015 — Peer review applications due
– 17 April 2015 — Paper submissions due
– 17 April 2015 — Applications for student support awards due
– 22 May 2015 — Speakers notified
– 17 July 2015 — Final papers due
– 10 August 2015 — Symposium on Cultural Heritage Markup
– 11–14 August 2015 — Balisage: The Markup Conference

Bethesda North Marriott Hotel & Conference Center, just outside Washington, DC (I know, no pool with giant head, etc. Do you think if we ask nicely they would put one in? And change the theme of the decorations about every 30 feet in the lobby?)

Balisage is the premier conference on the theory, practice, design, development, and application of markup. We solicit papers on any aspect of markup and its uses; topics include but are not limited to:

  • Cutting-edge applications of XML and related technologies
  • Integration of XML with other technologies (e.g., content management, XSLT, XQuery)
  • Web application development with XML
  • Performance issues in parsing, XML database retrieval, or XSLT processing
  • Development of angle-bracket-free user interfaces for non-technical users
  • Deployment of XML systems for enterprise data
  • Design and implementation of XML vocabularies
  • Case studies of the use of XML for publishing, interchange, or archiving
  • Alternatives to XML
  • Expressive power and application adequacy of XSD, Relax NG, DTDs, Schematron, and other schema languages
  • Detailed Call for Participation: http://balisage.net/Call4Participation.html
    About Balisage: http://balisage.net/
    Instructions for authors: http://balisage.net/authorinstructions.html

    For more information: info@balisage.net or +1 301 315 9631

    I wonder if the local authorities realize the danger in putting that many skilled markup people so close the source of so much content? (Washington) With attendees sparking off against each other, who knows?, could see an accountable and auditable legislative and rule making document flow arise. There may not be enough members of Congress in town to smother it.

    The revolution may not be televised but it will be powered by markup and its advocates. Come join the crowd with the tools to make open data transparent.

    Emacs is My New Window Manager

    Filed under: Editor,Software — Patrick Durusau @ 8:08 pm

    Emacs is My New Window Manager by Howard Abrams.

    From the post:

    Most companies that employ me, hand me a “work laptop” as I enter the building. Of course, I do not install personal software and keep a clear division between my “work like” and my “real life.”

    However, I also don’t like to carry two computers just to jot down personal notes. My remedy is to install a virtualization system and create a “personal” virtual machine. (Building cloud software as my day job means I usually have a few VMs running all the time.)

    Since I want this VM to have minimal impact on my work, I base it on a “Server” version of Ubuntu. however, I like some graphical features, so my most minimal after market installation approach is:

    Your mileage with Emacs is going to vary but this was too impressive to pass it unremarked.

    I first saw this in a tweet by Christophe Lalanne.

    MrGeo (MapReduce Geo)

    Filed under: Geo Analytics,Geographic Information Retrieval,Geography,Geospatial Data — Patrick Durusau @ 7:58 pm

    MrGeo (MapReduce Geo)

    From the webpage:

    MrGeo was developed at the National Geospatial-Intelligence Agency (NGA) in collaboration with DigitalGlobe. The government has “unlimited rights” and is releasing this software to increase the impact of government investments by providing developers with the opportunity to take things in new directions. The software use, modification, and distribution rights are stipulated within the Apache 2.0 license.

    MrGeo (MapReduce Geo) is a geospatial toolkit designed to provide raster-based geospatial capabilities that can be performed at scale. MrGeo is built upon the Hadoop ecosystem to leverage the storage and processing of hundreds of commodity computers. Functionally, MrGeo stores large raster datasets as a collection of individual tiles stored in Hadoop to enable large-scale data and analytic services. The co-location of data and analytics offers the advantage of minimizing the movement of data in favor of bringing the computation to the data; a more favorable compute method for Geospatial Big Data. This framework has enabled the servicing of terabyte scale raster databases and performed terrain analytics on databases exceeding hundreds of gigabytes in size.

    The use cases sound interesting:

    Exemplar MrGeo Use Cases:

  • Raster Storage and Provisioning: MrGeo has been used to store, index, tile, and pyramid multi-terabyte scale image databases. Once stored, this data is made available through simple Tiled Map Services (TMS) and or Web Mapping Services (WMS).
  • Large Scale Batch Processing and Serving: MrGeo has been used to pre-compute global 1 ArcSecond (nominally 30 meters) elevation data (300+ GB) into derivative raster products : slope, aspect, relative elevation, terrain shaded relief (collectively terabytes in size)
  • Global Computation of Cost Distance: Given all pub locations in OpenStreetMap, compute 2 hour drive times from each location. The full resolution is 1 ArcSecond (30 meters nominally)
  • I wonder if you started war gaming attacks on well known cities and posting maps on how the attacks could develop if that would be covered under free speech? Assuming your intent was to educate the general populace about areas that are more dangerous than others in case of a major incident.

    I first saw this in a tweet by Marin Dimitrov.

    How to share data with a statistician

    Filed under: Open Data,Statistics — Patrick Durusau @ 7:38 pm

    How to share data with a statistician by Robert M. Horton.

    From the webpage:

    This is a guide for anyone who needs to share data with a statistician. The target audiences I have in mind are:

    • Scientific collaborators who need statisticians to analyze data for them
    • Students or postdocs in scientific disciplines looking for consulting advice
    • Junior statistics students whose job it is to collate/clean data sets

    The goals of this guide are to provide some instruction on the best way to share data to avoid the most common pitfalls and sources of delay in the transition from data collection to data analysis. The Leek group works with a large number of collaborators and the number one source of variation in the speed to results is the status of the data when they arrive at the Leek group. Based on my conversations with other statisticians this is true nearly universally.

    My strong feeling is that statisticians should be able to handle the data in whatever state they arrive. It is important to see the raw data, understand the steps in the processing pipeline, and be able to incorporate hidden sources of variability in one’s data analysis. On the other hand, for many data types, the processing steps are well documented and standardized. So the work of converting the data from raw form to directly analyzable form can be performed before calling on a statistician. This can dramatically speed the turnaround time, since the statistician doesn’t have to work through all the pre-processing steps first.

    My favorite part:

    The code book

    For almost any data set, the measurements you calculate will need to be described in more detail than you will sneak into the spreadsheet. The code book contains this information. At minimum it should contain:

    1. Information about the variables (including units!) in the data set not contained in the tidy data
    2. Information about the summary choices you made
    3. Information about the experimental study design you used

    Does a codebook exist for the data that goes into or emerges from your data processing?

    If someone has to ask you what variables mean, it’s not really “open” data is it?

    I first saw this in a tweet by Christophe Lalanne.

    Free Speech: Burning Issue Last Week, This Week Not So Much

    Filed under: News,Politics — Patrick Durusau @ 7:26 pm

    As evidence of the emptiness of the free speech rallies last week in Paris, I offer the following story:

    France – Don’t Criminalise Children For Speech by John Sargeant.

    John details the arrest of a 16 year old who published a parody of a cover by Charlie Hebdo. Take the time to see it and side by side comparison of the original cover and the parody.

    Ask yourself, could I make a parody of the parody with certain elected officials of the United States in the parody?

    Not a good area for experimentation. My suspicion, without looking in the United States Code, is that you would be arrested and severely punished.

    Just so you know that you can’t parody some people in the United States. Feeling real robust about freedom of speech now?

    I first saw this in a tweet by Alex Brown.

    Be a 4clojure hero with Emacs

    Filed under: Clojure,Editor — Patrick Durusau @ 7:14 pm

    Be a 4clojure hero with Emacs by Artur Malabarba.

    From the post:

    This year I made it my resolution to learn clojure. After reading through the unexpectedly engaging romance that is Clojure for the Brave and True, it was time to boldly venture through the dungeons of 4clojure. Sword in hand, I install 4clojure.el and start hacking, but I felt the interface could use some improvements.

    It seems only proper to mention after Windows 10 an editor that you can extend without needing a campus full of programmers and a gaggle of marketing folks. Not to mention it is easier to extend as well.

    Artur has two suggestions/extensions that will help propel you along with 4clojure.

    Enjoy!

    I first saw this in a tweet by Anna Pawlicka.

    The next generation of Windows: Windows 10

    Filed under: Microsoft — Patrick Durusau @ 6:00 pm

    The next generation of Windows: Windows 10 by Terry Myerson.

    From the post:

    Today I had the honor of sharing new information about Windows 10, the new generation of Windows.

    Our team shared more Windows 10 experiences and how Windows 10 will inspire new scenarios across the broadest range of devices, from big screens to small screens to no screens at all. You can catch the video on-demand presentation here.

    Windows 10 is the first step to an era of more personal computing. This vision framed our work on Windows 10, where we are moving Windows from its heritage of enabling a single device – the PC – to a world that is more mobile, natural and grounded in trust. We believe your experiences should be mobile – not just your devices. Technology should be out of the way and your apps, services and content should move with you across devices, seamlessly and easily. In our connected and transparent world, we know that people care deeply about privacy – and so do we. That’s why everything we do puts you in control – because you are our customer, not our product. We also believe that interacting with technology should be as natural as interacting with people – using voice, pen, gestures and even gaze for the right interaction, in the right way, at the right time. These concepts led our development and you saw them come to life today.

    I had to find a text equivalent to the video. I was looking for specific information I saw mentioned in an email and watching the entire presentation (2+ hours) just wasn’t in the cards.

    I will be watching the comment lists on Windows 10 for the answers to two questions:

    First, will I be able to run Windows 10 within a VM on Ubuntu?

    Second, for “sharing” of annotations to documents, is the “sharing” protocol open so that annotations can be shared by users not using Windows 10?

    Actually I did see some of the video and assuming you have the skills of a graphic artist, you are going to be producing some rocking content with Windows 10. People who struggle to doodle, not so much.

    The devil will be in the details but I can say this is the first version of Windows that has ever made me consider upgrading from Windows XP. Haven’t decided and may have to run it on a separate box (share monitors with Ubuntu) but I can definitely say I am interested.

    TM-Gen: A Topic Map Generator from Text Documents

    Filed under: Authoring Topic Maps,Text Mining,Topic Maps — Patrick Durusau @ 4:55 pm

    TM-Gen: A Topic Map Generator from Text Documents by Angel L. Garrido, et al.

    From the post:

    The vast amount of text documents stored in digital format is growing at a frantic rhythm each day. Therefore, tools able to find accurate information by searching in natural language information repositories are gaining great interest in recent years. In this context, there are especially interesting tools capable of dealing with large amounts of text information and deriving human-readable summaries. However, one step further is to be able not only to summarize, but to extract the knowledge stored in those texts, and even represent it graphically.

    In this paper we present an architecture to generate automatically a conceptual representation of knowledge stored in a set of text-based documents. For this purpose we have used the topic maps standard and we have developed a method that combines text mining, statistics, linguistic tools, and semantics to obtain a graphical representation of the information contained therein, which can be coded using a knowledge representation language such as RDF or OWL. The procedure is language-independent, fully automatic, self-adjusting, and it does not need manual configuration by the user. Although the validation of a graphic knowledge representation system is very subjective, we have been able to take advantage of an intermediate product of the process to make an experimental
    validation of our proposal.

    Of particular note on the automatic construction of topic maps:

    Addition of associations:

    TM-Gen adds to the topic map the associations between topics found in each sentence. These associations are given by the verbs present in the sentence. TM-Gen performs this task by searching the subject included as topic, and then it adds the verb as its association. Finally, it links its verb complement with the topic and with the association as a new topic.

    Depending on the archive one would expect associations between the authors and articles but also topics within articles, to say nothing of date, the publication, etc. Once established, a user can request a view that consists of more or less detail. If not captured, however, more detail will not be available.

    There is only a general description of TM-Gen but enough to put you on the way to assembling something quite similar.

    TMR: A Semantic Recommender System using Topic Maps on the Items’ Descriptions

    Filed under: Recommendation,Topic Maps — Patrick Durusau @ 3:37 pm

    TMR: A Semantic Recommender System using Topic Maps on the Items’ Descriptions by Angel L. Garrido and Sergio Ilarri.

    Abstract:

    Recommendation systems have become increasingly popular these days. Their utility has been proved to filter and to suggest items archived at web sites to the users. Even though recommendation systems have been developed for the past two decades, existing recommenders are still inadequate to achieve their objectives and must be enhanced to generate appealing personalized recommendations e ectively. In this paper we present TMR, a context-independent tool based on topic maps that works with item’s descriptions and reviews to provide suitable recommendations to users. TMR takes advantage of lexical and semantic resources to infer users’ preferences and thus the recommender is not restricted by the syntactic constraints imposed on some existing recommenders. We have verifi ed the correctness of TMR using a popular benchmark dataset.

    One of the more exciting aspects of this paper is the building of topic maps from free texts that are then used in the recommendation process.

    I haven’t seen the generated topic maps (yet) but suspect that editing an existing topic map is far easier than creating one ab initio.

    Command-line tools can be 235x faster than your Hadoop cluster

    Filed under: Awk,Hadoop — Patrick Durusau @ 2:57 pm

    Command-line tools can be 235x faster than your Hadoop cluster by Adam Drake.

    From the post:

    As I was browsing the web and catching up on some sites I visit periodically, I found a cool article from Tom Hayden about using Amazon Elastic Map Reduce (EMR) and mrjob in order to compute some statistics on win/loss ratios for chess games he downloaded from the millionbase archive, and generally have fun with EMR. Since the data volume was only about 1.75GB containing around 2 million chess games, I was skeptical of using Hadoop for the task, but I can understand his goal of learning and having fun with mrjob and EMR. Since the problem is basically just to look at the result lines of each file and aggregate the different results, it seems ideally suited to stream processing with shell commands. I tried this out, and for the same amount of data I was able to use my laptop to get the results in about 12 seconds (processing speed of about 270MB/sec), while the Hadoop processing took about 26 minutes (processing speed of about 1.14MB/sec). (emphasis added)

    BTW, Adam was using twice as much data as Tom in his analysis.

    The lesson here is to not be a one-trick pony as a data scientist. Most solutions, Hadoop, Spark, Titan, can solve most problems. However, anyone who merits the moniker “data scientist” should be able to choose the “best” solution for a given set of circumstances. In some cases that maybe simple shell scripts.

    I first saw this in a tweet by Atabey Kaygun.

    January 20, 2015

    Flask and Neo4j

    Filed under: Blogs,Graphs,Neo4j,Python — Patrick Durusau @ 5:03 pm

    Flask and Neo4j – An example blogging application powered by Flask and Neo4j. by Nicole White.

    From the post:

    I recommend that you read through Flask’s quickstart guide before reading this tutorial. The following is drawn from Flask’s tutorial on building a microblog application. This tutorial expands the microblog example to include social features, such as tagging posts and recommending similar users, by using Neo4j instead of SQLite as the backend database.
    (14 parts follow here)

    The fourteen parts take you all the way through deployment on Heroku.

    I don’t think you will abandon your current blogging platform but you will gain insight into Neo4j and Flask. A non-trivial outcome.

    10 Chemistry Blogs You Should Read

    Filed under: Cheminformatics,Chemistry — Patrick Durusau @ 4:38 pm

    10 Chemistry Blogs You Should Read by Aaron Oneal.

    If you are looking for reading in chemistry, Aaron has assembled ten very high quality blogs for you to follow. Each is listed with a short description so you can tune the reading to your taste.

    Personally I recommend taking a sip from each one. It is rare that I read a really good blog and don’t find something of interest and many times relevant to other projects that I would not have seen otherwise.

    The PokitDok HealthGraph

    Filed under: Graphs,Health care — Patrick Durusau @ 4:32 pm

    The PokitDok HealthGraph by Denise Gosnell, PhD and Alec Macrae.

    From the post:

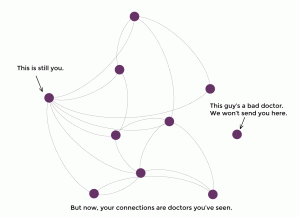
    doctor_graph

    While the front-end team has been busy putting together version 3 of our healthcare marketplace, the data science team has been hard at work on several things that will soon turn into new products. Today, I’d like to give you a sneak peek at one of these projects, one that we think will profoundly change the way you think about health data. We call it the PokitDok HealthGraph. Let’s ring in the New Year with some data science!

    Everyone’s been talking about Graph Theory, but what is it, exactly?

    And we aren’t talking about bar graphs and pie charts.

    Social networks have brought the world of graph theory to the forefront of conversation. Even though graph theory has been around since Euler solved the infamous Konigsberg bridge problem in the 1700’s, we can thank the current age of social networking for giving graph theory a modern revival.

    At the very least, graph theory is the art of connecting the dots, kind of like those sweet pictures you drew as a kid. A bit more formally, graph theory studies relationships between people, places and/or things. Take any ol’ social network – Facebook, for example, uses a graph database to help people find friends and interests. In graph theory, we represent this type of information with nodes (dots) and edges (lines) where the nodes are people, places and/or things and the lines represent their relationship.

    To make a long story short: healthcare is about you and connecting you with quality care. When data scientists think of connecting things together, graphs are most often the direction we go.

    At PokitDok, we like to look at your healthcare needs as a social network, aka: your personal HealthGraph. The HealthGraph is a network of doctors, other patients, insurance providers, common ailments and all of the potential connections between them.

    Hard to say in advance but it looks like Denise and Alec are close to the sweet spot on graph explanations for lay people. Having subject matter that is important to users helps. And using familiar names for the nodes of the graph works as well.

    Worth following this series of posts to see if they continue along this path.

    Databases of Biological Databases (yes, plural)

    Filed under: Bioinformatics,Biology,Medical Informatics — Patrick Durusau @ 4:15 pm

    Mick Watson points out in a tweet today that there are at least two databases of biological databases.

    Metabase

    MetaBase is a user-contributed list of all the biological databases available on the internet. Currently there are 1,802 entries, each describing a different database. The databases are described in a semi-structured way by using templates and entries can cary various user comments and annotations (see a random entry). Entries can be searched, listed or browsed by category.

    The site uses the same MediaWiki technology that powers Wikipedia, probably the best known user-contributed resource on the internet. The Mediawiki system allows users to participate on many different levels, ranging from authors and editors to curators and designers.

    Database description

    MetaBase aims to be a flexible, user-driven (user-created) resource for the biological database community.

    The main focus of MetaBase is summarised below:

    • As a basic requirement, MB contains a list of databases, URLs and descriptions of the most commonly used biological databases currently available on the internet.
    • The system should be flexible, allowing users to contribute, update and maintain the data in different ways.
    • In the future we aim to generate more communication between the database developer and user communities.

    A larger, more ambitious list of aims is given here.

    The first point was acheived using data taken from the Molecular Biology Database Collection. Secondly, MetaBase has been implemented using MediaWiki. The final point will take longer, and is dependent on the community uptake of MB…

    DBD – Database of Biological Databases

    DBD: Database of Biological Database team are R.R. Siva Kiran, MVN Setty, Department of Biotechnology, MS Ramaiah Institute of Technology, MSR Nagar, Bangalore, India and G. Hanumantha Rao, Center for Biotechnology, Department of Chemical Engineering, Andhra University, Visakhapatnam-530003, India. DBD consists of 1200 Database entries covering wide range of databases useful for biological researchers.

    Be aware that the DBD database reports its last update as 30-July-2008. I have written to confirm if that is the correct date.

    Assuming it is, has anyone validated the links in the DBD database and/or compared them to the links in Metabase? That seems like a worthwhile service to the community.

    « Newer PostsOlder Posts »

    Powered by WordPress