ForWarn: Satellite-Based Change Recognition and Tracking
From the introduction:
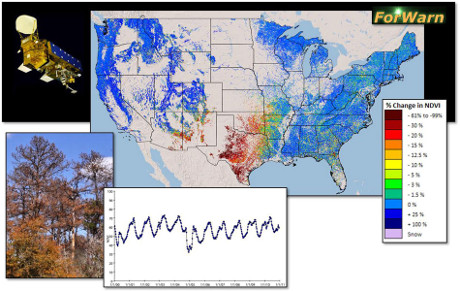
ForWarn is a vegetation change recognition and tracking system that uses high-frequency, moderate resolution satellite data. It provides near real-time change maps for the continental United States that are updated every eight days. These maps show the effects of disturbances such as wildfires, wind storms, insects, diseases, and human-induced disturbances in addition to departures from normal seasonal greenness caused by weather. Using this state of the art tracking system, it is also possible to monitor post-disturbance recovery and the cumulative effects of multiple disturbances over time.
This technology supports a broader cooperative management initiative known as the National Early Warning System (EWS). The EWS network brings together various organizations involved in mapping disturbances, climate stress, aerial and ground monitoring, and predictive efforts to achieve more efficient landscape planning and management across jurisdictions.
ForWarn consists of a set of inter-related products including near real time vegetation change maps, an archive of past change maps, an archive of seasonal vegetation phenology maps, and derived map products from these efforts. For a detailed discussion of these products, or to access these map products in the project’s Assessment Viewer or to explore these data using other GIS services, look through Data Access under the Products header.
- ForWarn relies on daily eMODIS and MODIS satellite data
- It tracks change in the Normalized Difference Vegetation Index (NDVI)
- Coverage extends to all lands of the continental US
- Products are at 232 meter resolution (13.3 acres or 5.4 hectares)
- It has NDVI values for 46 periods per year (at 8-day intervals)
- It uses a 24-day window with 8-day time steps to avoid clouds, etc.
- The historical NDVI database used for certain baselines dates from 2000 to the present
Not everyone can be blocking pipeline construction and/or making DAPL the most-expensive non-operational (too many holes) pipeline in history.
Watching for leaks, discharges, and other environmental crimes as reflected in the surrounding environment is a valuable contribution as well.
All you need is a computer with an internet connection. Much of the heavy lifting has been done at no cost to you by ForWarn.
It occurs to me that surface mining operations and spoilage from them are likely to produce artifacts larger than 232 meter resolution. Yes?
Enjoy!