Another Word For It Patrick Durusau on Topic Maps and Semantic Diversity

October 10, 2013

Government Shutdown = Free Oxford Content!

Filed under: Books,Interface Research/Design,Reference — Patrick Durusau @ 1:03 pm

Free access to Oxford content during the government shutdown

From the post:

The current shutdown in Washington is limiting the access that scholars and researchers have to vital materials. To that end, we have opened up access for the next two weeks to three of our online resources: Oxford Reference, American National Biography Online, and the US Census demographics website, Social Explorer.

  • Oxford Reference is the home of Oxford’s quality reference publishing, bringing together over 2 million entries from subject reference, language, and quotations dictionaries, many of which are illustrated, into a single cross-searchable resource. Start your journey by logging in using username: tryoxfordreference and password: govshutdown
  • American National Biography Online provides articles that trace a person’s life through the sequence of significant events as they occurred from birth to death offering portraits of more than 18,700 men and women— from all eras and walks of life—whose lives have shaped the nation. To explore, simply log in using username: tryanb and password: govshutdown
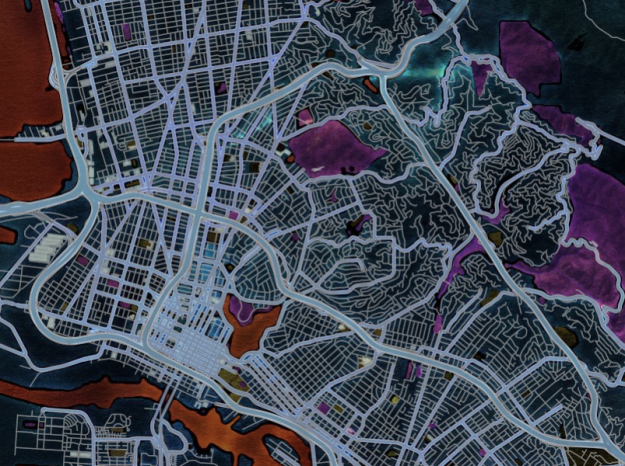
  • Social Explorer provides quick and easy access to current and historical census data and demographic information. It lets users create maps and reports to illustrate, analyze, and understand demography and social change. In addition to its comprehensive data resources, Social Explorer offers features and tools to meet the needs of demography experts and novices alike. For access to Social Explorer, email online reference@oup.com for a username and password.

An example of:

It’s an ill wind that blows nobody good

Whatever your political persuasion, a great opportunity to experience first class reference materials.

It’s only for two weeks so pass this onto your friends and colleagues!

PS: From a purely topic map standpoint, the site is also instructive as a general UI.

October 8, 2013

Search-Aware Product Recommendation in Solr (Users vs. Experts?)

Filed under: Interface Research/Design,Recommendation,Searching,Solr — Patrick Durusau @ 10:43 am

Search-Aware Product Recommendation in Solr by John Berryman.

From the post:

Building upon earlier work with semantic search, OpenSource Connections is excited to unveil exciting new possibilities with Solr-based product recommendation. With this technology, it is now possible to serve user-specific, search-aware product recommendations directly from Solr.

In this post, we will review a simple Search-Aware Recommendation using an online grocery service as an example of e-commerce product recommendation. In this example I have built up a basic keyword search over the product catalog. We’ve also added two fields to Solr: purchasedByTheseUsers and recommendToTheseUsers. Both fields contain lists of userIds. Recall that each document in the index corresponds to a product. Thus the purchasedByTheseUsers field literally lists all of the users who have purchased said product. The next field, recommendToTheseUsers, is the special sauce. This field lists all users who might want to purchase the corresponding product. We have extracted this field using a process called collaborative filtering, which is described in my previous post, Semantic Search With Solr And Python Numpy. With collaborative filtering, we make product recommendation by mathematically identifying similar users (based on products purchased) and then providing recommendations based upon the items that these users have purchased.

Now that the background has been established, let’s look at the results. Here we search for 3 different products using two different, randomly-selected users who we will refer to as Wendy and Dave. For each product: We first perform a raw search to gather a base understanding about how the search performs against user queries. We then search for the intersection of these search results and the products recommended to Wendy. Finally we also search for the intersection of these search results and the products recommended to Dave.

BTW, don’t miss the invitation to be an alpha tester for Solr Search-Aware Product Recommendation at the end of John’s post.

Reading John’s post it occurred to me that an alternative to mining other users’ choices, you could have an expert develop the recommendations.

Much like we use experts to develop library classification systems.

But we don’t, do we?

Isn’t that interesting?

I suspect we don’t use experts for product recommendations because we know that shopping choices depends on a similarity between consumers

We may not know what the precise nature of the similarity may be, but it is sufficient that we can establish its existence in the aggregate and sell more products based upon it.

Shouldn’t the same be true for finding information or data?

If similar (in some possibly unknown way) consumers of information find information in similar ways, why don’t we organize information based on similar patterns of finding?

How an “expert” finds information may be more “precise” or “accurate,” but if a user doesn’t follow that path, the user doesn’t find the information.

A great path that doesn’t help users find information is like having a great road with sidewalks, a bike path, cross-walks, good signage, that goes no where.

How do you incorporate user paths in your topic map application?

October 6, 2013

If it doesn’t work on mobile, it doesn’t work

Filed under: Graphics,Interface Research/Design,Topic Maps,Visualization — Patrick Durusau @ 7:30 pm

If it doesn’t work on mobile, it doesn’t work by Brian Boyer.

Brian’s notes from a presentation at Hacks/Hackers Buenos Aires last August.

The presentation is full of user survey results and statistics that are important for topic map interface designers.

At least if you want to be a successful topic map interface designer.

Curious, do you think consuming topic map based information will require a different interface from generic information consumption?

Reasoning that a consumer of information may not know or even care what technology underlies the presentation of desired information.

Would your response differ if I asked about authoring topic map content?

To simplify that question, let’s assume that we aren’t talking about a generic topic map authoring interface.

Say a baseball topic map authoring interface that accepts player’s name, positions, actions in games, etc., without exposing topic map machinery.

September 22, 2013

CensusReporter

Filed under: Census Data,Interface Research/Design — Patrick Durusau @ 2:38 pm

Easier Census data browsing with CensusReporter by Nathan Yau.

Nathan writes:

Census data can be interesting and super informative, but getting the data out of the dreaded American FactFinder is often a pain, especially if you don’t know the exact table you want. (This is typically the case.) CensusReporter, currently in beta, tries to make the process easier.

Whatever your need for census data, even the beta interface is worth your attention!

September 11, 2013

Google expands define but drops dictionary

Filed under: Dictionary,Interface Research/Design,Topic Maps — Patrick Durusau @ 5:15 pm

Google expands define but drops dictionary by Karen Blakeman.

From the post:

Google has added extra information to its web definitions. When using the ‘define’ command, an expandable box now appears containing additional synonyms, how the word is used in a sentence, the origins of the word, the use of the word over time and translations. At the moment it is only available in Google.com and you no longer need the colon immediately after define. So, for definitions of dialectic simply type in define dialectic.

Google Define

The box gives definitions and synonyms of the word and the ‘More’ link gives you an example of its use in a sentence.
(…)

Karen lays out how you can use “define” to your best advantage.

What has my curiosity up is the thought of using a keyword like “define” in a topic map interface.

Rather than giving a user all the information about a subject, to create an on the fly thumbnail of a subject. Which a user can then follow or not.

September 10, 2013

Paperscape

Filed under: Bibliography,Graphics,Interface Research/Design,Visualization — Patrick Durusau @ 2:55 am

Paperscape

A mapping of papers from arXiv.

I had to “zoom in” a fair amount to get a useful view of the map. Choosing any paper displays its bibliographic information with links to that paper.

Quite clever but I can’t help but think of what a more granular map might offer.

More “granular” in the sense of going below the document level to terms/concepts in each paper and locating them in a stream of discussion by different authors.

Akin to the typical “review” article that traces particular ideas through a series of publications.

But in any event, I commend Paperscape to you as a very clever bit of work.

I first saw this in Nat Torkington’s Four short links: 9 September 2013.

September 2, 2013

Defining Usability

Filed under: Design,Interface Research/Design,Usability — Patrick Durusau @ 7:39 pm

Over the Labor Day holiday weekend (U.S.) i had a house full of librarians.

That happens when you are married to a librarian, who has a first cousin who is a librarian and your child is also a librarian.

It’s no surprise they talked about library issues and information technology issues in libraries in particular.

One primary concern was how to define “usability” for a systems engineer.

Patrons could “request” items and would be assured that they request had been accepted. However, the “receiver” module for that message, used by circulation, had no way to retrieve the requests.

From a systems perspective, the system was accepting requests, as designed. While circulation (who fulfills the requests) could not retrieve the messages, that was also part of the system design.

The user’s expectation their request would be seen and acted was being disappointed.

Disappointment of a user expectation, even if within system design parameters, is by definition, failure of the UI.

The IT expectation users would, after enough silence, make in-person or phone requests was the one that should be disappointed.

Or to put it another way, IT systems do not exist to provide employment for people interested in IT.

They exist solely and proximity to assist users in tasks that may have very little to do with IT.

Users are interested in “real life” (a counter-part to “real world”) research, discovery, publication, invention, business, pleasure and social interaction.

August 22, 2013

You complete me

Filed under: AutoSuggestion,ElasticSearch,Interface Research/Design,Lucene — Patrick Durusau @ 2:03 pm

You complete me by Alexander Reelsen.

From the post:

Effective search is not just about returning relevant results when a user types in a search phrase, it’s also about helping your user to choose the best search phrases. Elasticsearch already has did-you-mean functionality which can correct the user’s spelling after they have searched. Now, we are adding the completion suggester which can make suggestions while-you-type. Giving the user the right search phrase before they have issued their first search makes for happier users and reduced load on your servers.

Warning: The completion suggester Alexander describes may “change/break in future releases.”

Two features that made me read the post were: readability and custom ordering.

Under readability, the example walks you through returning one output for several search completions.

Suggestions don’t have to be presented in TF/IDF relevance order. A weight assigned to the target of a completion controls the ordering of suggestions.

The post covers several other features and if you are using or considering using Elasticsearch, it is a good read.

August 17, 2013

Creating a Solr <search> HTML element…

Filed under: Interface Research/Design,Javascript,Solr — Patrick Durusau @ 4:07 pm

Creating a Solr <search> HTML element with AngularJS! by John Berryman.

From the post:

Of late we’ve been playing around with EmberJS for putting together slick client-side apps. But one thing that bothers me is how heavy-weight it feels. Another thing that concerns me is that AngularJS is really getting a lot of good attention and I want to make sure I’m not missing the boat! Here, look, just check out the emberjs/angularjs Google Trends plot: – See more at: http://www.opensourceconnections.com/2013/08/11/creating-a-search-html-element-with-angularjs/#sthash.ZH22mU0h.dpuf

It’s great to have a rocking search, topic map, or other retrieval application.

However, to make any sales, it needs to also deliver content to users.

I know, pain in the ass but people who pay for things want a result on the screen, intangible though it may be. 😉

August 6, 2013

Stop writing Regular Expressions. Express them with Verbal Expressions.

Filed under: Interface Research/Design,Topic Maps — Patrick Durusau @ 6:12 pm

Stop writing Regular Expressions. Express them with Verbal Expressions. by Jerod Santo.

From the post:

GitHub user jehna has fashioned a runaway hit with his unique way of constructing difficult regular expressions.

VerbalExpressions turns the often-obscure-and-tricky-to-type regular expression operators into descriptive, chainable functions. The result of this is quite astounding. Here’s the example URL tester from the README:

// Create an example of how to test for correctly formed URLs
var tester = VerEx()
            .startOfLine()
            .then( "http" )
            .maybe( "s" )
            .then( "://" )
            .maybe( "www." )
            .anythingBut( " " )
            .endOfLine();

You can think of other regex languages that are more concise, but can you think of one as easy to teach to new users?

I think there is a lesson here for hand editing of topic maps.

Such as discovering what commons terms particular people would use for topic map constructs.

Those terms could become their topic map authoring language, with a translation script that casts their expression into some briefer notation.

Yes?

August 3, 2013

Information Dashboard Design…

Filed under: Dashboard,Design,Interface Research/Design — Patrick Durusau @ 4:16 pm

Information Dashboard Design: Displaying Data for At-a-Glance Monitoring by Stephen Few.

The Amazon description:

A leader in the field of data visualization, Stephen Few exposes the common problems in dashboard design and describes its best practices in great detail and with a multitude of examples in this updated second edition. According to the author, dashboards have become a popular means to present critical information at a glance, yet few do so effectively. He purports that when designed well, dashboards engage the power of visual perception to communicate a dense collection of information efficiently and with exceptional clarity and that visual design skills that address the unique challenges of dashboards are not intuitive but rather learned. The book not only teaches how to design dashboards but also gives a deep understanding of the concepts—rooted in brain science—that explain the why behind the how. This revised edition offers six new chapters with sections that focus on fundamental considerations while assessing requirements, in-depth instruction in the design of bullet graphs and sparklines, and critical steps to follow during the design process. Examples of graphics and dashboards have been updated throughout, including additional samples of well-designed dashboards.

Disclosure: I follow Stephen’s blog but I have not seen either edition of this book.

However, if you want to send me a copy, I will post a review of it. 😉

Or point me to other reviews and I will update this post with pointers.

July 27, 2013

Good UI

Filed under: Interface Research/Design,UX — Patrick Durusau @ 6:18 pm

Good UI

Sixteen tips on creating a better UI with more promised to be on the way.

Newsletter promises two (2) per month.

The test of a UI is not whether the designer or you find it intuitive.

The test of a UI is whether an untrained user finds it intuitive.

I first saw this at Nat Torkington’s Four short links: 26 July 2013.

July 25, 2013

Comparing text to data by importing tags

Filed under: Interface Research/Design,News,Reporting,UX — Patrick Durusau @ 1:12 pm

Comparing text to data by importing tags by Jonathan Stray.

From the post:

Overview sorts documents into folders based on the topic of each document, as determined by analyzing every word in each document. But it can also be used to see how the document text relates to the date of publication, document type, or any other field related to each document.

This is possible because Overview can import tags. To use this feature, you will need to get your documents into CSV file, which is a simple rows and columns spreadsheet format. As usual, the text of each document does in the “text” column. But you can also add a “tags” column which gives the tag or tags to be initially assigned to each document, separated by commas if more than one.

Jonathan demonstrates this technique on the Afghanistan War Logs.

Associations at the level of a document are useful.

Such as Jonathan suggests, document + date of publication; document + document type, etc.

But doesn’t that leave the reader with the last semantic mile to travel on their own?

That is I would rather have: document + source/author + term in document + data of publication and a host of other associations represented.

Otherwise, once I find the document, using tags perhaps, I have to retrace the steps of anyone who discovered the “document + source/author + term in document + data of publication” relationship before I did.

And anyone following me will have to retrace my steps.

How many searches get retraced in your department every month?

July 14, 2013

Looking ahead [Exploratory Merging?]

Filed under: Interface Research/Design,Merging,Searching — Patrick Durusau @ 6:31 pm

Looking ahead by Gene Golovchinsky.

From the post:

It is reasonably well-known that people who examine search results often don’t go past the first few hits, perhaps stopping at the “fold” or at the end of the first page. It’s a habit we’ve acquired due to high-quality results to precision-oriented information needs. Google has trained us well.

But this habit may not always be useful when confronted with uncommon, recall-oriented, information needs. That is, when doing research. Looking only at the top few documents places too much trust in the ranking algorithm. In our SIGIR 2013 paper, we investigated what happens when a light-weight preview mechanism gives searchers a glimpse at the distribution of documents — new, re-retrieved but not seen, and seen — in the query they are about to execute.

The preview divides the top 100 documents retrieved by a query into 10 bins, and builds a stacked bar chart that represents the three categories of documents. Each category is represented by a color. New documents are shown in teal, re-retrieved ones in the light blue shade, and documents the searcher has already seen in dark blue. The figures below show some examples:

(…)

The blog post is great but you really need to ready the SIGIR paper in full.

Speaking of exploratory searching, is anyone working on exploratory merging?

That is where a query containing a statement of synonymy or polysemy from a searcher results in exploratory merging of topics?

I am assuming that experts in a particular domain will see merging opportunities that eluded automatic processes.

Seems like a shame to waste their expertise, which could be captured to improve a topic map for future users.


The SIGIR paper:

Looking Ahead: Query Preview in Exploratory Search

Abstract:

Exploratory search is a complex, iterative information seeking activity that involves running multiple queries, finding and examining many documents. We introduced a query preview interface that visualizes the distribution of newly-retrieved and re-retrieved documents prior to showing the detailed query results. When evaluating the preview control with a control condition, we found effects on both people’s information seeking behavior and improved retrieval performance. People spent more time formulating a query and were more likely to explore search results more deeply, retrieved a more diverse set of documents, and found more different relevant documents when using the preview. With more time spent on query formulation, higher quality queries were produced and as consequence the retrieval results improved; both average residual precision and recall was higher with the query preview present.

June 27, 2013

Overview

Filed under: Interface Research/Design,News,UX — Patrick Durusau @ 2:08 pm

Overview: Visualization to connect the dots by Jonathan Stray.

Overview has a new UI!

It’s a screen shot and difficult to describe. Check it out!

About Overview:

Overview is intended to help journalists, researchers, and other curious people make sense of massive, disorganized collections of electronic documents. It’s a visualization and analysis tool designed for sets of documents, typically thousands of pages of material.

Overview applies natural language processing algorithms to automatically sort the documents into folders and sub-folders based on their topic. Like a table of contents, this organization helps you to understand “what’s in there?” This is more powerful than text search, because it helps you to find what you don’t even know to look for.

Overview has been used to analyze emails, a declassified document dumps, material from Wikileaks releases, social media posts, online comments, and more.

My question would be how difficult/easy it is to integrate connected dots from one project/reporter to another?

Or to search the semantics of dots discovered in a project?

June 24, 2013

Quantitative Research and Eye-Tracking:…

Filed under: Interface Research/Design,Usability,Users,UX — Patrick Durusau @ 1:33 pm

Quantitative Research and Eye-Tracking: A match made in UX heaven by James Breeze and Alexis Conomos.

From the post:

Administering many sessions of usability testing has shown us that people either attribute their failures to forces outside of their control (e.g. “The website doesn’t work and needs to be fixed) or to things they have influence over (e.g. “I’m not that good with computers but I could probably learn how to use it”).

A person’s perceived influence over outcomes is known, in psychobabble, as their ‘locus of control’ and it has a profound effect on usability testing results.

Qualitative data and verbatims from individuals with an internal locus of control often reflect a positive user experience, even when they have made several errors performing tasks. Similar to the respondent in the scenario depicted in the cartoon below, these individuals attribute their errors to their own actions, rather than failures of the product being tested.

(…)

The higher end of research on user experiences with technology.

Being aware of the issues may help you even if you lack funding for some of the tools and testing described in the post.

June 22, 2013

The New Search App in Hue 2.4

Filed under: Hadoop,Hue,Interface Research/Design,Solr,UX — Patrick Durusau @ 3:59 pm

The New Search App in Hue 2.4

From the post:

In version 2.4 of Hue, the open source Web UI that makes Apache Hadoop easier to use, a new app was added in addition to more than 150 fixes: Search!

Using this app, which is based on Apache Solr, you can now search across Hadoop data just like you would do keyword searches with Google or Yahoo! In addition, a wizard lets you tweak the result snippets and tailors the search experience to your needs.

The new Hue Search app uses the regular Solr API underneath the hood, yet adds a remarkable list of UI features that makes using search over data stored in Hadoop a breeze. It integrates with the other Hue apps like File Browser for looking at the index file in a few clicks.

Here’s a video demoing queries and results customization. The demo is based on Twitter Streaming data collected with Apache Flume and indexed in real time:

Even allowing for the familiarity of the presenter with the app, this is impressive!

More features are reported to be on the way!

Definitely sets a higher bar for search UIs.

June 21, 2013

The LION Way

Filed under: Interface Research/Design,Machine Learning — Patrick Durusau @ 5:43 pm

The LION Way: Machine Learning plus Intelligent Optimization by Roberto Battiti and Mauro Brunato.

From the introduction:

Learning and Intelligent Optimization (LION) is the combination of learning from data and optimization applied to solve complex and dynamic problems. The LION way is about increasing the automation level and connecting data directly to decisions and actions. More power is directly in the hands of decision makers in a self-service manner, without resorting to intermediate layers of data scientists. LION is a complex array of mechanisms, like the engine in an automobile, but the user (driver) does not need to know the inner-workings of the engine in order to realize tremendous benefits. LION’s adoption will create a prairie fire of innovation which will reach most businesses in the next decades. Businesses, like plants in wildfire-prone ecosystems, will survive and prosper by adapting and embracing LION techniques, or they risk being transformed from giant trees to ashes by the spreading competition.

The questions to be asked in the LION paradigm are not about mathematical goodness models but about abundant data, expert judgment of concrete options (examples of success cases), interactive definition of success criteria, at a level which makes a human person at ease with his mental models. For example, in marketing, relevant data can describe the money allocation and success of previous campaigns, in engineering they can describe experiments about motor designs (real or simulated) and corresponding fuel consumption.

OK, the “…prairie fire of innovation…” stuff is a bit over the top but it’s promoting a paradigm.

And I’m not unsympathetic to making tools easier for users to use.

Although, I must confess that people who choose a “self-service” model for complex information processing are likely to get the results they deserve (but don’t want).

Like most people I can “type” after a fashion. I don’t look at the keyboard and do use all ten fingers. But, compared to a professional typist of my youth, I am not even an entry level typist. A professional typist could produce far more error free content in a couple of hours than I can all day.

Odd how “self-service” works out to putting more of a burden on the user for a poorer result.

The book is free and worth a read.

I first saw this at KDNuggets.

June 19, 2013

Hosting a Page Description Workshop

Filed under: Interface Research/Design,UX — Patrick Durusau @ 1:27 pm

Hosting a Page Description Workshop by Colin Butler and Andrew Wirtanen.

From the post:

You’ve met with your stakeholders, created personas, and developed some user stories, but you still find yourself having a difficult time starting the process of sketching layouts for your web project. Sound familiar?

It can be quite challenging making that last step from goals to content in a way that addresses your stakeholders’ needs well. You can build a Page Description Diagram (PDD) independently to help you determine the priority of each component on a web page, but you are still potentially missing some valuable information: input from stakeholders.

In our efforts to improve the requirements gathering process, we’ve had considerable success involving stakeholders by using what we call a Page Description Workshop (PDW).

Developing a topic map UI?

How is that different from a webpage?

At least from the user’s perspective?

Useful as well for ferreting out unspoken requirements for the topic map.

June 17, 2013

Google Visual Assets Guidelines – Part 1 [Link to 2]

Filed under: Interface Research/Design,Usability — Patrick Durusau @ 9:52 am

Google Visual Assets Guidelines – Part 1 [Link to 2]

From the post:

Google’s brand is shaped in many ways; one of which is through maintaining the visual coherence of our visual assets.

In January 2012, expanding on the new iconography style started by Creative Lab, we began creating this solid, yet flexible, set of guidelines that have been helping Google’s designers and vendors to produce high quality work that helps strengthen Google’s identity.

What you see here is a visual summary of the guidelines, divided into two Behance projects:

Part 1: Product icons and logo lockups
Part 2: User interface icons and Illustrations

This is a real treasure for improving your visual design.

Enjoy!

I first saw this at: Google’s Visual Design Guidelines

June 12, 2013

Easy mapping with Map Stack

Filed under: Interface Research/Design,Mapping,Maps,Usability — Patrick Durusau @ 11:25 am

Easy mapping with Map Stack by Nathan Yau.

Map Stack image

Nathan writes:

It seems like the technical side of map-making, the part that requires code or complicated software installations, fades a little more every day. People get to focus more on actual map-making than on server setup. Map Stack by Stamen is the most recent tool to help you do this.

(…)

It’s completely web-based, and you edit your maps via a click interface. Pick what you want (or use Stamen’s own stylish themes) and save an image. For the time being, the service is open only from 11am to 5pm PST, so just come back later if it happens to be closed.

Over 3,000 maps have been made over the last four days! Examples.

Now to see semantic mapping interfaces improve.

June 5, 2013

Usability & User Experience Community

Filed under: Interface Research/Design,Usability,UX — Patrick Durusau @ 3:51 pm

Usability & User Experience Community

From the webpage:

This web site is a forum to share information and experiences on issues related to the usability and user-centered design. It is the home of the Usability and User Experience Community of the Society for Technical Communication.

Home of the Heuristic Evaluation – A System Checklist resource.

An abundance of usability resources, particularly under “New to Usability?”

Every hour you spend at this site may save users days of unproductive annoyance with your products.

Heuristic Evaluation – A System Checklist

Filed under: Interface Research/Design,Usability,UX — Patrick Durusau @ 3:13 pm

Heuristic Evaluation – A System Checklist by Deniese Pierotti.

An interface review checklist, topic followed by # of questions:

  1. Visibility of System Status (29)
  2. Match Between System and the Real World (24)
  3. User Control and Freedom (23)
  4. Consistency and Standards (51)
  5. Help Users Recognize, Diagnose, and Recover from Errors (21)
  6. Error Prevention (15)
  7. Recognition Rather Than Recall (40)
  8. Flexibility and Minimalist Design (16)
  9. Aesthetic and Minimalist Design (12)
  10. Help and Documentation (23)
  11. Skills (22)
  12. Pleasurable and Respectful Interaction with the User (17)
  13. Privacy (3)

Almost three hundred (300) questions to make you think about your application and its interface.

A good basis for a web form populated with a history of prior ratings and comments, along with space for entry of new ratings and comments.

Being able to upload screen shots would be a nice touch as well.

I may be doing some UI evaluation soon so I will have to keep this in mind.

crowdcrafting

Filed under: Crowd Sourcing,Interface Research/Design,Usability — Patrick Durusau @ 8:04 am

crowdcrafting

Crowdcrafting is an instance of PyBossa:

From the about page:

PyBossa is a free, open-source crowd-sourcing and micro-tasking platform. It enables people to create and run projects that utilise online assistance in performing tasks that require human cognition such as image classification, transcription, geocoding and more. PyBossa is there to help researchers, civic hackers and developers to create projects where anyone around the world with some time, interest and an internet connection can contribute.

PyBossa is different to existing efforts:

  • It’s a 100% open-source
  • Unlike, say, “mechanical turk” style projects, PyBossa is not designed to handle payment or money — it is designed to support volunteer-driven projects.
  • It’s designed as a platform and framework for developing deploying crowd-sourcing and microtasking apps rather than being a crowd-sourcing application itself. Individual crowd-sourcing apps are written as simple snippets of Javascript and HTML which are then deployed on a PyBossa instance \(such as_ CrowdCrafting.org). This way one can easily develop custom apps while using the PyBossa platform to store your data, manage users, and handle workflow.

You can read more about the architecture in the PyBossa Documentation and follow the step-by-step tutorial to create your own apps.

Are interfaces for volunteer projects better than for-hire projects?

Do they need to be?

How would you overcome the gap between “…this is how I see the interface (the developers)…” versus the interface that users prefer?

Hint: 20th century advertising discovered that secret decades ago. See: Predicting What People Want and especially the reference to Selling Blue Elephants.

June 3, 2013

(Re)imagining the Future of Work

Filed under: Crowd Sourcing,Interface Research/Design — Patrick Durusau @ 2:19 pm

(Re)imagining the Future of Work by Tatiana.

From the post:

Here at CrowdFlower, our Product and Engineering teams are a few months into an ambitious project: building everything we’ve learned about crowdsourcing in the past five years as industry leaders into a new, powerful and intuitive platform.

Today, we’re excited to kick off a monthly blog series that gives you an insider pass to our development process.

Here, we’ll cover the platform puzzles CrowdFlower wrestles with everyday:

  • How do we process 4 million human judgments per day with a relatively small engineering team?
  • Which UX will move crowdsourcing from the hands of early adopters into the hands of every business that requires repetitive, online work?
  • What does talent management mean in an online crowd of millions?
  • Can we become an ecosystem for developers who want to build crowdsourcing apps and tools for profit?
  • Most of all: what’s it like to rebuild a platform that carries enormous load… a sort of pit-crewing of the car while it’s hurtling around the track, or multi-organ transplant.

Our first post next week will dive into one of our recent projects: the total rewrite of our worker interface. It’s common lore that engaging in a large code-rewrite project is risky at best, and a company-killer at worst. We’ll tell you how we made it through with only a few minor scrapes and bruises, and many happier workers.

Questions:

How is a crowd different from the people who work for your enterprise?

If you wanted to capture the institutional knowledge of your staff, would the interface look like a crowd-source UI?

Should capturing institutional knowledge be broken into small tasks?

Important lessons for interfaces may emerge from this series!

May 21, 2013

JSME: a free molecule editor in JavaScript

Filed under: Cheminformatics,Editor,Interface Research/Design,Javascript — Patrick Durusau @ 4:48 pm

JSME: a free molecule editor in JavaScript by Bruno Bienfait and Peter Ertl. (Journal of Cheminformatics 2013, 5:24 doi:10.1186/1758-2946-5-24)

Abstract:

Background

A molecule editor, i.e. a program facilitating graphical input and interactive editing of molecules, is an indispensable part of every cheminformatics or molecular processing system. Today, when a web browser has become the universal scientific user interface, a tool to edit molecules directly within the web browser is essential. One of the most popular tools for molecular structure input on the web is the JME applet. Since its release nearly 15 years ago, however the web environment has changed and Java applets are facing increasing implementation hurdles due to their maintenance and support requirements, as well as security issues. This prompted us to update the JME editor and port it to a modern Internet programming language – JavaScript.

Summary

The actual molecule editing Java code of the JME editor was translated into JavaScript with help of the Google Web Toolkit compiler and a custom library that emulates a subset of the GUI features of the Java runtime environment. In this process, the editor was enhanced by additional functionalities including a substituent menu, copy/paste, drag and drop and undo/redo capabilities and an integrated help. In addition to desktop computers, the editor supports molecule editing on touch devices, including iPhone, iPad and Android phones and tablets. In analogy to JME the new editor is named JSME. This new molecule editor is compact, easy to use and easy to incorporate into web pages.

Conclusions

A free molecule editor written in JavaScript was developed and is released under the terms of permissive BSD license. The editor is compatible with JME, has practically the same user interface as well as the web application programming interface. The JSME editor is available for download from the project web page http://peter-ertl.com/jsme/

Just in case you were having any doubts about using JavaScript to power an annotation editor.

Better now?

May 19, 2013

Visual Storytelling – a thing of the past

Filed under: Graphics,Interface Research/Design,Visualization — Patrick Durusau @ 6:46 pm

Visual Storytelling – a thing of the past by Michel Guillet.

From the post:

I spent quite a few summer vacations as a kid getting dragged around Europe visiting castles and churches. It is definitely an experience that I’m more thankful for now than I was at the time. One of the things that I loved most, even as a child, was seeing the stained glass windows. I have strong memories of being in Notre Dame in Paris and watching the light come in at dawn or staring at the Chartres Cathedral windows for minutes without moving.

Chartres

As a boy, it wasn’t the history, the architecture or an admiration of the faith involved to build these churches. Those were concepts beyond my ability, knowledge or frankly interest at the time. What I have come to realize only in the past couple of years is that the windows were meant for me. At the base level, I needed something that could grab my attention and hold it. What I have discovered is that from this standpoint, I am no different than the illiterate masses of the Middle Ages or Renaissance. (emphasis in original)

Michel proceeds to make the art of Chartres Cathedral a lesson in data visualization and graphic presentation.

A very powerful lesson.

Does your interface treat communication with users as important?

You Are Listening to The New York Times

Filed under: Interface Research/Design,Music,News — Patrick Durusau @ 4:05 pm

You Are Listening to The New York Times by Hugh Mandeville.

From the post:

When the San Francisco Giants won the 2010 World Series, the post-victory celebrations got out of control. Revelers smashed windows, got into fistfights and started fires. A Muni bus and the metaverse were both set alight.

To track the chaos, Eric Eberhardt, a techie from the Bay Area, tuned in to a San Francisco police scanner station on soma.fm — while also listening to music. Something about the combination of ambient music and live police chatter clicked for Eberhardt, and youarelistening.to was born.

Eberhardt’s site is a mash-up of three APIs: police scanner audio from RadioReference.com, ambient music from SoundCloud and images from Flickr. The outcome is like a real-time soundtrack to Michael Mann’s movie “Heat.” My colleague Chase Davis, interactive news assistant editor, describes it as “‘Hearts of Space’ meets ‘The Wire.’”

(…)

My explorations inspired me to create a page on youarelistening.to that takes New York Times headlines from the Times Newswire API and reads them aloud using TTS-API.com’s text-to-speech API. I also created a page that reads trending tweets, using Twitter’s Search API.

Definitely has potential to enrich a user experience.

Imagine studying early 21st century history and when George W. Bush or Dick Cheney show up on your ereader, War Pigs plays in the background.

Trivia: Did you know that War Pigs was one of 165 songs that Clear Channel suggested could be inappropriate to play after 9/11? 2001 Clear Channel Memorandum.

Cat Stevens with Peace Train also made the list.

Terrorism we can survive. Those trying to protect us, I’m not so sure.

6 Golden Rules to Successful Dashboard Design

Filed under: Dashboard,Graphics,Interface Research/Design,Visualization — Patrick Durusau @ 3:40 pm

6 Golden Rules to Successful Dashboard Design

From the article:

Dashboards are often created on-the-fly with data being added simply because there is some white space not being used. Different people in the company ask for different data to be displayed and soon the dashboard becomes hard to read and full of meaningless non-related information. When this happens, the dashboard is no longer useful.

This article discusses the steps that need to be taken during the design phase in order to create a useful and actionable dashboard.

Topic maps can be expressed as dashboards as well as other types of interfaces.

Whatever your interface, it needs to be driven by good design principles.

May 17, 2013

Organizing Digital Information for Others

Filed under: Interface Research/Design,Usability,Users,UX — Patrick Durusau @ 4:14 pm

Organizing Digital Information for Others by Maish Nichani. (ebook, no registration required)

From the description:

When we interact with web and intranet teams, we find many struggling to move beyond conceptual-level discussions on information organization. Hours on end are spent on discussing the meaning of “metadata”, “controlled vocabulary” and “taxonomy” without any strategic understanding of how everything fits together. Being so bogged down at this level they fail to look beyond to the main reason for their pursuit—organizing information for others (the end users) so that they can find the information easily.

Web and intranet teams are not the only ones facing this challenge. Staff in companies are finding themselves tasked with organizing, say, hundreds of project documents on their collaboration space. And they usually end up organizing it in the only way they know—for themselves. Team members then often struggle to locate the information that they thought should be in “this folder”!

In this short book, we explore how lists, categories, trees and facets can be better used to organize information for others. We also learn how metadata and taxonomies can connect different collections and increase the findability of information across the website or intranet.

But more than that we hope that this book can start a conversation around this important part of our digital lives.

So let the conversation begin!

The theme of delivering information to others cannot be emphasized enough.

Your notes, interface choices, etc., are just that, your notes, interface choices, etc.

Unless you are independently wealthy, that isn’t a very good marketing model.

Nor are users going to be “trained” to work, search, author, the “right way” in your view.

An introduction to be sure but this short (50 odd pages) work is entertaining and has additional references.

Very much worth the time to read.

« Newer PostsOlder Posts »

Powered by WordPress