Another Word For It Patrick Durusau on Topic Maps and Semantic Diversity

December 20, 2014

Our Favorite Maps of the Year Cover Everything From Bayous to Bullet Trains

Filed under: Mapping,Maps — Patrick Durusau @ 8:48 pm

Our Favorite Maps of the Year Cover Everything From Bayous to Bullet Trains by Greg Miller (Wired MapLab)

From the post:

What makes a great map? It depends, of course, on who’s doing the judging. Teh internetz loves a map with dazzling colors and a simple message, preferably related to some pop-culture phenomenon. Professional mapmakers love a map that’s aesthetically pleasing and based on solid principles of cartographic design.

We love maps that have a story to tell, the kind of maps where the more you look the more you see. Sometimes we fall for a map mostly because of the data behind it. Sometimes, we’re not ashamed to say, we love a map just for the way it looks. Here are some of the maps we came across this year that captivated us with their brains, their beauty, and in many cases, both.

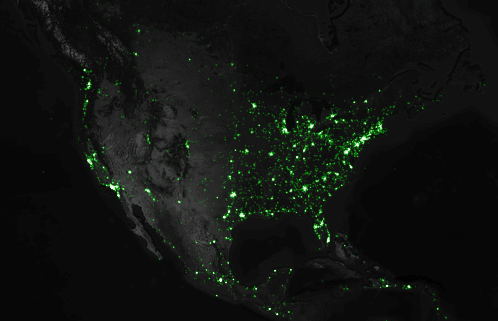
First, check out the animated map below to see a day’s worth of air traffic over the UK, then toggle the arrow at top right to see the rest of the maps in fullscreen mode.

The “arrow at top right” refers to an arrow that appears when you mouse over the map of the United States at the top of the post. An impressive collection of maps!

For an even more impressive display of air traffic:

Bear in mind that there are approximately 93,000 flights per day, zero (0) of which are troubled by terrorists. The next time your leaders decry terrorism, do remember to ask where?

Mapazonia (Mapping the Amazon)

Filed under: Mapping,Maps — Patrick Durusau @ 7:55 pm

Mapazonia (Mapping the Amazon)

From the about page:

Mapazonia has the aim of improve the OSM data in the Amazon region, using satellite images to map roads and rivers geometry.

A detailed cartography will help many organizations that are working in the Amazon to accomplish their objectives. Together we can collaborate to look after the Amazon and its inhabitants.

The project was born as an initiative of the Latinamerican OpenStreetMap Community with the objective of go ahead with collaborative mapping of common areas and problems in the continent.

We use the Tasking Manager of the Humanitarian OpenStreetMap Team to define the areas where we are going to work. Furthermore we will organize mapathons to teach the persons how to use the tools of collaborative mapping.

Normally I am a big supporter of mapping and especially crowd-sourced mapping projects.

However, a goal of an improved mapping of the Amazon makes me wonder who benefits from such a map?

The local inhabitants have known their portions of the Amazon for centuries well enough for their purposes. So I don’t think they are going to benefit from such a map for their day to day activities.

Hmmm, hmmm, who else might benefit from such a map? I haven’t seen any discussion of that topic in the mailing list archives. There seems to be a great deal of enthusiasm for the project, which is a good thing, but little awareness of potential future uses.

Who uses maps of as of yet not well mapped places? Oil, logging, and mining companies, just to name of few of the more pernicious users of maps that come to mind.

To say that the depredations of such users will be checked by government regulations is a jest too cruel for laughter.

There is a valid reason why maps were historically considered as military secrets. One’s opponent could use them to better plan their attacks.

An accurate map of the Amazon will be putting the Amazon directly in the cross-hairs of multiple attackers, with no effective defenders in sight. The Amazon may become as polluted as some American waterways but being unmapped will delay that unhappy day.

I first saw this in a tweet by Alex Barth.

December 15, 2014

TweepsMap

Filed under: Mapping,Twitter — Patrick Durusau @ 8:43 am

TweepsMap

A Twitter analysis service that:

  • Maps your followers by geographic location
  • Measures growth (or decline) of followers over time
  • Listen to what your followers are talking about
  • Action reports, how well you did yesterday
  • Analyze anyone (competitors for example)
  • Assess followers/following
  • Hashtag/Keyword tracking (down to city level)
  • You could do all of this for yourself but TweepsMap has the convenience of simply working. Thus, suitable for passing on to less CS literate co-workers.

    Free account requires you to login with your Twitter account (of course) but the resulting mapping may surprise you.

    I didn’t see it offered but being able to analyze the people you follow would be a real plus. Not just geographically (to make sure you are getting a diverse world view) but by groupings of hashtags. Taking groups of hashtags forming identifiable groups of users who use them. To allow you to judge the groups that you are following.

    I first saw this in a tweet from Alyona Medelyan.

    December 6, 2014

    Making the most detailed tweet map ever

    Filed under: Mapping,Maps,Tweets — Patrick Durusau @ 2:15 pm

    Making the most detailed tweet map ever by Eric Fisher.

    From the post:

    I’ve been tracking geotagged tweets from Twitter’s public API for the last three and a half years. There are about 10 million public geotagged tweets every day, which is about 120 per second, up from about 3 million a day when I first started watching. The accumulated history adds up to nearly three terabytes of compressed JSON and is growing by four gigabytes a day. And here is what those 6,341,973,478 tweets look like on a map, at any scale you want.

    twitter map

    [Static screenshot of a much cooler interactive map at original post.]

    I’ve open sourced the tools I used to manipulate the data and did all the design work in Mapbox Studio. Here’s how you can make one like it yourself.

    Eric gives a detailed account of how you can start tracking tweets on your own!

    This rocks! If you use or adapt Eric’s code, be sure to give him a shout out in your code and/or documentation.

    November 24, 2014

    How to Make a Better Map—Using Neuroscience

    Filed under: Mapping,Maps — Patrick Durusau @ 2:30 pm

    How to Make a Better Map—Using Neuroscience by Laura Bliss.

    From the post:

    The neuroscience of navigation has been big news lately. In September, Nobel Prizes went to the discoverers of place cells and grid cells, the neurons responsible for our mental maps and inner GPS. That’s on top of an ever-growing pile of fMRI research, where scientists connect regions of the brain to specific navigation processes.

    But the more we learn about how our bodies steer from A to B, are cartographers and geographers listening up? Is the science of wayfinding finding its way into the actual maps we use?

    It’s beginning to. CityLab spoke to three prominent geographers who are thinking about the perceptual, cognitive, and neurological processes that go on when a person picks up a web of lines and words and tries to use it—or, the emerging science of map-making.

    The post tackles questions like:

    How do users make inferences from the design elements on a map, and how can mapmakers work to make their maps more perceptually salient?

    But her current research looks at not just how the brain correlates visual information with thematic relevance, but how different kinds of visualization actually affect decision-making.

    “I’m not interested in mapping the human brain,” she says. “A brain area in itself is only interesting to me if it can tell me something about how someone is using a map. And people use maps really differently.”

    Ready to put your map design on more than an ad hoc basis? No definite answers in Laura’s post but several pointers towards exploration yet to be done.

    I first saw this in a tweet by Greg Miller.

    November 12, 2014

    Mapnik

    Filed under: Mapping,Maps — Patrick Durusau @ 8:31 pm

    Mapnik

    From the FAQ:

    What is mapnik?

    Mapnik is a Free Toolkit for developing mapping applications. It’s written in C++ and there are Python bindings to facilitate fast-paced agile development. It can comfortably be used for both desktop and web development, which was something I wanted from the beginning.

    Mapnik is about making beautiful maps. It uses the AGG library and offers world class anti-aliasing rendering with subpixel accuracy for geographic data. It is written from scratch in modern C++ and doesn’t suffer from design decisions made a decade ago. When it comes to handling common software tasks such as memory management, filesystem access, regular expressions, parsing and so on, Mapnik doesn’t re-invent the wheel, but utilizes best of breed industry standard libraries from boost.org

    Which platforms does it run on?

    Mapnik is a cross platform toolkit that runs on Windows, Mac, and Linux (Since release 0.4). Users commonly run Mapnik on Mac >=10.4.x (both intel and PPC), as well as Debian/Ubuntu, Fedora, Centos, OpenSuse, and FreeBSD. If you run Mapnik on another Linux platform please add to the list on the Trac Wiki

    What data formats are supported?

    Mapnik uses a plugin architecture to read different datasources. Current plugins can read ESRI shapefiles, PostGIS, TIFF raster, OSM xml, Kismet, as well as all OGR/GDAL formats. More data access plug-ins will be available in the future. If you cannot wait and/or like coding in C++, why not write your own data access plug-in?

    What are the plans for the future?

    As always, there are lots of things in the pipeline. Sign up for the mapnik-users list or mapnik-devel list to join the community discussion.

    Governments as well as NGOs need mapping applications.

    What mapping application will you create? What data will it merge on the fly for your users?

    November 11, 2014

    I/O Problem @ OpenStreetMap France

    Filed under: Clustering,Mapping,Maps,Topic Maps — Patrick Durusau @ 2:54 pm

    Benefit of data clustering for osm2pgsql/mapnik rending by Christian Quest.

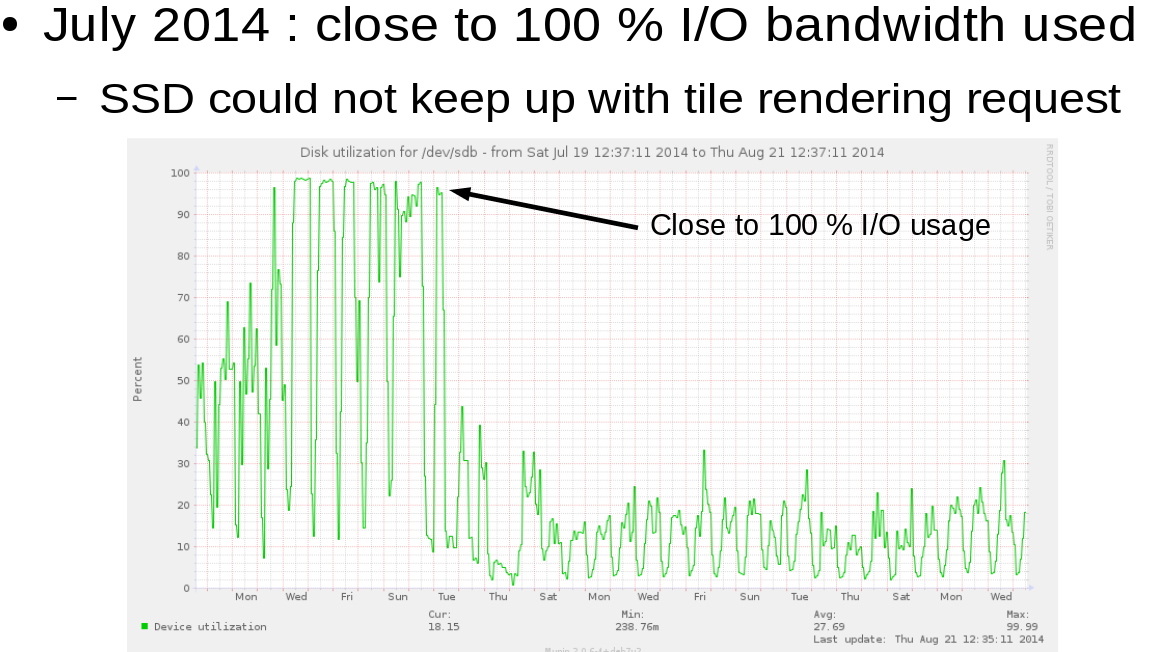
    The main server for OpenStreetMap France had an I/O problem:

    OSM-FR

    See Christian’s post for the details but the essence of the solution was to cluster geographic data on the basis of its location. To reduce the amount of I/O. Not unlike randomly seeking topics with similar characteristics.

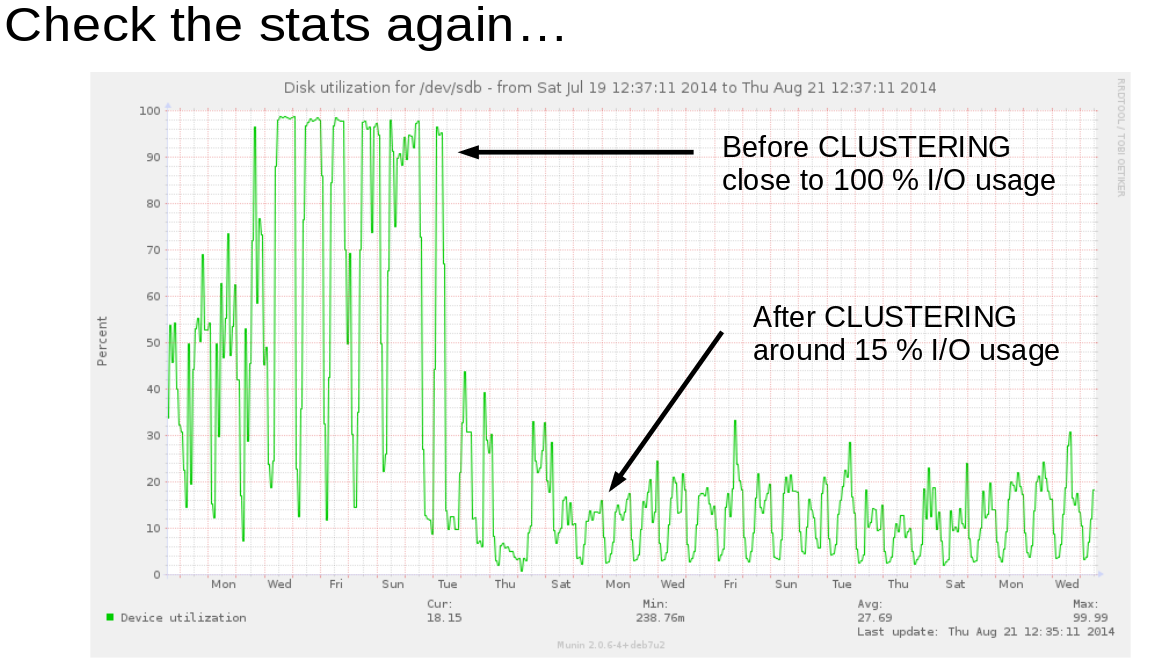
    How much did clustering reduce the I/O?

    OSM-FR stats

    Nearly 100% I/O was reduced to 15% I/O. 85% improvement.

    An 85% improvement in I/O doesn’t look bad on a weekly/monthly activity report!

    Now imagine clustering topics for dynamic merging and presentation to a user. Among other things, you can have an “auditing” view that shows all the topics that will merge to form a single topic in a presentation view.

    Or a “pay-per-view” view that uses a different cluster to reveal more information for paying customers.

    All while retaining the capacity to produce a serialized static file as an information product.

    Crimebot

    Filed under: Mapping,Open Data — Patrick Durusau @ 8:41 am

    Open Data On the Ground: Jamaica’s Crimebot by Samuel Lee.

    From the post:

    Some areas of Jamaica, particularly major cities such as Kingston and Montego Bay, experience high levels of crime and violence. If you were to type, “What is Jamaica’s biggest problem” in a Google search, you’ll see that the first five results are about crime.

    (image omitted)

    Using data to pinpoint high crime areas

    CrimeBot (www.crimebot.net) fights crime by providing crime hotspot views and sending out alerts based on locations through mobile devices. By allowing citizens to submit information about suspicious activity in real-time, CrimeBot also serves as a tool to fight back against crime and criminals. As its base of users grow and information expands, CrimeBot can more accurately pinpoint areas of higher crime frequency for informed and improved public safety. Developed by a team in Jamaica, CrimeBot improves the “neighborhood watch” concept by applying mobile technology to information dissemination and real-time data collection. A Google Hangout discussion with CrimeBot team member Dave Oakley can be viewed through this link.

    Data collection technology that helps reduce violence and crime

    The CrimeBot team – Kashif Hewitt, Dave Oakley, Aldrean Smith, Garth Thompson – came together in the lead up to a Caribbean apps competition in Jamaica called Digital Jam 3, in which CrimeBot was awarded the top prize. Prior to entering the contest, the group researched the most pressing issues in the Caribbean and Jamaica, which turned out to be violence and crime.

    (image omitted)

    The team decided to help Jamaicans fight and reduce crime by taking a deeper look at international statistics and conducting interviews with potential users of the app among friends and other contacts. In just 19 days of development, the team took CrimeBot from concept to working prototype.

    The team discovered that 58% of crimes around the world go unreported. Interviews with potential users of the app revealed that many would-be tipsters feared for their safety, lacked confidence in local authorities, or preferred to take matters into their own hands. To counter some of these barriers, CrimeBot offers an anonymous way to report crime. While this doesn’t directly solve crimes, CrimeBot provides law enforcement officials with better data, intelligence, and affords citizens and tourists greater protection through preventative measures.

    Crimebot is of particular interest because it includes unreported crimes, which don’t show up in maps constructed on the basis of arrests.

    One can imagine real time crime maps at a concierge desk with offers from local escort (in the traditional sense) services.

    Or when merged with other records, the areas with the lowest conviction rates and/or prison sentences.

    The project also has a compelling introduction video:

    November 8, 2014

    An Open Platform (MapBox)

    Filed under: MapBox,Mapping,Maps — Patrick Durusau @ 2:04 pm

    An Open Platform (Mapbox)

    From the post:

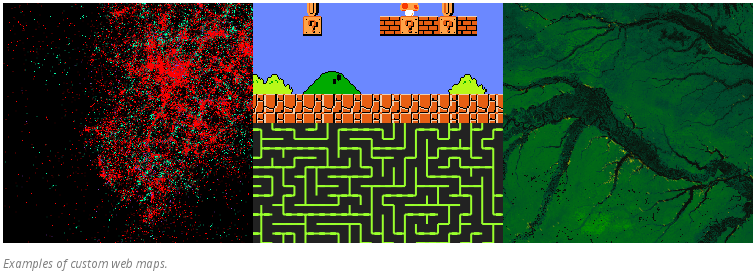
    When you hear the term web map, what comes to mind first? You might have thought of a road map – maps created to help you get from one place to another. However, there are many other types of maps that use the same mapping conventions.

    maps

    Mapbox is built from open specifications to serve all types of maps, not just road maps. Open specifications solve specific problems so the solution is simple and direct.

    This guide runs through all the open specifications Mapbox uses.

    If you aren’t familiar with Mapbox, you need to correct that oversight.

    There are Starter (free to start) and Basic ($5/month) plans, so it isn’t a burden to learn the basics.

    Maps offer a familiar way to present information to users.

    October 21, 2014

    The Cartographer Who’s Transforming Map Design

    Filed under: Cartography,Mapping,Maps — Patrick Durusau @ 7:30 pm

    The Cartographer Who’s Transforming Map Design by Greg Miller.

    From the post:

    Cindy Brewer seemed to attract a small crowd everywhere she went at a recent cartography conference here. If she sat, students and colleagues milled around, waiting for a chance to talk to her. If she walked, a gaggle of people followed.

    Brewer, who chairs the geography program at Penn State, is a popular figure in part because she has devoted much of her career to helping other people make better maps. By bringing research on visual perception to bear on design, Brewer says, cartographers can make maps that are more effective and more intuitive to understand. Many of the same lessons apply equally well to other types of data visualization.

    Brewer’s best-known invention is a website called Color Brewer, which helps mapmakers pick a color scheme that’s well-suited for communicating the particular type of data they’re mapping. More recently she’s moved on to other cartographic design dilemmas, from picking fonts to deciding what features should change or disappear as the scale of a map changes (or zooms in and out, as non-cartographers would say). She’s currently helping the U.S. Geological Survey apply the lessons she’s learned from her research to redesign its huge collection of national topographic maps.

    A must read if you want to improve the usefulness of your interfaces.

    I say a “must read,” but this is just an overview of Cindy’s work.

    A better starting place would be Cindy’s homepage at UPenn.

    October 12, 2014

    Twitter Mapping: Foundations

    Filed under: Mapping,Maps,Tweets — Patrick Durusau @ 10:32 am

    Twitter Mapping: Foundations by Simon Rogers.

    From the post:

    With more than 500 million tweets sent every day, Twitter data as a whole can seem huge and unimaginable, like cramming the contents of the Library of Congress into your living room.

    One way of trying to make that big data understandable is by making it smaller and easier to handle by giving it context; by putting it on a map.

    It’s something I do a lot—I’ve published over 1,000 maps in the past five years, mostly at Guardian Data. At Twitter, with 77% of users outside the US, it’s often aimed at seeing if regional variations can give us a global picture, an insight into the way a story spreads around the globe. Here’s what I’ve learned about using Twitter data on maps.

    … (lots of really cool maps and links omitted)

    Creating data visualizations is simpler now than it’s ever been, with a plethora of tools (free and paid) meaning that any journalist working in any newsroom can make a chart or a map in a matter of minutes. Because of time constraints, we often use CartoDB to animate maps of tweets over time. The process is straightforward—I’ve written a how-to guide on my blog that shows how to create an animated map of dots using the basic interface, and if the data is not too big it won’t cost you anything. CartoDB is also handy for other reasons: as it has access to Twitter data, you can use it to get the geotagged tweets too. And it’s not the only one: Trendsmap is a great way to see location of conversations over time.

    Have you made a map with Twitter Data that tells a compelling story? Share it with us via @TwitterData.

    While composing this post I looked at CartoDB solution for geotagged tweets and while impressive, it is currently in beta with a starting price of $300/month. Works if you get your expenses paid but a bit pricey for occasional use.

    There is a free option for CartoDB (up to 50 MB of data) but I don’t think it includes the twitter capabilities.

    Sample mapping tweets on your favorite issues. Maps are persuasive in ways that are not completely understood.

    October 11, 2014

    Making Your First Map

    Filed under: MapBox,Mapping,Maps — Patrick Durusau @ 1:09 pm

    Making Your First Map from Mapbox.

    From the webpage:

    Regardless of your skill level, we have the tools that allow you to quickly build maps and share them online in minutes.

    In this guide, we’ll cover the basics of our online tool, the Mapbox Editor, by creating a store location map for a bike shop.

    A great example of the sort of authoring interface that is needed by topic maps.

    Hmmm, by the way, did you notice that “…creating a store location map for a bike shop” is creating an association between the “bike shop” and a “street location?” True, Mapbox doesn’t include roles or the association type but the role players are present.

    For a topic map authoring interface, you could default the role of location for any geographic point on the map and the association type to be “street-location.”

    The user would only have to pick, possibly from a pick list, the role of the role player, bike shop, bar, etc.

    Mapbox could have started their guide with a review of map projections, used and theoretical.

    Or covered the basics of surveying and a brief overview of surveying instruments. They didn’t.

    I think there is a lesson there.

    The 100 Worst Landlords in New York City [Here Be Bastards]

    Filed under: Mapping,Maps — Patrick Durusau @ 11:17 am

    The 100 Worst Landlords in New York City

    A great illustration of the power of mapping to bring information together! (Like a topic map does.)

    I don’t live in New York so the classes of violations (mis-named “details”) wasn’t helpful to me. Nor were the actual “details” of particular violations available. (If I am wrong on that, please post a response saying how to obtain the details via the map interface.)

    Suggested Improvement: Names of owners as hyperlinks to their residences on a map with the notation “Here Be Bastards” (a riff off of the “Here Be Dragons” from early sea maps).

    October 10, 2014

    Super-Detailed Interactive 3-D Seafloor Map

    Filed under: Mapping,Maps,Oceanography — Patrick Durusau @ 9:47 am

    Super-Detailed Interactive 3-D Seafloor Map by Nick Stockton.

    From the post:

    This super-detailed map of the ocean floor’s topography is based on satellite measurements of subtle lumps on the ocean’s surface. These lumps of water, which are subtle, low, and wide on the ocean’s surface, are caused by the gravitational pull of underwater features like mountains and ridges. The team of scientists wrapped their data around a Google Earth globe, so you and I could explore it ourselves, in the visualization above.

    The map has more than twice the resolution of previous seafloor maps, and shows a plethora of never-before-seen features. These include thousands of volcanoes and what could be the ridge where two plates pulled apart to create the Gulf of Mexico. The map is part of new research published last week in Science.

    The visualization at the top of the page (click here for a full screen view) lets you play with the vertical exaggeration of both continental and subsea topography using the upper left drop-down menu. (They might seem huge to us at ground level, but the planet’s mountains and valleys are almost imperceptible from the vantage of space.) Another visualization of the study’s map lets you drag a time bar to simulate the movement of tectonic plates.

    Great seafloor map and visualization techniques!

    Read Nick’s post to get some background on “gravitational mapping.” In short, gravitational mapping relies on the impact of features of the seafloor on ocean height to create detailed seafloor maps.

    Sounds like very interesting data sets with many discoveries left to be made.

    September 15, 2014

    A Guide To Who Hates Whom In The Middle East

    Filed under: Associations,Mapping,Maps — Patrick Durusau @ 7:01 pm

    A Guide To Who Hates Whom In The Middle East by John Brown Lee.

    John reviews an interactive visualization of players with an interest in the Middle East by David McCandless of Information is Beautiful.

    The full interactive version of The Middle East Key players & notable relationships.

    I would use this graphic with caution, mostly because if you select Jordan, it show no relationship to Israel. As you know, Jordan signed a peace agreement with Israel twenty years ago and Israel recently agreed to sell gas to Jordan’s state-owned National Electric Power Co.

    Nor does it show any relationship between Turkey and the United States. At the very least, the United States and Turkey have a complicated relationship. Would you include the reported pettiness of Senator John McCain towards Turkey in an enhanced map?

    Not to take anything away from a useful way to explore the web of relationships in the Middle East but more in the nature of a request for a fuller story.

    Uncovering Hidden Text on a 500-Year-Old Map That Guided Columbus

    Filed under: Mapping,Maps — Patrick Durusau @ 4:20 pm

    Uncovering Hidden Text on a 500-Year-Old Map That Guided Columbus by Greg Miller.

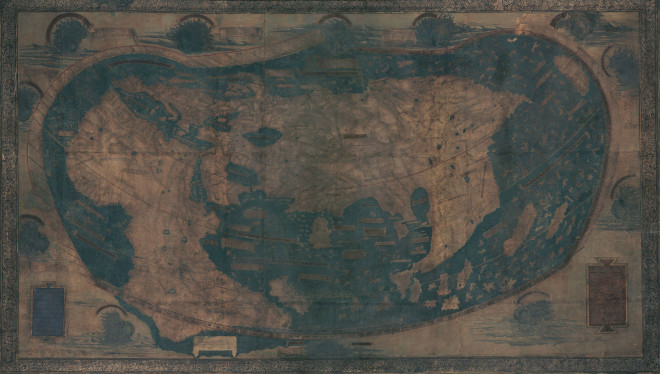
    Martellus map

    Christopher Columbus probably used the map above as he planned his first voyage across the Atlantic in 1492. It represents much of what Europeans knew about geography on the verge discovering the New World, and it’s packed with text historians would love to read—if only the faded paint and five centuries of wear and tear hadn’t rendered most of it illegible.

    But that’s about to change. A team of researchers is using a technique called multispectral imaging to uncover the hidden text. They scanned the map last month at Yale University and expect to start extracting readable text in the next few months, says Chet Van Duzer, an independent map scholar who’s leading the project, which was funded by the National Endowment for the Humanities.

    The map was made in or around 1491 by Henricus Martellus, a German cartographer working in Florence. It’s not known how many were made, but Yale owns the only surviving copy. It’s a big map, especially for its time: about 4 by 6.5 feet. “It’s a substantial map, meant to be hung on a wall,” Van Duzer said.

    Extracting the text is going to take some effort but expectations are that high resolution images will appear at the Beinecke Digital Library at Yale in 2015.

    Greg covers a number of differences between the Martellus map (1491) and the Waldseeüller map (1507), as well as their places in historical context.

    You should pass this post onto any friends who think Columbus “discovered” the world was round. I don’t see any end of the world markers on the Martellus map.

    Do you?

    September 13, 2014

    Why Use Google Maps When You Can Get GPS Directions On The Death Star Instead?

    Filed under: Graphics,MapBox,Mapping,Maps — Patrick Durusau @ 5:05 pm

    Why Use Google Maps When You Can Get GPS Directions On The Death Star Instead? by John Brownlee.

    From the post:

    Mapbox Studio is a toolkit that allows apps and websites to serve up their own custom-designed maps to users. Companies like Square, Pinterest, Foursquare, and Evernote con provide custom-skinned Mapboxes instead, changing map elements to better fit in with their brand.

    But Mapbox can do far cooler stuff. It can blast you to Space Station Earth, a Mapbox that makes the entire planet look like the blinking, slate gray skin of the Star Wars Death Star.

    Great if your target audience are Star Wars or similar science fiction fans or you can convince management that it will hold the attention of users longer.

    Even routine tasks, like logging service calls answered, would be more enjoyable using an X-Wing fighter to destroy the location of the call after service has been completed. 😉

    First map of Rosetta’s comet

    Filed under: Astroinformatics,Mapping,Maps — Patrick Durusau @ 6:15 am

    First map of Rosetta’s comet

    From the webpage:

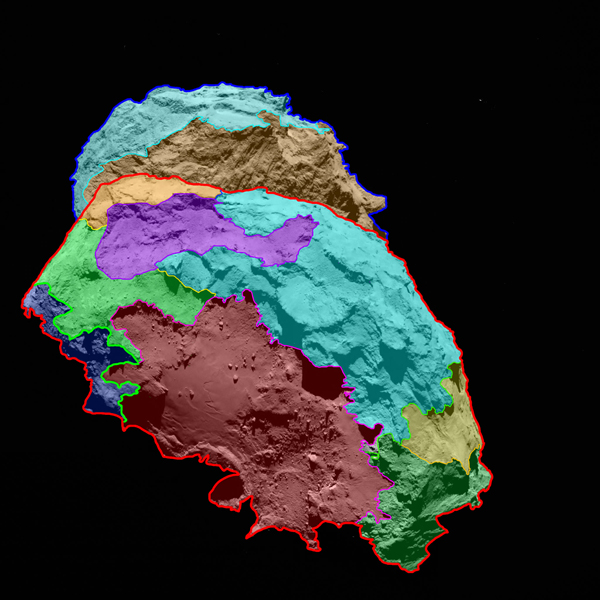
    Scientists have found that the surface of comet 67P/Churyumov-Gerasimenko — the target of study for the European Space Agency’s Rosetta mission — can be divided into several regions, each characterized by different classes of features. High-resolution images of the comet reveal a unique, multifaceted world.

    ESA’s Rosetta spacecraft arrived at its destination about a month ago and is currently accompanying the comet as it progresses on its route toward the inner solar system. Scientists have analyzed images of the comet’s surface taken by OSIRIS, Rosetta’s scientific imaging system, and defined several different regions, each of which has a distinctive physical appearance. This analysis provides the basis for a detailed scientific description of 67P’s surface. A map showing the comet’s various regions is available at: http://go.nasa.gov/1pU26L2

    “Never before have we seen a cometary surface in such detail,” says OSIRIS Principal Investigator Holger Sierks from the Max Planck Institute for Solar System Science (MPS) in Germany. In some of the images, one pixel corresponds to a scale of 30 inches (75 centimeters) on the nucleus. “It is a historic moment — we have an unprecedented resolution to map a comet,” he says.

    The comet has areas dominated by cliffs, depressions, craters, boulders and even parallel grooves. While some of these areas appear to be quiet, others seem to be shaped by the comet’s activity, in which grains emitted from below the surface fall back to the ground in the nearby area.

    comet

    The Rosetta mission:

    Rosetta launched in 2004 and will arrive at comet 67P/Churyumov-Gerasimenko on 6 August. It will be the first mission in history to rendezvous with a comet, escort it as it orbits the Sun, and deploy a lander to its surface. Rosetta is an ESA mission with contributions from its member states and NASA. Rosetta’s Philae lander is provided by a consortium led by DLR, MPS, CNES and ASI.

    Not to mention being your opportunity to watch semantic diversity develop from a known starting point.

    Already the comet has two names: (1 67P/Churyumov-Gerasimenko and 2) Rosetta’s comet. Can you guess which one will be used in the popular press?

    Surface features will be described in different languages, which have different terms for features and the processes that formed them. Not to mention that even within natural languages there can be diversity as well.

    Semantic diversity is our natural state. Normalization is an abnormal state, perhaps that is why it is so elusive on a large scale.

    September 8, 2014

    Shoothill GaugeMap

    Filed under: Mapping,Maps — Patrick Durusau @ 12:47 pm

    Shoothill GaugeMap

    From the about page:

    The Shoothill GaugeMap is the first interactive map with live river level data from over 2,400 Environment Agency and Natural Resources Wales river level gauges in England and Wales.

    The extensive network of river level gauges across England and Wales covers all the major rivers as well as many smaller rivers, streams and brooks. The data displayed on each of the river level gauges on GaugeMap is recorded at 15 minute intervals by the Environment Agency and Natural Resources Wales.

    For more information on how to use GaugeMap, please see the help file.

    If you live in England or Wales and are concerned about potential flooding, this may be the map for you!

    The map reports data from 2400 river level gauges and you can follow individual gauges via Twitter.

    I first saw this in a tweet by Rod Plummer.

    In case you are interested in other river gauge information:

    RiverGauges.com USA only but excludes most of Texas, Georgia, Florida, and most of the Eastern seaboard. Not sure why. Has historical and current data.

    RiverApp USA and Europe, over 1,000 rivers. Can’t really comment since I don’t have a smart phone. (Contact me for an smail address if you want to donate a recent smart phone.)

    September 2, 2014

    Maps Published on GOV.UK

    Filed under: Mapping,Maps — Patrick Durusau @ 6:34 am

    How to find all the maps published on GOV.UK by Giles Turnbull.

    A “trick” you need to note for finding all the maps published on GOV.UK.

    I don’t know of any comparable “trick” or even a single location for all the maps published by the United States government. If you were to include state and local governments, the problem would be even worse.

    If you know of cross-agency map directories in the United States (or elsewhere), please sing out!

    Thanks!

    August 19, 2014

    Complete Antarctic Map

    Filed under: Environment,Mapping,Maps — Patrick Durusau @ 1:31 pm

    Waterloo makes public most complete Antarctic map for climate research

    From the post:

    The University of Waterloo has unveiled a new satellite image of Antarctica, and the imagery will help scientists all over the world gain new insight into the effects of climate change.

    Thanks to a partnership between the Canadian Space Agency (CSA), MacDonald, Dettwiler and Associates Ltd. (MDA), the prime contractor for the RADARSAT-2 program, and the Canadian Cryospheric Information Network (CCIN) at UWaterloo, the mosaic is free and fully accessible to the academic world and the public.

    Using Synthetic Aperture Radar with multiple polarization modes aboard the RADARSAT-2 satellite, the CSA collected more than 3,150 images of the continent in the autumn of 2008, comprising a single pole-to-coast map covering all of Antarctica. This is the first such map of the area since RADARSAT-1 created one in 1997.

    You can access the data at: Polar Data Catalogue.

    From the Catalogue homepage:

    The Polar Data Catalogue is a database of metadata and data that describes, indexes, and provides access to diverse data sets generated by Arctic and Antarctic researchers. The metadata records follow ISO 19115 and Federal Geographic Data Committee (FGDC) standard formats to provide exchange with other data centres. The records cover a wide range of disciplines from natural sciences and policy, to health and social sciences. The PDC Geospatial Search tool is available to the public and researchers alike and allows searching data using a mapping interface and other parameters.

    What data would you associate with such a map?

    I first saw this at: Most complete Antarctic map for climate research made public.

    August 5, 2014

    Mapping Phone Calls

    Filed under: Mapping,Maps,Visualization — Patrick Durusau @ 12:52 pm

    Map: Every call Obama has made to a foreign leader in 2014 by Max Fisher.

    From the post:

    What foreign leaders has Obama spoken to this year? Reddit user nyshtick combed through official White House press releases to make this map showing every phone call Obama has made in 2014 to another head of state or head of government. The results are revealing, a great little window into the year in American foreign policy so far:

    It’s a visual so you need to visit Max’s post to see the resulting world map.

    I think you will be surprised.

    There is another lesson lurking in the post.

    The analysis did not require big data, distributed GPU compuations or category theory.

    What it did require was:

    • An interesting question: “What foreign leaders has Obama spoken to this year?”
    • A likely data set: press releases
    • A user willing to dig through the data and to create a visualization.

    Writing as much to myself as to anyone:

    Don’t overlook smallish data with simple visualizations. (If you goal is impact and not the technology you used.)

    August 1, 2014

    Interactive Map: First World War: A Global View

    Filed under: History,Mapping,Maps — Patrick Durusau @ 2:47 pm

    Interactive Map: First World War: A Global View by UkNatArchives.

    From the pop-up when you visit the map:

    A global view

    Explore the global impact of the First World War through our interactive map, which highlights key events and figures in countries from Aden to Zanzibar. Drawn directly from our records at The National Archives, the map aims to go beyond the trenches of the Western Front and shows how the war affected different parts of the world.

    The First World War: A global view is part of our First World War 100 programme. It currently focuses on the contributions of the countries and territories that made up the British Empire during wartime. We will continue to develop the map over the next four years, to show more countries and territories across Europe, the Middle East, the Americas, Africa and Asia.

    About this map

    To get started, select a country or territory by clicking on a marker Map maker icon on the map, or select a name from the list on the left. Navigate through the tabs to read about battles, life on the Home Front and much more. Each country or territory is illustrated with images, maps and other documents from our collections. Click on the references to find key documents in Discovery, our catalogue, or images in our image library.

    To reflect changing borders and names since 1914, we have provided two map views. Switch between the global map as it was during wartime, and as it is today, by using the buttons at the top of the map.

    My assumptions about certain phrases do jump up to bite me every now and again. This was one of those cases.

    I think I know what is meant by “First World War,” and “A Global View.” And even the language about “changing borders and names since 1914,” makes sense given the rise of so many new nations in the last century.

    Hence, my puzzlement when I looked at the Country/Territory list only to see:

    Aden Jamaica
    Anglo-Egyptian Sudan Leeward Islands
    Ascension Island Malaya
    Australia Maldives
    Barbados Malta
    Bermuda Mauritius
    Britian New Zealand
    British East Africa Newfoundland
    British Gold Coast Nigeria
    British Honduras Northern Rhodesia
    British New Guinea and German New Guinea Nyasaland
    British North Borneo and Sarawak Pacific Islands
    Burma Seychelles
    Canada Sierra Leone
    Ceylon Straits Settlements
    Cocos (Keeling) Islands Southern Rhodesia
    Cyprus St Helena
    Egypt The Gambia
    Falkland Islands Trinidad and Tobago
    Gibraltar Uganda
    Hong Kong and Wei-Hai-Wei Windward Islands
    India Zanzibar

    In my history lessons, I had learned there were many other countries that were involved in World War I, especially from a “global” view. 😉

    My purpose is not to disagree with the definition of World War I or “global perspective” used by the UK National Archive. It is their map and they are free to use whatever definitions seem appropriate to their purpose.

    My point is that even common phrases, such as World War I and “global perspective” can be understood in radically different ways by different readers of the same text.

    For an American class, I would re-title this resources as England and its territories during World War I. To which a UK teacher could rightly reply, “That’s what we said.”

    More examples of unexpected semantic dissonance welcome!

    PS: You should be following The National Archives (UK). Truly a remarkable effort.
    July 27, 2014

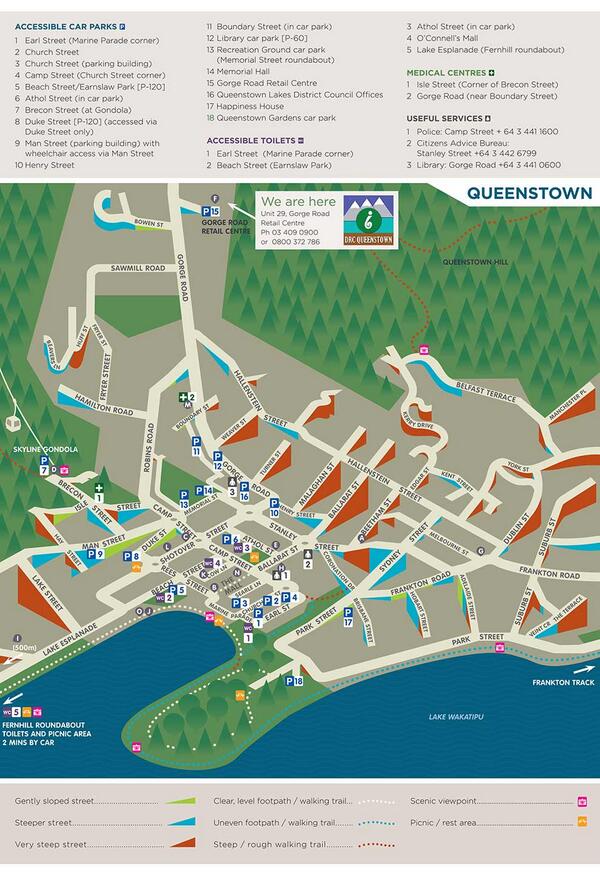
    Street Slope Map

    Filed under: Mapping,Maps — Patrick Durusau @ 4:38 pm

    A neat idea for maps:

    street slope map

    See on Twitter.

    I can think of a number of use cases for street slope information. Along with surveillance camera coverage, average lighting conditions, average police patrols, etc.

    I first saw this in a tweet by Bob Lehman.

    July 24, 2014

    How to Make a Complete Map…

    Filed under: Books,Mapping,Maps — Patrick Durusau @ 6:57 pm

    How to Make a Complete Map of Every Thought You Think by Lion Kimbro.

    From the introduction:

    This book is about how to make a complete map of everything you think for as long as you like.

    Whether that’s good or not, I don’t know- keeping a map of all your thoughts has a “freezing” effect on the mind. It takes a lot of (albeit pleasurable) work, but produces nothing but SIGHT.

    If you do the things described in this book, you will be IMMOBILIZED for the duration of your commitment.The immobilization will come on gradually, but steadily. In the end, you will be incapable of going somewhere without your cache of notes, and will always want a pen and paper w/ you. When you do not have pen and paper, you will rely on complex memory pegging devices, described in “The Memory Book”. You will NEVER BE WITHOUT RECORD, and you will ALWAYS RECORD.

    YOU MAY ALSO ARTICULATE. Your thoughts will be clearer to you than they have ever been before. You will see things you have never seen before. When someone shows you one corner, you’ll have the other 3 in mind. This is both good and bad. It means you will have the right information at the right time in the right place. It also means you may have trouble shutting up. Your mileage may vary.

    You will not only be immobilized in the arena of action, but you will also be immobilized in the arena of thought. This appears to be contradictory, but it’s not really. When you are writing down your thoughts, you are making them clear to yourself, but when you revise your thoughts, it requires a lot of work- you have to update old ideas to point to new ideas. This discourages a lot of new thinking. There is also a “structural integrity” to your old thoughts that will resist change. You may actively not-think certain things, because it would demand a lot of note keeping work. (Thus the notion that notebooks are best applied to things that are not changing.)
    ….

    Sounds bizarre. Yes?

    Here is how the BBC’s Giles Turnbull summarized the system:

    The system breaks down into simple jottings made during the day – what he calls “speeds”. These can be made on sheets of paper set aside for multiple subjects, or added directly to sheets dedicated to a specific subject. Speeds are made on the fly, as they happen, and it’s up to the writer to transcribe these into another section of the notebook system later on.

    Lion suggests using large binders full of loose sheets of paper so that individual sheets can be added, removed and moved from one place to another. Notes can be given subjects and context hints as they are made, to help the writer file them into larger, archived binders when the time comes to organise their thoughts.

    Even so, the writer is expected to carry one binder around with them at all times, and add new notes as often as possible, augmented with diagrams, arrows and maps.

    With that summary description, it becomes apparent that Lion has reinvented the commonplace book, this one limited to your own thoughts.

    Have you thought any more about how to create a digital commonbook interface?

    July 7, 2014

    OpenStreetMap Nears Ten

    Filed under: Mapping,Maps,OpenStreetMap — Patrick Durusau @ 3:17 pm

    OpenStreetMap – What’s next for the ‘Wikipedia of mapping” as it turns 10? by Ed Freyfogle.

    From the post:

    OpenStreetMap (OSM) has come a long way. After starting almost 10 years ago in London, OSM is now an entrenched part of the geo/location-based service toolchain and one of the leading examples of crowdsourcing at a massive scale.

    Since 2004, over 1.5 million volunteers have signed up to contribute terabytes of geo-data to the project often referred to as the “Wikipedia of mapping”. What began as one guy wandering around London with his GPS has now turned into a global movement and spawned countless spinoff projects (see: WheelMap, OpenCycleMap and OpenRailwayMap).

    Ed details the amazing progress that OpenStreetMap has made in ten years but also mentions diversity, governance and licensing issues that continue to hold OSM back from greater adoption.

    Another concern is breadth of coverage:

    A recent study found that just five countries make up 58% of OpenStreetMap’s data coverage. It needs to be asked what dynamics are preventing local communities from forming around the world. Is OSM just a ‘rich world’ phenomenon?

    A difference in perspective. I would be thrilled to have the level of participation for topic maps that OSM has, even if it were mostly limited to five countries.

    My question would be what is it about mapping physical terrain or the interfaces for mapping it, that makes it more attractive than mapping subjects and how they are identified?

    Is there a lesson here for topic maps?

    On the licensing issue, I hopeful OSM will adopt an Apache license. The rosters of Apache projects with their corporate sponsored participants and commercial products based on those projects are the best evidence for Apache licensing on a project.

    That is, assuming being successful is more important to you than some private notion of purity. I recommend successful.

    July 2, 2014

    Maps need context

    Filed under: Mapping,Maps — Patrick Durusau @ 6:33 pm

    Maps need context by Jon Schwabish and Bryan Connor.

    From the post:

    It might be the case that maps are the most data-dense visualizations. Consider your basic roadmap: it includes road types (highways, toll roads), directions (one-way, two-way), geography (rivers, lakes), cities, types of cities (capitals), points of interest (schools, parks), and distance. Maps that encode statistical data, such as bubble plots or choropleth maps, are also data-dense and replace some of these geographic characteristics with different types of data encodings. But lately we’ve been wondering if most maps fail to convey enough context.

    As an example, consider this map of poverty rates by districts in India. It’s a fairly simple choropleth map and you can immediately discern different patterns: high poverty rates are concentrated in the districts in the northernmost part of the country, on part of the southeast border, and in a stretch across the middle of the country. Another set of high-poverty areas can be found in the land mass in the northeast part of the map. But here’s the thing: we don’t know much about India’s geography. Without some context—plotting cities or population centers—we can only just guess what this map is telling me.

    Many readers will be more familiar with the geography of the United States. So when maps like this one from the Census Bureau show up, we are better equipped to understand it because we’re familiar with areas such as the high-poverty South and around the Texas-Mexico border. But then again, what about readers familiar with basic U.S. geography, but not familiar with patterns of poverty? How useful is this map for them?

    In addition to establishing the potential need for more context, Jon and Bryan go on to describe a tool for building and comparing maps with different data sets included.

    You should take context into account in deciding what groups of topics and associations to merge into or leave out of a topic map. Too much detail and your user may lose sight of the forest. Too little and they may not be able to find it at all.

    June 24, 2014

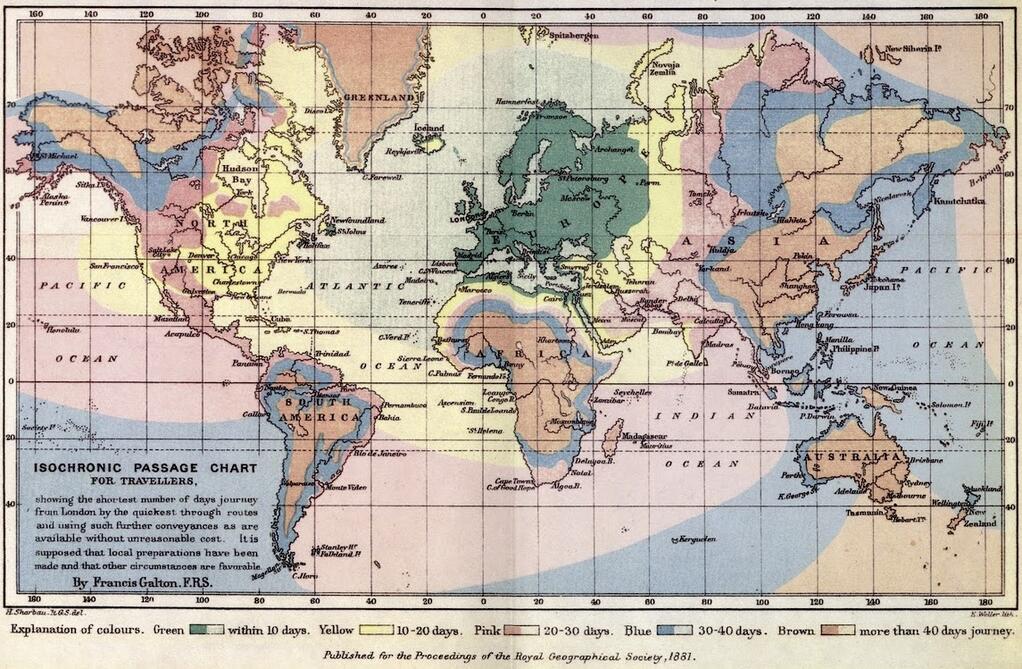
    Isochronic Passage Chart for Travelers

    Filed under: Mapping,MARC,Visualization — Patrick Durusau @ 4:10 pm

    isochronic map

    From the blog of Arthur Charpentier, Somewhere Else, part 142

    (departing from London, ht http://mapsontheweb.zoom-maps.com/ ) by Francis Galton, 1881

    A much larger image that is easier to read.

    Although not on such a grand scale, an isochronic passage map for data could be interesting for your enterprise.

    How much time does elapse from your request until a response from another department or team?

    Presented visually, with this map as a reference for the technique, your evidence of data bottlenecks could be persuasive!

    June 23, 2014

    How Mapbox Works

    Filed under: MapBox,Mapping,Maps — Patrick Durusau @ 6:59 pm

    How Mapbox Works

    From the post:

    Mapbox is a platform for creating and using maps. That means that it’s a collection of tools and services that connect together in different ways: you can draw a map on the website, use it on an iPhone, and get raw data from an API.

    Let’s look at the parts and how they connect.

    Great post!

    Just in time if you have been considering Iraq in 27 Maps and how some of the maps are just “wrong” from your point of view.

    Using modern mapping technology, users are no longer relegated to passive acceptance of the maps of others.

    Iraq in 27 Maps

    Filed under: History,Mapping,Maps — Patrick Durusau @ 6:00 pm

    27 maps that explain the crisis in Iraq by Zack Beauchamp, Max Fisher and Dylan Matthews.

    From the post:

    The current Iraq crisis began in early June, when the extremist group Islamic State of Iraq and the Levant (ISIS), which already controls parts of Syria, seized much of northern Iraq, including the major city of Mosul. The conflict has roots in Iraq’s complicated history, its religious and ethnic divisions, and of course in the Iraq War that began with the 2003 US-led invasion. These 27 maps are a rough guide to today’s crisis and the deeper forces behind it.

    I am not at all sure if “explain” is the right word to use for these maps relative to the crisis in Iraq. Perhaps “illuminate” the complexity of the crisis in Iraq would be more accurate.

    Moreover, these maps have the potential, in digital form, to act as interfaces to the complex religious, ethnic and historical background to the current crisis.

    Western governments, to say nothing of governments in the Middle East, should be cautious about waving the “extremist” label around. Labeling any group as “extremist” reduces the options on all sides.

    « Newer PostsOlder Posts »

    Powered by WordPress